Free Statistics

of Irreproducible Research!

Author's title

Author*Unverified author*
R Software Modulerwasp_smp.wasp
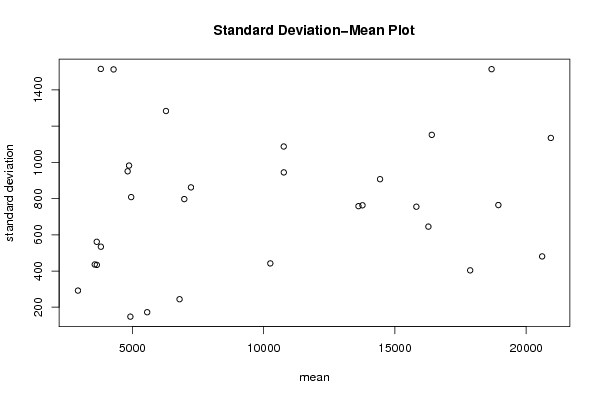
Title produced by softwareStandard Deviation-Mean Plot
Date of computationWed, 03 Aug 2011 12:22:03 -0400
Cite this page as followsStatistical Computations at FreeStatistics.org, Office for Research Development and Education, URL https://freestatistics.org/blog/index.php?v=date/2011/Aug/03/t1312388598w9spy84kxxd2awe.htm/, Retrieved Tue, 14 May 2024 15:31:54 +0000
Statistical Computations at FreeStatistics.org, Office for Research Development and Education, URL https://freestatistics.org/blog/index.php?pk=123369, Retrieved Tue, 14 May 2024 15:31:54 +0000
QR Codes:

Original text written by user:
IsPrivate?No (this computation is public)
User-defined keywordsMarin Peeters
Estimated Impact122
Family? (F = Feedback message, R = changed R code, M = changed R Module, P = changed Parameters, D = changed Data)
-       [Standard Deviation-Mean Plot] [Tijdreeks 1 - Sta...] [2011-08-03 16:22:03] [3f8170910ab21fde7eba151af40022ac] [Current]
Feedback Forum

Post a new message
Dataseries X:
5740
5639
5538
5336
7380
7279
5740
4718
4819
4819
4920
5133
4516
3898
3392
3392
5336
5538
3999
2258
3179
3179
3898
4313
4212
3179
3696
3493
5234
4819
3179
1954
3078
3392
3696
4100
3280
2572
2876
2977
5639
5639
4100
3898
4516
4212
5032
6054
6257
4819
4414
3999
6773
6976
6459
6976
6874
6054
6976
7998
8413
7178
6358
6976
9638
10458
10256
10660
10559
9537
11278
11693
12300
10458
9739
10559
12513
14254
13839
13839
14042
13333
15176
15176
14862
13120
13434
13637
14973
16714
15479
16097
15580
15277
17636
17119
16400
15378
16400
16917
17534
18354
17534
18040
17423
17322
19883
20096
19276
17838
19063
19579
20197
21118
20197
20916
20602
19478
21837
21837


Summary of computational transaction
Raw Inputview raw input (R code)
Raw Outputview raw output of R engine
Computing time1 seconds
R Server'Herman Ole Andreas Wold' @ wold.wessa.net

\begin{tabular}{lllllllll}
\hline
Summary of computational transaction \tabularnewline
Raw Input & view raw input (R code)  \tabularnewline
Raw Output & view raw output of R engine  \tabularnewline
Computing time & 1 seconds \tabularnewline
R Server & 'Herman Ole Andreas Wold' @ wold.wessa.net \tabularnewline
\hline
\end{tabular}
%Source: https://freestatistics.org/blog/index.php?pk=123369&T=0

[TABLE]
[ROW][C]Summary of computational transaction[/C][/ROW]
[ROW][C]Raw Input[/C][C]view raw input (R code) [/C][/ROW]
[ROW][C]Raw Output[/C][C]view raw output of R engine [/C][/ROW]
[ROW][C]Computing time[/C][C]1 seconds[/C][/ROW]
[ROW][C]R Server[/C][C]'Herman Ole Andreas Wold' @ wold.wessa.net[/C][/ROW]
[/TABLE]
Source: https://freestatistics.org/blog/index.php?pk=123369&T=0

Globally Unique Identifier (entire table): ba.freestatistics.org/blog/index.php?pk=123369&T=0

As an alternative you can also use a QR Code:  

The GUIDs for individual cells are displayed in the table below:

Summary of computational transaction
Raw Inputview raw input (R code)
Raw Outputview raw output of R engine
Computing time1 seconds
R Server'Herman Ole Andreas Wold' @ wold.wessa.net


Standard Deviation-Mean Plot
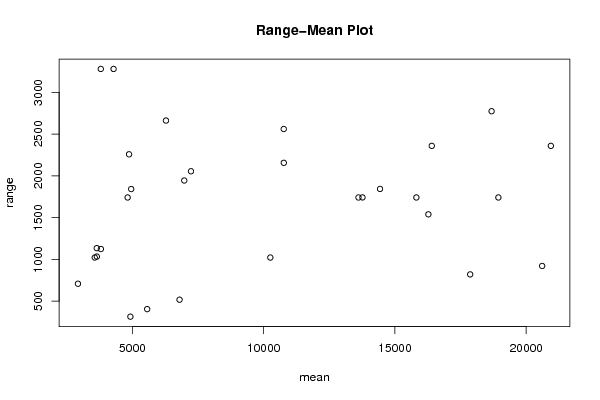
SectionMeanStandard DeviationRange
15563.25172.490337893653404
26279.251283.152725386452662
34922.75148.032372585639314
43799.5533.9122899253521124
54282.751512.736455346183280
63642.25561.1044911600691134
73645433.7241827090881033
83796.51515.258503798393280
93566.5436.0714773214751022
102926.25291.966179548248708
114819950.4388460074641741
124953.5807.9791663980781842
134872.25981.9923200650132258
146796244.198007089875517
156975.5796.8628070962611944
167231.25861.6044626161132055
1710253441.930612954871022
1810766.75944.2388027753712156
19107641087.134153021912561
2013611.25757.8523932798521741
2114431.75906.8209580727611843
2213763.25762.7508876865811742
2315815.75754.8913277198691741
24164031151.54244385522359
2516273.75644.9849481447871539
2617865.5403.677676700938820
27186811513.987450410342774
2818939763.9253890269651741
2920607480.555928066651921
3020938.51134.445091957592359

\begin{tabular}{lllllllll}
\hline
Standard Deviation-Mean Plot \tabularnewline
Section & Mean & Standard Deviation & Range \tabularnewline
1 & 5563.25 & 172.490337893653 & 404 \tabularnewline
2 & 6279.25 & 1283.15272538645 & 2662 \tabularnewline
3 & 4922.75 & 148.032372585639 & 314 \tabularnewline
4 & 3799.5 & 533.912289925352 & 1124 \tabularnewline
5 & 4282.75 & 1512.73645534618 & 3280 \tabularnewline
6 & 3642.25 & 561.104491160069 & 1134 \tabularnewline
7 & 3645 & 433.724182709088 & 1033 \tabularnewline
8 & 3796.5 & 1515.25850379839 & 3280 \tabularnewline
9 & 3566.5 & 436.071477321475 & 1022 \tabularnewline
10 & 2926.25 & 291.966179548248 & 708 \tabularnewline
11 & 4819 & 950.438846007464 & 1741 \tabularnewline
12 & 4953.5 & 807.979166398078 & 1842 \tabularnewline
13 & 4872.25 & 981.992320065013 & 2258 \tabularnewline
14 & 6796 & 244.198007089875 & 517 \tabularnewline
15 & 6975.5 & 796.862807096261 & 1944 \tabularnewline
16 & 7231.25 & 861.604462616113 & 2055 \tabularnewline
17 & 10253 & 441.93061295487 & 1022 \tabularnewline
18 & 10766.75 & 944.238802775371 & 2156 \tabularnewline
19 & 10764 & 1087.13415302191 & 2561 \tabularnewline
20 & 13611.25 & 757.852393279852 & 1741 \tabularnewline
21 & 14431.75 & 906.820958072761 & 1843 \tabularnewline
22 & 13763.25 & 762.750887686581 & 1742 \tabularnewline
23 & 15815.75 & 754.891327719869 & 1741 \tabularnewline
24 & 16403 & 1151.5424438552 & 2359 \tabularnewline
25 & 16273.75 & 644.984948144787 & 1539 \tabularnewline
26 & 17865.5 & 403.677676700938 & 820 \tabularnewline
27 & 18681 & 1513.98745041034 & 2774 \tabularnewline
28 & 18939 & 763.925389026965 & 1741 \tabularnewline
29 & 20607 & 480.555928066651 & 921 \tabularnewline
30 & 20938.5 & 1134.44509195759 & 2359 \tabularnewline
\hline
\end{tabular}
%Source: https://freestatistics.org/blog/index.php?pk=123369&T=1

[TABLE]
[ROW][C]Standard Deviation-Mean Plot[/C][/ROW]
[ROW][C]Section[/C][C]Mean[/C][C]Standard Deviation[/C][C]Range[/C][/ROW]
[ROW][C]1[/C][C]5563.25[/C][C]172.490337893653[/C][C]404[/C][/ROW]
[ROW][C]2[/C][C]6279.25[/C][C]1283.15272538645[/C][C]2662[/C][/ROW]
[ROW][C]3[/C][C]4922.75[/C][C]148.032372585639[/C][C]314[/C][/ROW]
[ROW][C]4[/C][C]3799.5[/C][C]533.912289925352[/C][C]1124[/C][/ROW]
[ROW][C]5[/C][C]4282.75[/C][C]1512.73645534618[/C][C]3280[/C][/ROW]
[ROW][C]6[/C][C]3642.25[/C][C]561.104491160069[/C][C]1134[/C][/ROW]
[ROW][C]7[/C][C]3645[/C][C]433.724182709088[/C][C]1033[/C][/ROW]
[ROW][C]8[/C][C]3796.5[/C][C]1515.25850379839[/C][C]3280[/C][/ROW]
[ROW][C]9[/C][C]3566.5[/C][C]436.071477321475[/C][C]1022[/C][/ROW]
[ROW][C]10[/C][C]2926.25[/C][C]291.966179548248[/C][C]708[/C][/ROW]
[ROW][C]11[/C][C]4819[/C][C]950.438846007464[/C][C]1741[/C][/ROW]
[ROW][C]12[/C][C]4953.5[/C][C]807.979166398078[/C][C]1842[/C][/ROW]
[ROW][C]13[/C][C]4872.25[/C][C]981.992320065013[/C][C]2258[/C][/ROW]
[ROW][C]14[/C][C]6796[/C][C]244.198007089875[/C][C]517[/C][/ROW]
[ROW][C]15[/C][C]6975.5[/C][C]796.862807096261[/C][C]1944[/C][/ROW]
[ROW][C]16[/C][C]7231.25[/C][C]861.604462616113[/C][C]2055[/C][/ROW]
[ROW][C]17[/C][C]10253[/C][C]441.93061295487[/C][C]1022[/C][/ROW]
[ROW][C]18[/C][C]10766.75[/C][C]944.238802775371[/C][C]2156[/C][/ROW]
[ROW][C]19[/C][C]10764[/C][C]1087.13415302191[/C][C]2561[/C][/ROW]
[ROW][C]20[/C][C]13611.25[/C][C]757.852393279852[/C][C]1741[/C][/ROW]
[ROW][C]21[/C][C]14431.75[/C][C]906.820958072761[/C][C]1843[/C][/ROW]
[ROW][C]22[/C][C]13763.25[/C][C]762.750887686581[/C][C]1742[/C][/ROW]
[ROW][C]23[/C][C]15815.75[/C][C]754.891327719869[/C][C]1741[/C][/ROW]
[ROW][C]24[/C][C]16403[/C][C]1151.5424438552[/C][C]2359[/C][/ROW]
[ROW][C]25[/C][C]16273.75[/C][C]644.984948144787[/C][C]1539[/C][/ROW]
[ROW][C]26[/C][C]17865.5[/C][C]403.677676700938[/C][C]820[/C][/ROW]
[ROW][C]27[/C][C]18681[/C][C]1513.98745041034[/C][C]2774[/C][/ROW]
[ROW][C]28[/C][C]18939[/C][C]763.925389026965[/C][C]1741[/C][/ROW]
[ROW][C]29[/C][C]20607[/C][C]480.555928066651[/C][C]921[/C][/ROW]
[ROW][C]30[/C][C]20938.5[/C][C]1134.44509195759[/C][C]2359[/C][/ROW]
[/TABLE]
Source: https://freestatistics.org/blog/index.php?pk=123369&T=1

Globally Unique Identifier (entire table): ba.freestatistics.org/blog/index.php?pk=123369&T=1

As an alternative you can also use a QR Code:  

The GUIDs for individual cells are displayed in the table below:

Standard Deviation-Mean Plot
SectionMeanStandard DeviationRange
15563.25172.490337893653404
26279.251283.152725386452662
34922.75148.032372585639314
43799.5533.9122899253521124
54282.751512.736455346183280
63642.25561.1044911600691134
73645433.7241827090881033
83796.51515.258503798393280
93566.5436.0714773214751022
102926.25291.966179548248708
114819950.4388460074641741
124953.5807.9791663980781842
134872.25981.9923200650132258
146796244.198007089875517
156975.5796.8628070962611944
167231.25861.6044626161132055
1710253441.930612954871022
1810766.75944.2388027753712156
19107641087.134153021912561
2013611.25757.8523932798521741
2114431.75906.8209580727611843
2213763.25762.7508876865811742
2315815.75754.8913277198691741
24164031151.54244385522359
2516273.75644.9849481447871539
2617865.5403.677676700938820
27186811513.987450410342774
2818939763.9253890269651741
2920607480.555928066651921
3020938.51134.445091957592359


Regression: S.E.(k) = alpha + beta * Mean(k)
alpha668.532000307139
beta0.0108494798842702
S.D.0.011947152476193
T-STAT0.908122659846346
p-value0.371563672700609

\begin{tabular}{lllllllll}
\hline
Regression: S.E.(k) = alpha + beta * Mean(k) \tabularnewline
alpha & 668.532000307139 \tabularnewline
beta & 0.0108494798842702 \tabularnewline
S.D. & 0.011947152476193 \tabularnewline
T-STAT & 0.908122659846346 \tabularnewline
p-value & 0.371563672700609 \tabularnewline
\hline
\end{tabular}
%Source: https://freestatistics.org/blog/index.php?pk=123369&T=2

[TABLE]
[ROW][C]Regression: S.E.(k) = alpha + beta * Mean(k)[/C][/ROW]
[ROW][C]alpha[/C][C]668.532000307139[/C][/ROW]
[ROW][C]beta[/C][C]0.0108494798842702[/C][/ROW]
[ROW][C]S.D.[/C][C]0.011947152476193[/C][/ROW]
[ROW][C]T-STAT[/C][C]0.908122659846346[/C][/ROW]
[ROW][C]p-value[/C][C]0.371563672700609[/C][/ROW]
[/TABLE]
Source: https://freestatistics.org/blog/index.php?pk=123369&T=2

Globally Unique Identifier (entire table): ba.freestatistics.org/blog/index.php?pk=123369&T=2

As an alternative you can also use a QR Code:  

The GUIDs for individual cells are displayed in the table below:

Regression: S.E.(k) = alpha + beta * Mean(k)
alpha668.532000307139
beta0.0108494798842702
S.D.0.011947152476193
T-STAT0.908122659846346
p-value0.371563672700609


Regression: ln S.E.(k) = alpha + beta * ln Mean(k)
alpha4.33302469369681
beta0.240952308795269
S.D.0.171320277073607
T-STAT1.40644360907579
p-value0.170594572956905
Lambda0.759047691204731

\begin{tabular}{lllllllll}
\hline
Regression: ln S.E.(k) = alpha + beta * ln Mean(k) \tabularnewline
alpha & 4.33302469369681 \tabularnewline
beta & 0.240952308795269 \tabularnewline
S.D. & 0.171320277073607 \tabularnewline
T-STAT & 1.40644360907579 \tabularnewline
p-value & 0.170594572956905 \tabularnewline
Lambda & 0.759047691204731 \tabularnewline
\hline
\end{tabular}
%Source: https://freestatistics.org/blog/index.php?pk=123369&T=3

[TABLE]
[ROW][C]Regression: ln S.E.(k) = alpha + beta * ln Mean(k)[/C][/ROW]
[ROW][C]alpha[/C][C]4.33302469369681[/C][/ROW]
[ROW][C]beta[/C][C]0.240952308795269[/C][/ROW]
[ROW][C]S.D.[/C][C]0.171320277073607[/C][/ROW]
[ROW][C]T-STAT[/C][C]1.40644360907579[/C][/ROW]
[ROW][C]p-value[/C][C]0.170594572956905[/C][/ROW]
[ROW][C]Lambda[/C][C]0.759047691204731[/C][/ROW]
[/TABLE]
Source: https://freestatistics.org/blog/index.php?pk=123369&T=3

Globally Unique Identifier (entire table): ba.freestatistics.org/blog/index.php?pk=123369&T=3

As an alternative you can also use a QR Code:  

The GUIDs for individual cells are displayed in the table below:

Regression: ln S.E.(k) = alpha + beta * ln Mean(k)
alpha4.33302469369681
beta0.240952308795269
S.D.0.171320277073607
T-STAT1.40644360907579
p-value0.170594572956905
Lambda0.759047691204731


Parameters (Session):
par1 = 4 ;
Parameters (R input):
par1 = 4 ;
R code (references can be found in the software module):
par1 <- as.numeric(par1)
(n <- length(x))
(np <- floor(n / par1))
arr <- array(NA,dim=c(par1,np))
j <- 0
k <- 1
for (i in 1:(np*par1))
{
j = j + 1
arr[j,k] <- x[i]
if (j == par1) {
j = 0
k=k+1
}
}
arr
arr.mean <- array(NA,dim=np)
arr.sd <- array(NA,dim=np)
arr.range <- array(NA,dim=np)
for (j in 1:np)
{
arr.mean[j] <- mean(arr[,j],na.rm=TRUE)
arr.sd[j] <- sd(arr[,j],na.rm=TRUE)
arr.range[j] <- max(arr[,j],na.rm=TRUE) - min(arr[,j],na.rm=TRUE)
}
arr.mean
arr.sd
arr.range
(lm1 <- lm(arr.sd~arr.mean))
(lnlm1 <- lm(log(arr.sd)~log(arr.mean)))
(lm2 <- lm(arr.range~arr.mean))
bitmap(file='test1.png')
plot(arr.mean,arr.sd,main='Standard Deviation-Mean Plot',xlab='mean',ylab='standard deviation')
dev.off()
bitmap(file='test2.png')
plot(arr.mean,arr.range,main='Range-Mean Plot',xlab='mean',ylab='range')
dev.off()
load(file='createtable')
a<-table.start()
a<-table.row.start(a)
a<-table.element(a,'Standard Deviation-Mean Plot',4,TRUE)
a<-table.row.end(a)
a<-table.row.start(a)
a<-table.element(a,'Section',header=TRUE)
a<-table.element(a,'Mean',header=TRUE)
a<-table.element(a,'Standard Deviation',header=TRUE)
a<-table.element(a,'Range',header=TRUE)
a<-table.row.end(a)
for (j in 1:np) {
a<-table.row.start(a)
a<-table.element(a,j,header=TRUE)
a<-table.element(a,arr.mean[j])
a<-table.element(a,arr.sd[j] )
a<-table.element(a,arr.range[j] )
a<-table.row.end(a)
}
a<-table.end(a)
table.save(a,file='mytable.tab')
a<-table.start()
a<-table.row.start(a)
a<-table.element(a,'Regression: S.E.(k) = alpha + beta * Mean(k)',2,TRUE)
a<-table.row.end(a)
a<-table.row.start(a)
a<-table.element(a,'alpha',header=TRUE)
a<-table.element(a,lm1$coefficients[[1]])
a<-table.row.end(a)
a<-table.row.start(a)
a<-table.element(a,'beta',header=TRUE)
a<-table.element(a,lm1$coefficients[[2]])
a<-table.row.end(a)
a<-table.row.start(a)
a<-table.element(a,'S.D.',header=TRUE)
a<-table.element(a,summary(lm1)$coefficients[2,2])
a<-table.row.end(a)
a<-table.row.start(a)
a<-table.element(a,'T-STAT',header=TRUE)
a<-table.element(a,summary(lm1)$coefficients[2,3])
a<-table.row.end(a)
a<-table.row.start(a)
a<-table.element(a,'p-value',header=TRUE)
a<-table.element(a,summary(lm1)$coefficients[2,4])
a<-table.row.end(a)
a<-table.end(a)
table.save(a,file='mytable1.tab')
a<-table.start()
a<-table.row.start(a)
a<-table.element(a,'Regression: ln S.E.(k) = alpha + beta * ln Mean(k)',2,TRUE)
a<-table.row.end(a)
a<-table.row.start(a)
a<-table.element(a,'alpha',header=TRUE)
a<-table.element(a,lnlm1$coefficients[[1]])
a<-table.row.end(a)
a<-table.row.start(a)
a<-table.element(a,'beta',header=TRUE)
a<-table.element(a,lnlm1$coefficients[[2]])
a<-table.row.end(a)
a<-table.row.start(a)
a<-table.element(a,'S.D.',header=TRUE)
a<-table.element(a,summary(lnlm1)$coefficients[2,2])
a<-table.row.end(a)
a<-table.row.start(a)
a<-table.element(a,'T-STAT',header=TRUE)
a<-table.element(a,summary(lnlm1)$coefficients[2,3])
a<-table.row.end(a)
a<-table.row.start(a)
a<-table.element(a,'p-value',header=TRUE)
a<-table.element(a,summary(lnlm1)$coefficients[2,4])
a<-table.row.end(a)
a<-table.row.start(a)
a<-table.element(a,'Lambda',header=TRUE)
a<-table.element(a,1-lnlm1$coefficients[[2]])
a<-table.row.end(a)
a<-table.end(a)
table.save(a,file='mytable2.tab')