Free Statistics

of Irreproducible Research!

Author's title

Author*Unverified author*
R Software Modulerwasp_autocorrelation.wasp
Title produced by software(Partial) Autocorrelation Function
Date of computationWed, 03 Aug 2011 12:17:38 -0400
Cite this page as followsStatistical Computations at FreeStatistics.org, Office for Research Development and Education, URL https://freestatistics.org/blog/index.php?v=date/2011/Aug/03/t13123883091gfwyocdz2smj3v.htm/, Retrieved Tue, 14 May 2024 04:10:27 +0000
Statistical Computations at FreeStatistics.org, Office for Research Development and Education, URL https://freestatistics.org/blog/index.php?pk=123368, Retrieved Tue, 14 May 2024 04:10:27 +0000
QR Codes:

Original text written by user:
IsPrivate?No (this computation is public)
User-defined keywordsDe Wolf Davy
Estimated Impact116
Family? (F = Feedback message, R = changed R code, M = changed R Module, P = changed Parameters, D = changed Data)
-       [(Partial) Autocorrelation Function] [TIJDREEKS B - STA...] [2011-08-03 16:17:38] [75b7fe93b57f9e359de9d9cae642ffd9] [Current]
Feedback Forum

Post a new message
Dataseries X:
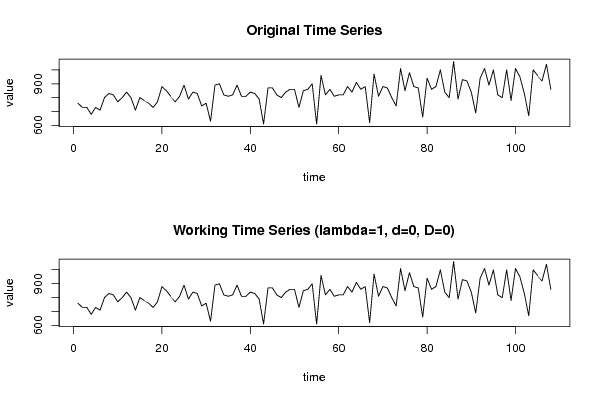
760
730
730
680
730
710
800
830
820
770
800
840
800
710
800
780
760
730
770
880
850
810
770
810
890
790
840
830
740
760
630
890
900
820
810
820
890
810
810
840
830
790
610
870
870
820
800
840
860
860
730
850
860
900
610
960
820
860
810
820
820
880
840
910
860
880
620
970
810
880
870
800
740
1010
850
980
880
870
660
940
860
880
1000
840
800
1060
790
930
920
840
690
940
1010
890
1000
820
800
1000
780
1010
950
830
670
1000
960
920
1040
860


Summary of computational transaction
Raw Inputview raw input (R code)
Raw Outputview raw output of R engine
Computing time1 seconds
R Server'Herman Ole Andreas Wold' @ wold.wessa.net

\begin{tabular}{lllllllll}
\hline
Summary of computational transaction \tabularnewline
Raw Input & view raw input (R code)  \tabularnewline
Raw Output & view raw output of R engine  \tabularnewline
Computing time & 1 seconds \tabularnewline
R Server & 'Herman Ole Andreas Wold' @ wold.wessa.net \tabularnewline
\hline
\end{tabular}
%Source: https://freestatistics.org/blog/index.php?pk=123368&T=0

[TABLE]
[ROW][C]Summary of computational transaction[/C][/ROW]
[ROW][C]Raw Input[/C][C]view raw input (R code) [/C][/ROW]
[ROW][C]Raw Output[/C][C]view raw output of R engine [/C][/ROW]
[ROW][C]Computing time[/C][C]1 seconds[/C][/ROW]
[ROW][C]R Server[/C][C]'Herman Ole Andreas Wold' @ wold.wessa.net[/C][/ROW]
[/TABLE]
Source: https://freestatistics.org/blog/index.php?pk=123368&T=0

Globally Unique Identifier (entire table): ba.freestatistics.org/blog/index.php?pk=123368&T=0

As an alternative you can also use a QR Code:  

The GUIDs for individual cells are displayed in the table below:

Summary of computational transaction
Raw Inputview raw input (R code)
Raw Outputview raw output of R engine
Computing time1 seconds
R Server'Herman Ole Andreas Wold' @ wold.wessa.net


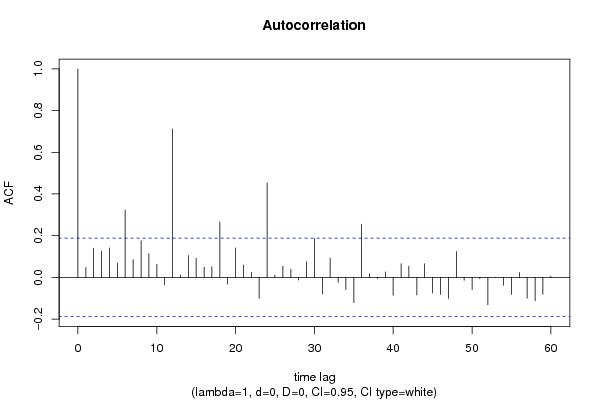
Autocorrelation Function
Time lag kACF(k)T-STATP-value
10.0467330.48570.314093
20.1396521.45130.074797
30.125941.30880.09669
40.1406861.4620.073316
50.0676260.70280.241849
60.3225163.35170.000554
70.0845050.87820.190891
80.176191.8310.034927
90.1134841.17940.120423
100.062410.64860.258993
11-0.035921-0.37330.354828
120.7115197.39430
130.0110550.11490.454375
140.1051.09120.138809
150.0909990.94570.173208
160.0487840.5070.306602
170.0512680.53280.297636
180.2656812.7610.003386
19-0.032308-0.33580.368855
200.141071.4660.072771
210.0586020.6090.271897
220.02340.24320.404163
23-0.10067-1.04620.148904
240.4524424.70194e-06
250.0100110.1040.458668
260.0528190.54890.292101
270.0390070.40540.343001
28-0.012913-0.13420.446748
290.0750090.77950.218691
300.1864641.93780.02763
31-0.079483-0.8260.205309
320.0921930.95810.170077
33-0.023892-0.24830.402192
34-0.058869-0.61180.270984
35-0.121206-1.25960.105263
360.2550622.65070.00462
370.0176450.18340.427425
38-0.005709-0.05930.476398
390.0254490.26450.395959
40-0.085603-0.88960.187826
410.065520.68090.248696
420.053320.55410.290323
43-0.084669-0.87990.190433
440.0648240.67370.25098
45-0.073822-0.76720.222325
46-0.082393-0.85630.196876
47-0.10121-1.05180.147618
480.1241141.28980.099932
49-0.013757-0.1430.44329
50-0.058566-0.60860.272024
51-0.007079-0.07360.470747
52-0.131617-1.36780.087107
530.0002930.0030.498787
54-0.037637-0.39110.348235
55-0.082697-0.85940.196008
560.0228520.23750.406364
57-0.099741-1.03650.151133
58-0.112319-1.16730.122839
59-0.081287-0.84480.200057
600.0053390.05550.477929

\begin{tabular}{lllllllll}
\hline
Autocorrelation Function \tabularnewline
Time lag k & ACF(k) & T-STAT & P-value \tabularnewline
1 & 0.046733 & 0.4857 & 0.314093 \tabularnewline
2 & 0.139652 & 1.4513 & 0.074797 \tabularnewline
3 & 0.12594 & 1.3088 & 0.09669 \tabularnewline
4 & 0.140686 & 1.462 & 0.073316 \tabularnewline
5 & 0.067626 & 0.7028 & 0.241849 \tabularnewline
6 & 0.322516 & 3.3517 & 0.000554 \tabularnewline
7 & 0.084505 & 0.8782 & 0.190891 \tabularnewline
8 & 0.17619 & 1.831 & 0.034927 \tabularnewline
9 & 0.113484 & 1.1794 & 0.120423 \tabularnewline
10 & 0.06241 & 0.6486 & 0.258993 \tabularnewline
11 & -0.035921 & -0.3733 & 0.354828 \tabularnewline
12 & 0.711519 & 7.3943 & 0 \tabularnewline
13 & 0.011055 & 0.1149 & 0.454375 \tabularnewline
14 & 0.105 & 1.0912 & 0.138809 \tabularnewline
15 & 0.090999 & 0.9457 & 0.173208 \tabularnewline
16 & 0.048784 & 0.507 & 0.306602 \tabularnewline
17 & 0.051268 & 0.5328 & 0.297636 \tabularnewline
18 & 0.265681 & 2.761 & 0.003386 \tabularnewline
19 & -0.032308 & -0.3358 & 0.368855 \tabularnewline
20 & 0.14107 & 1.466 & 0.072771 \tabularnewline
21 & 0.058602 & 0.609 & 0.271897 \tabularnewline
22 & 0.0234 & 0.2432 & 0.404163 \tabularnewline
23 & -0.10067 & -1.0462 & 0.148904 \tabularnewline
24 & 0.452442 & 4.7019 & 4e-06 \tabularnewline
25 & 0.010011 & 0.104 & 0.458668 \tabularnewline
26 & 0.052819 & 0.5489 & 0.292101 \tabularnewline
27 & 0.039007 & 0.4054 & 0.343001 \tabularnewline
28 & -0.012913 & -0.1342 & 0.446748 \tabularnewline
29 & 0.075009 & 0.7795 & 0.218691 \tabularnewline
30 & 0.186464 & 1.9378 & 0.02763 \tabularnewline
31 & -0.079483 & -0.826 & 0.205309 \tabularnewline
32 & 0.092193 & 0.9581 & 0.170077 \tabularnewline
33 & -0.023892 & -0.2483 & 0.402192 \tabularnewline
34 & -0.058869 & -0.6118 & 0.270984 \tabularnewline
35 & -0.121206 & -1.2596 & 0.105263 \tabularnewline
36 & 0.255062 & 2.6507 & 0.00462 \tabularnewline
37 & 0.017645 & 0.1834 & 0.427425 \tabularnewline
38 & -0.005709 & -0.0593 & 0.476398 \tabularnewline
39 & 0.025449 & 0.2645 & 0.395959 \tabularnewline
40 & -0.085603 & -0.8896 & 0.187826 \tabularnewline
41 & 0.06552 & 0.6809 & 0.248696 \tabularnewline
42 & 0.05332 & 0.5541 & 0.290323 \tabularnewline
43 & -0.084669 & -0.8799 & 0.190433 \tabularnewline
44 & 0.064824 & 0.6737 & 0.25098 \tabularnewline
45 & -0.073822 & -0.7672 & 0.222325 \tabularnewline
46 & -0.082393 & -0.8563 & 0.196876 \tabularnewline
47 & -0.10121 & -1.0518 & 0.147618 \tabularnewline
48 & 0.124114 & 1.2898 & 0.099932 \tabularnewline
49 & -0.013757 & -0.143 & 0.44329 \tabularnewline
50 & -0.058566 & -0.6086 & 0.272024 \tabularnewline
51 & -0.007079 & -0.0736 & 0.470747 \tabularnewline
52 & -0.131617 & -1.3678 & 0.087107 \tabularnewline
53 & 0.000293 & 0.003 & 0.498787 \tabularnewline
54 & -0.037637 & -0.3911 & 0.348235 \tabularnewline
55 & -0.082697 & -0.8594 & 0.196008 \tabularnewline
56 & 0.022852 & 0.2375 & 0.406364 \tabularnewline
57 & -0.099741 & -1.0365 & 0.151133 \tabularnewline
58 & -0.112319 & -1.1673 & 0.122839 \tabularnewline
59 & -0.081287 & -0.8448 & 0.200057 \tabularnewline
60 & 0.005339 & 0.0555 & 0.477929 \tabularnewline
\hline
\end{tabular}
%Source: https://freestatistics.org/blog/index.php?pk=123368&T=1

[TABLE]
[ROW][C]Autocorrelation Function[/C][/ROW]
[ROW][C]Time lag k[/C][C]ACF(k)[/C][C]T-STAT[/C][C]P-value[/C][/ROW]
[ROW][C]1[/C][C]0.046733[/C][C]0.4857[/C][C]0.314093[/C][/ROW]
[ROW][C]2[/C][C]0.139652[/C][C]1.4513[/C][C]0.074797[/C][/ROW]
[ROW][C]3[/C][C]0.12594[/C][C]1.3088[/C][C]0.09669[/C][/ROW]
[ROW][C]4[/C][C]0.140686[/C][C]1.462[/C][C]0.073316[/C][/ROW]
[ROW][C]5[/C][C]0.067626[/C][C]0.7028[/C][C]0.241849[/C][/ROW]
[ROW][C]6[/C][C]0.322516[/C][C]3.3517[/C][C]0.000554[/C][/ROW]
[ROW][C]7[/C][C]0.084505[/C][C]0.8782[/C][C]0.190891[/C][/ROW]
[ROW][C]8[/C][C]0.17619[/C][C]1.831[/C][C]0.034927[/C][/ROW]
[ROW][C]9[/C][C]0.113484[/C][C]1.1794[/C][C]0.120423[/C][/ROW]
[ROW][C]10[/C][C]0.06241[/C][C]0.6486[/C][C]0.258993[/C][/ROW]
[ROW][C]11[/C][C]-0.035921[/C][C]-0.3733[/C][C]0.354828[/C][/ROW]
[ROW][C]12[/C][C]0.711519[/C][C]7.3943[/C][C]0[/C][/ROW]
[ROW][C]13[/C][C]0.011055[/C][C]0.1149[/C][C]0.454375[/C][/ROW]
[ROW][C]14[/C][C]0.105[/C][C]1.0912[/C][C]0.138809[/C][/ROW]
[ROW][C]15[/C][C]0.090999[/C][C]0.9457[/C][C]0.173208[/C][/ROW]
[ROW][C]16[/C][C]0.048784[/C][C]0.507[/C][C]0.306602[/C][/ROW]
[ROW][C]17[/C][C]0.051268[/C][C]0.5328[/C][C]0.297636[/C][/ROW]
[ROW][C]18[/C][C]0.265681[/C][C]2.761[/C][C]0.003386[/C][/ROW]
[ROW][C]19[/C][C]-0.032308[/C][C]-0.3358[/C][C]0.368855[/C][/ROW]
[ROW][C]20[/C][C]0.14107[/C][C]1.466[/C][C]0.072771[/C][/ROW]
[ROW][C]21[/C][C]0.058602[/C][C]0.609[/C][C]0.271897[/C][/ROW]
[ROW][C]22[/C][C]0.0234[/C][C]0.2432[/C][C]0.404163[/C][/ROW]
[ROW][C]23[/C][C]-0.10067[/C][C]-1.0462[/C][C]0.148904[/C][/ROW]
[ROW][C]24[/C][C]0.452442[/C][C]4.7019[/C][C]4e-06[/C][/ROW]
[ROW][C]25[/C][C]0.010011[/C][C]0.104[/C][C]0.458668[/C][/ROW]
[ROW][C]26[/C][C]0.052819[/C][C]0.5489[/C][C]0.292101[/C][/ROW]
[ROW][C]27[/C][C]0.039007[/C][C]0.4054[/C][C]0.343001[/C][/ROW]
[ROW][C]28[/C][C]-0.012913[/C][C]-0.1342[/C][C]0.446748[/C][/ROW]
[ROW][C]29[/C][C]0.075009[/C][C]0.7795[/C][C]0.218691[/C][/ROW]
[ROW][C]30[/C][C]0.186464[/C][C]1.9378[/C][C]0.02763[/C][/ROW]
[ROW][C]31[/C][C]-0.079483[/C][C]-0.826[/C][C]0.205309[/C][/ROW]
[ROW][C]32[/C][C]0.092193[/C][C]0.9581[/C][C]0.170077[/C][/ROW]
[ROW][C]33[/C][C]-0.023892[/C][C]-0.2483[/C][C]0.402192[/C][/ROW]
[ROW][C]34[/C][C]-0.058869[/C][C]-0.6118[/C][C]0.270984[/C][/ROW]
[ROW][C]35[/C][C]-0.121206[/C][C]-1.2596[/C][C]0.105263[/C][/ROW]
[ROW][C]36[/C][C]0.255062[/C][C]2.6507[/C][C]0.00462[/C][/ROW]
[ROW][C]37[/C][C]0.017645[/C][C]0.1834[/C][C]0.427425[/C][/ROW]
[ROW][C]38[/C][C]-0.005709[/C][C]-0.0593[/C][C]0.476398[/C][/ROW]
[ROW][C]39[/C][C]0.025449[/C][C]0.2645[/C][C]0.395959[/C][/ROW]
[ROW][C]40[/C][C]-0.085603[/C][C]-0.8896[/C][C]0.187826[/C][/ROW]
[ROW][C]41[/C][C]0.06552[/C][C]0.6809[/C][C]0.248696[/C][/ROW]
[ROW][C]42[/C][C]0.05332[/C][C]0.5541[/C][C]0.290323[/C][/ROW]
[ROW][C]43[/C][C]-0.084669[/C][C]-0.8799[/C][C]0.190433[/C][/ROW]
[ROW][C]44[/C][C]0.064824[/C][C]0.6737[/C][C]0.25098[/C][/ROW]
[ROW][C]45[/C][C]-0.073822[/C][C]-0.7672[/C][C]0.222325[/C][/ROW]
[ROW][C]46[/C][C]-0.082393[/C][C]-0.8563[/C][C]0.196876[/C][/ROW]
[ROW][C]47[/C][C]-0.10121[/C][C]-1.0518[/C][C]0.147618[/C][/ROW]
[ROW][C]48[/C][C]0.124114[/C][C]1.2898[/C][C]0.099932[/C][/ROW]
[ROW][C]49[/C][C]-0.013757[/C][C]-0.143[/C][C]0.44329[/C][/ROW]
[ROW][C]50[/C][C]-0.058566[/C][C]-0.6086[/C][C]0.272024[/C][/ROW]
[ROW][C]51[/C][C]-0.007079[/C][C]-0.0736[/C][C]0.470747[/C][/ROW]
[ROW][C]52[/C][C]-0.131617[/C][C]-1.3678[/C][C]0.087107[/C][/ROW]
[ROW][C]53[/C][C]0.000293[/C][C]0.003[/C][C]0.498787[/C][/ROW]
[ROW][C]54[/C][C]-0.037637[/C][C]-0.3911[/C][C]0.348235[/C][/ROW]
[ROW][C]55[/C][C]-0.082697[/C][C]-0.8594[/C][C]0.196008[/C][/ROW]
[ROW][C]56[/C][C]0.022852[/C][C]0.2375[/C][C]0.406364[/C][/ROW]
[ROW][C]57[/C][C]-0.099741[/C][C]-1.0365[/C][C]0.151133[/C][/ROW]
[ROW][C]58[/C][C]-0.112319[/C][C]-1.1673[/C][C]0.122839[/C][/ROW]
[ROW][C]59[/C][C]-0.081287[/C][C]-0.8448[/C][C]0.200057[/C][/ROW]
[ROW][C]60[/C][C]0.005339[/C][C]0.0555[/C][C]0.477929[/C][/ROW]
[/TABLE]
Source: https://freestatistics.org/blog/index.php?pk=123368&T=1

Globally Unique Identifier (entire table): ba.freestatistics.org/blog/index.php?pk=123368&T=1

As an alternative you can also use a QR Code:  

The GUIDs for individual cells are displayed in the table below:

Autocorrelation Function
Time lag kACF(k)T-STATP-value
10.0467330.48570.314093
20.1396521.45130.074797
30.125941.30880.09669
40.1406861.4620.073316
50.0676260.70280.241849
60.3225163.35170.000554
70.0845050.87820.190891
80.176191.8310.034927
90.1134841.17940.120423
100.062410.64860.258993
11-0.035921-0.37330.354828
120.7115197.39430
130.0110550.11490.454375
140.1051.09120.138809
150.0909990.94570.173208
160.0487840.5070.306602
170.0512680.53280.297636
180.2656812.7610.003386
19-0.032308-0.33580.368855
200.141071.4660.072771
210.0586020.6090.271897
220.02340.24320.404163
23-0.10067-1.04620.148904
240.4524424.70194e-06
250.0100110.1040.458668
260.0528190.54890.292101
270.0390070.40540.343001
28-0.012913-0.13420.446748
290.0750090.77950.218691
300.1864641.93780.02763
31-0.079483-0.8260.205309
320.0921930.95810.170077
33-0.023892-0.24830.402192
34-0.058869-0.61180.270984
35-0.121206-1.25960.105263
360.2550622.65070.00462
370.0176450.18340.427425
38-0.005709-0.05930.476398
390.0254490.26450.395959
40-0.085603-0.88960.187826
410.065520.68090.248696
420.053320.55410.290323
43-0.084669-0.87990.190433
440.0648240.67370.25098
45-0.073822-0.76720.222325
46-0.082393-0.85630.196876
47-0.10121-1.05180.147618
480.1241141.28980.099932
49-0.013757-0.1430.44329
50-0.058566-0.60860.272024
51-0.007079-0.07360.470747
52-0.131617-1.36780.087107
530.0002930.0030.498787
54-0.037637-0.39110.348235
55-0.082697-0.85940.196008
560.0228520.23750.406364
57-0.099741-1.03650.151133
58-0.112319-1.16730.122839
59-0.081287-0.84480.200057
600.0053390.05550.477929


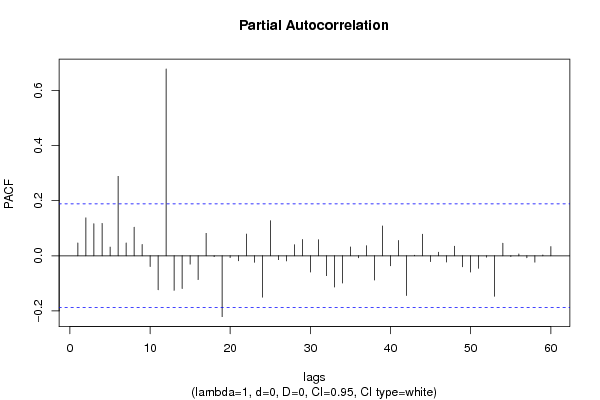
Partial Autocorrelation Function
Time lag kPACF(k)T-STATP-value
10.0467330.48570.314093
20.1377691.43170.077554
30.1163311.20890.114661
40.1176511.22270.112058
50.0315080.32740.371985
60.2883932.99710.001691
70.0465220.48350.314869
80.1034621.07520.14234
90.0413230.42940.33423
10-0.039079-0.40610.34273
11-0.123657-1.28510.100757
120.678587.0520
13-0.125528-1.30450.097414
14-0.11881-1.23470.109809
15-0.030398-0.31590.376341
16-0.086475-0.89870.185414
170.0815380.84740.199333
18-0.003186-0.03310.486824
19-0.221042-2.29710.01177
20-0.006558-0.06820.472894
21-0.018184-0.1890.425233
220.0786380.81720.207797
23-0.023201-0.24110.404962
24-0.150103-1.55990.060853
250.1272181.32210.094466
26-0.014047-0.1460.442106
27-0.018469-0.19190.424077
280.040310.41890.338055
290.0592340.61560.269733
30-0.059186-0.61510.269897
310.0584140.60710.272545
32-0.072014-0.74840.227926
33-0.113462-1.17910.120468
34-0.099092-1.02980.152703
350.0319790.33230.370141
36-0.006923-0.07190.471388
370.036350.37780.353176
38-0.088173-0.91630.180771
390.1084411.1270.131129
40-0.036118-0.37530.354069
410.055420.57590.282928
42-0.144258-1.49920.068373
430.0017040.01770.492951
440.0780110.81070.209658
45-0.021109-0.21940.413388
460.0127720.13270.447328
47-0.022525-0.23410.407682
480.0344870.35840.360371
49-0.039587-0.41140.340799
50-0.05921-0.61530.269816
51-0.04524-0.47010.319599
52-0.004817-0.05010.480083
53-0.146833-1.52590.064975
540.0456190.47410.318197
55-0.002508-0.02610.489627
560.0066170.06880.472652
57-0.007022-0.0730.470982
58-0.023086-0.23990.405425
590.0031310.03250.487051
600.0334180.34730.364524

\begin{tabular}{lllllllll}
\hline
Partial Autocorrelation Function \tabularnewline
Time lag k & PACF(k) & T-STAT & P-value \tabularnewline
1 & 0.046733 & 0.4857 & 0.314093 \tabularnewline
2 & 0.137769 & 1.4317 & 0.077554 \tabularnewline
3 & 0.116331 & 1.2089 & 0.114661 \tabularnewline
4 & 0.117651 & 1.2227 & 0.112058 \tabularnewline
5 & 0.031508 & 0.3274 & 0.371985 \tabularnewline
6 & 0.288393 & 2.9971 & 0.001691 \tabularnewline
7 & 0.046522 & 0.4835 & 0.314869 \tabularnewline
8 & 0.103462 & 1.0752 & 0.14234 \tabularnewline
9 & 0.041323 & 0.4294 & 0.33423 \tabularnewline
10 & -0.039079 & -0.4061 & 0.34273 \tabularnewline
11 & -0.123657 & -1.2851 & 0.100757 \tabularnewline
12 & 0.67858 & 7.052 & 0 \tabularnewline
13 & -0.125528 & -1.3045 & 0.097414 \tabularnewline
14 & -0.11881 & -1.2347 & 0.109809 \tabularnewline
15 & -0.030398 & -0.3159 & 0.376341 \tabularnewline
16 & -0.086475 & -0.8987 & 0.185414 \tabularnewline
17 & 0.081538 & 0.8474 & 0.199333 \tabularnewline
18 & -0.003186 & -0.0331 & 0.486824 \tabularnewline
19 & -0.221042 & -2.2971 & 0.01177 \tabularnewline
20 & -0.006558 & -0.0682 & 0.472894 \tabularnewline
21 & -0.018184 & -0.189 & 0.425233 \tabularnewline
22 & 0.078638 & 0.8172 & 0.207797 \tabularnewline
23 & -0.023201 & -0.2411 & 0.404962 \tabularnewline
24 & -0.150103 & -1.5599 & 0.060853 \tabularnewline
25 & 0.127218 & 1.3221 & 0.094466 \tabularnewline
26 & -0.014047 & -0.146 & 0.442106 \tabularnewline
27 & -0.018469 & -0.1919 & 0.424077 \tabularnewline
28 & 0.04031 & 0.4189 & 0.338055 \tabularnewline
29 & 0.059234 & 0.6156 & 0.269733 \tabularnewline
30 & -0.059186 & -0.6151 & 0.269897 \tabularnewline
31 & 0.058414 & 0.6071 & 0.272545 \tabularnewline
32 & -0.072014 & -0.7484 & 0.227926 \tabularnewline
33 & -0.113462 & -1.1791 & 0.120468 \tabularnewline
34 & -0.099092 & -1.0298 & 0.152703 \tabularnewline
35 & 0.031979 & 0.3323 & 0.370141 \tabularnewline
36 & -0.006923 & -0.0719 & 0.471388 \tabularnewline
37 & 0.03635 & 0.3778 & 0.353176 \tabularnewline
38 & -0.088173 & -0.9163 & 0.180771 \tabularnewline
39 & 0.108441 & 1.127 & 0.131129 \tabularnewline
40 & -0.036118 & -0.3753 & 0.354069 \tabularnewline
41 & 0.05542 & 0.5759 & 0.282928 \tabularnewline
42 & -0.144258 & -1.4992 & 0.068373 \tabularnewline
43 & 0.001704 & 0.0177 & 0.492951 \tabularnewline
44 & 0.078011 & 0.8107 & 0.209658 \tabularnewline
45 & -0.021109 & -0.2194 & 0.413388 \tabularnewline
46 & 0.012772 & 0.1327 & 0.447328 \tabularnewline
47 & -0.022525 & -0.2341 & 0.407682 \tabularnewline
48 & 0.034487 & 0.3584 & 0.360371 \tabularnewline
49 & -0.039587 & -0.4114 & 0.340799 \tabularnewline
50 & -0.05921 & -0.6153 & 0.269816 \tabularnewline
51 & -0.04524 & -0.4701 & 0.319599 \tabularnewline
52 & -0.004817 & -0.0501 & 0.480083 \tabularnewline
53 & -0.146833 & -1.5259 & 0.064975 \tabularnewline
54 & 0.045619 & 0.4741 & 0.318197 \tabularnewline
55 & -0.002508 & -0.0261 & 0.489627 \tabularnewline
56 & 0.006617 & 0.0688 & 0.472652 \tabularnewline
57 & -0.007022 & -0.073 & 0.470982 \tabularnewline
58 & -0.023086 & -0.2399 & 0.405425 \tabularnewline
59 & 0.003131 & 0.0325 & 0.487051 \tabularnewline
60 & 0.033418 & 0.3473 & 0.364524 \tabularnewline
\hline
\end{tabular}
%Source: https://freestatistics.org/blog/index.php?pk=123368&T=2

[TABLE]
[ROW][C]Partial Autocorrelation Function[/C][/ROW]
[ROW][C]Time lag k[/C][C]PACF(k)[/C][C]T-STAT[/C][C]P-value[/C][/ROW]
[ROW][C]1[/C][C]0.046733[/C][C]0.4857[/C][C]0.314093[/C][/ROW]
[ROW][C]2[/C][C]0.137769[/C][C]1.4317[/C][C]0.077554[/C][/ROW]
[ROW][C]3[/C][C]0.116331[/C][C]1.2089[/C][C]0.114661[/C][/ROW]
[ROW][C]4[/C][C]0.117651[/C][C]1.2227[/C][C]0.112058[/C][/ROW]
[ROW][C]5[/C][C]0.031508[/C][C]0.3274[/C][C]0.371985[/C][/ROW]
[ROW][C]6[/C][C]0.288393[/C][C]2.9971[/C][C]0.001691[/C][/ROW]
[ROW][C]7[/C][C]0.046522[/C][C]0.4835[/C][C]0.314869[/C][/ROW]
[ROW][C]8[/C][C]0.103462[/C][C]1.0752[/C][C]0.14234[/C][/ROW]
[ROW][C]9[/C][C]0.041323[/C][C]0.4294[/C][C]0.33423[/C][/ROW]
[ROW][C]10[/C][C]-0.039079[/C][C]-0.4061[/C][C]0.34273[/C][/ROW]
[ROW][C]11[/C][C]-0.123657[/C][C]-1.2851[/C][C]0.100757[/C][/ROW]
[ROW][C]12[/C][C]0.67858[/C][C]7.052[/C][C]0[/C][/ROW]
[ROW][C]13[/C][C]-0.125528[/C][C]-1.3045[/C][C]0.097414[/C][/ROW]
[ROW][C]14[/C][C]-0.11881[/C][C]-1.2347[/C][C]0.109809[/C][/ROW]
[ROW][C]15[/C][C]-0.030398[/C][C]-0.3159[/C][C]0.376341[/C][/ROW]
[ROW][C]16[/C][C]-0.086475[/C][C]-0.8987[/C][C]0.185414[/C][/ROW]
[ROW][C]17[/C][C]0.081538[/C][C]0.8474[/C][C]0.199333[/C][/ROW]
[ROW][C]18[/C][C]-0.003186[/C][C]-0.0331[/C][C]0.486824[/C][/ROW]
[ROW][C]19[/C][C]-0.221042[/C][C]-2.2971[/C][C]0.01177[/C][/ROW]
[ROW][C]20[/C][C]-0.006558[/C][C]-0.0682[/C][C]0.472894[/C][/ROW]
[ROW][C]21[/C][C]-0.018184[/C][C]-0.189[/C][C]0.425233[/C][/ROW]
[ROW][C]22[/C][C]0.078638[/C][C]0.8172[/C][C]0.207797[/C][/ROW]
[ROW][C]23[/C][C]-0.023201[/C][C]-0.2411[/C][C]0.404962[/C][/ROW]
[ROW][C]24[/C][C]-0.150103[/C][C]-1.5599[/C][C]0.060853[/C][/ROW]
[ROW][C]25[/C][C]0.127218[/C][C]1.3221[/C][C]0.094466[/C][/ROW]
[ROW][C]26[/C][C]-0.014047[/C][C]-0.146[/C][C]0.442106[/C][/ROW]
[ROW][C]27[/C][C]-0.018469[/C][C]-0.1919[/C][C]0.424077[/C][/ROW]
[ROW][C]28[/C][C]0.04031[/C][C]0.4189[/C][C]0.338055[/C][/ROW]
[ROW][C]29[/C][C]0.059234[/C][C]0.6156[/C][C]0.269733[/C][/ROW]
[ROW][C]30[/C][C]-0.059186[/C][C]-0.6151[/C][C]0.269897[/C][/ROW]
[ROW][C]31[/C][C]0.058414[/C][C]0.6071[/C][C]0.272545[/C][/ROW]
[ROW][C]32[/C][C]-0.072014[/C][C]-0.7484[/C][C]0.227926[/C][/ROW]
[ROW][C]33[/C][C]-0.113462[/C][C]-1.1791[/C][C]0.120468[/C][/ROW]
[ROW][C]34[/C][C]-0.099092[/C][C]-1.0298[/C][C]0.152703[/C][/ROW]
[ROW][C]35[/C][C]0.031979[/C][C]0.3323[/C][C]0.370141[/C][/ROW]
[ROW][C]36[/C][C]-0.006923[/C][C]-0.0719[/C][C]0.471388[/C][/ROW]
[ROW][C]37[/C][C]0.03635[/C][C]0.3778[/C][C]0.353176[/C][/ROW]
[ROW][C]38[/C][C]-0.088173[/C][C]-0.9163[/C][C]0.180771[/C][/ROW]
[ROW][C]39[/C][C]0.108441[/C][C]1.127[/C][C]0.131129[/C][/ROW]
[ROW][C]40[/C][C]-0.036118[/C][C]-0.3753[/C][C]0.354069[/C][/ROW]
[ROW][C]41[/C][C]0.05542[/C][C]0.5759[/C][C]0.282928[/C][/ROW]
[ROW][C]42[/C][C]-0.144258[/C][C]-1.4992[/C][C]0.068373[/C][/ROW]
[ROW][C]43[/C][C]0.001704[/C][C]0.0177[/C][C]0.492951[/C][/ROW]
[ROW][C]44[/C][C]0.078011[/C][C]0.8107[/C][C]0.209658[/C][/ROW]
[ROW][C]45[/C][C]-0.021109[/C][C]-0.2194[/C][C]0.413388[/C][/ROW]
[ROW][C]46[/C][C]0.012772[/C][C]0.1327[/C][C]0.447328[/C][/ROW]
[ROW][C]47[/C][C]-0.022525[/C][C]-0.2341[/C][C]0.407682[/C][/ROW]
[ROW][C]48[/C][C]0.034487[/C][C]0.3584[/C][C]0.360371[/C][/ROW]
[ROW][C]49[/C][C]-0.039587[/C][C]-0.4114[/C][C]0.340799[/C][/ROW]
[ROW][C]50[/C][C]-0.05921[/C][C]-0.6153[/C][C]0.269816[/C][/ROW]
[ROW][C]51[/C][C]-0.04524[/C][C]-0.4701[/C][C]0.319599[/C][/ROW]
[ROW][C]52[/C][C]-0.004817[/C][C]-0.0501[/C][C]0.480083[/C][/ROW]
[ROW][C]53[/C][C]-0.146833[/C][C]-1.5259[/C][C]0.064975[/C][/ROW]
[ROW][C]54[/C][C]0.045619[/C][C]0.4741[/C][C]0.318197[/C][/ROW]
[ROW][C]55[/C][C]-0.002508[/C][C]-0.0261[/C][C]0.489627[/C][/ROW]
[ROW][C]56[/C][C]0.006617[/C][C]0.0688[/C][C]0.472652[/C][/ROW]
[ROW][C]57[/C][C]-0.007022[/C][C]-0.073[/C][C]0.470982[/C][/ROW]
[ROW][C]58[/C][C]-0.023086[/C][C]-0.2399[/C][C]0.405425[/C][/ROW]
[ROW][C]59[/C][C]0.003131[/C][C]0.0325[/C][C]0.487051[/C][/ROW]
[ROW][C]60[/C][C]0.033418[/C][C]0.3473[/C][C]0.364524[/C][/ROW]
[/TABLE]
Source: https://freestatistics.org/blog/index.php?pk=123368&T=2

Globally Unique Identifier (entire table): ba.freestatistics.org/blog/index.php?pk=123368&T=2

As an alternative you can also use a QR Code:  

The GUIDs for individual cells are displayed in the table below:

Partial Autocorrelation Function
Time lag kPACF(k)T-STATP-value
10.0467330.48570.314093
20.1377691.43170.077554
30.1163311.20890.114661
40.1176511.22270.112058
50.0315080.32740.371985
60.2883932.99710.001691
70.0465220.48350.314869
80.1034621.07520.14234
90.0413230.42940.33423
10-0.039079-0.40610.34273
11-0.123657-1.28510.100757
120.678587.0520
13-0.125528-1.30450.097414
14-0.11881-1.23470.109809
15-0.030398-0.31590.376341
16-0.086475-0.89870.185414
170.0815380.84740.199333
18-0.003186-0.03310.486824
19-0.221042-2.29710.01177
20-0.006558-0.06820.472894
21-0.018184-0.1890.425233
220.0786380.81720.207797
23-0.023201-0.24110.404962
24-0.150103-1.55990.060853
250.1272181.32210.094466
26-0.014047-0.1460.442106
27-0.018469-0.19190.424077
280.040310.41890.338055
290.0592340.61560.269733
30-0.059186-0.61510.269897
310.0584140.60710.272545
32-0.072014-0.74840.227926
33-0.113462-1.17910.120468
34-0.099092-1.02980.152703
350.0319790.33230.370141
36-0.006923-0.07190.471388
370.036350.37780.353176
38-0.088173-0.91630.180771
390.1084411.1270.131129
40-0.036118-0.37530.354069
410.055420.57590.282928
42-0.144258-1.49920.068373
430.0017040.01770.492951
440.0780110.81070.209658
45-0.021109-0.21940.413388
460.0127720.13270.447328
47-0.022525-0.23410.407682
480.0344870.35840.360371
49-0.039587-0.41140.340799
50-0.05921-0.61530.269816
51-0.04524-0.47010.319599
52-0.004817-0.05010.480083
53-0.146833-1.52590.064975
540.0456190.47410.318197
55-0.002508-0.02610.489627
560.0066170.06880.472652
57-0.007022-0.0730.470982
58-0.023086-0.23990.405425
590.0031310.03250.487051
600.0334180.34730.364524


Parameters (Session):
par1 = 60 ; par2 = 1 ; par3 = 0 ; par4 = 0 ; par5 = 12 ; par6 = White Noise ; par7 = 0.95 ;
Parameters (R input):
par1 = 60 ; par2 = 1 ; par3 = 0 ; par4 = 0 ; par5 = 12 ; par6 = White Noise ; par7 = 0.95 ; par8 = ;
R code (references can be found in the software module):
if (par1 == 'Default') {
par1 = 10*log10(length(x))
} else {
par1 <- as.numeric(par1)
}
par2 <- as.numeric(par2)
par3 <- as.numeric(par3)
par4 <- as.numeric(par4)
par5 <- as.numeric(par5)
if (par6 == 'White Noise') par6 <- 'white' else par6 <- 'ma'
par7 <- as.numeric(par7)
if (par8 != '') par8 <- as.numeric(par8)
ox <- x
if (par8 == '') {
if (par2 == 0) {
x <- log(x)
} else {
x <- (x ^ par2 - 1) / par2
}
} else {
x <- log(x,base=par8)
}
if (par3 > 0) x <- diff(x,lag=1,difference=par3)
if (par4 > 0) x <- diff(x,lag=par5,difference=par4)
bitmap(file='picts.png')
op <- par(mfrow=c(2,1))
plot(ox,type='l',main='Original Time Series',xlab='time',ylab='value')
if (par8=='') {
mytitle <- paste('Working Time Series (lambda=',par2,', d=',par3,', D=',par4,')',sep='')
mysub <- paste('(lambda=',par2,', d=',par3,', D=',par4,', CI=', par7, ', CI type=',par6,')',sep='')
} else {
mytitle <- paste('Working Time Series (base=',par8,', d=',par3,', D=',par4,')',sep='')
mysub <- paste('(base=',par8,', d=',par3,', D=',par4,', CI=', par7, ', CI type=',par6,')',sep='')
}
plot(x,type='l', main=mytitle,xlab='time',ylab='value')
par(op)
dev.off()
bitmap(file='pic1.png')
racf <- acf(x, par1, main='Autocorrelation', xlab='time lag', ylab='ACF', ci.type=par6, ci=par7, sub=mysub)
dev.off()
bitmap(file='pic2.png')
rpacf <- pacf(x,par1,main='Partial Autocorrelation',xlab='lags',ylab='PACF',sub=mysub)
dev.off()
(myacf <- c(racf$acf))
(mypacf <- c(rpacf$acf))
lengthx <- length(x)
sqrtn <- sqrt(lengthx)
load(file='createtable')
a<-table.start()
a<-table.row.start(a)
a<-table.element(a,'Autocorrelation Function',4,TRUE)
a<-table.row.end(a)
a<-table.row.start(a)
a<-table.element(a,'Time lag k',header=TRUE)
a<-table.element(a,hyperlink('basics.htm','ACF(k)','click here for more information about the Autocorrelation Function'),header=TRUE)
a<-table.element(a,'T-STAT',header=TRUE)
a<-table.element(a,'P-value',header=TRUE)
a<-table.row.end(a)
for (i in 2:(par1+1)) {
a<-table.row.start(a)
a<-table.element(a,i-1,header=TRUE)
a<-table.element(a,round(myacf[i],6))
mytstat <- myacf[i]*sqrtn
a<-table.element(a,round(mytstat,4))
a<-table.element(a,round(1-pt(abs(mytstat),lengthx),6))
a<-table.row.end(a)
}
a<-table.end(a)
table.save(a,file='mytable.tab')
a<-table.start()
a<-table.row.start(a)
a<-table.element(a,'Partial Autocorrelation Function',4,TRUE)
a<-table.row.end(a)
a<-table.row.start(a)
a<-table.element(a,'Time lag k',header=TRUE)
a<-table.element(a,hyperlink('basics.htm','PACF(k)','click here for more information about the Partial Autocorrelation Function'),header=TRUE)
a<-table.element(a,'T-STAT',header=TRUE)
a<-table.element(a,'P-value',header=TRUE)
a<-table.row.end(a)
for (i in 1:par1) {
a<-table.row.start(a)
a<-table.element(a,i,header=TRUE)
a<-table.element(a,round(mypacf[i],6))
mytstat <- mypacf[i]*sqrtn
a<-table.element(a,round(mytstat,4))
a<-table.element(a,round(1-pt(abs(mytstat),lengthx),6))
a<-table.row.end(a)
}
a<-table.end(a)
table.save(a,file='mytable1.tab')