Free Statistics

of Irreproducible Research!

Author's title

Author*Unverified author*
R Software Modulerwasp_autocorrelation.wasp
Title produced by software(Partial) Autocorrelation Function
Date of computationWed, 03 Aug 2011 11:23:48 -0400
Cite this page as followsStatistical Computations at FreeStatistics.org, Office for Research Development and Education, URL https://freestatistics.org/blog/index.php?v=date/2011/Aug/03/t1312385190j4br06xexuby86v.htm/, Retrieved Tue, 14 May 2024 03:40:13 +0000
Statistical Computations at FreeStatistics.org, Office for Research Development and Education, URL https://freestatistics.org/blog/index.php?pk=123362, Retrieved Tue, 14 May 2024 03:40:13 +0000
QR Codes:

Original text written by user:
IsPrivate?No (this computation is public)
User-defined keywordsMarin Peeters
Estimated Impact100
Family? (F = Feedback message, R = changed R code, M = changed R Module, P = changed Parameters, D = changed Data)
-       [(Partial) Autocorrelation Function] [Tijdreeks 1 - Sta...] [2011-08-03 15:23:48] [3f8170910ab21fde7eba151af40022ac] [Current]
Feedback Forum

Post a new message
Dataseries X:
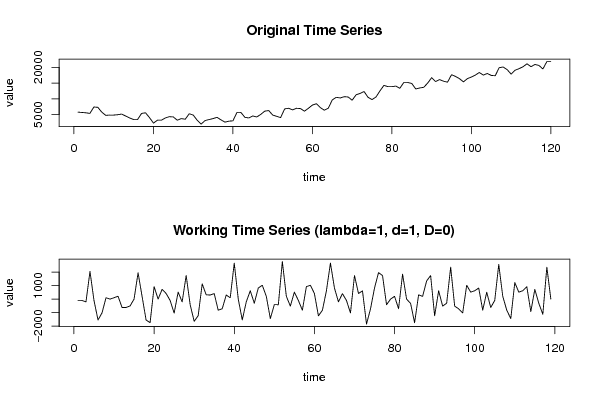
5740
5639
5538
5336
7380
7279
5740
4718
4819
4819
4920
5133
4516
3898
3392
3392
5336
5538
3999
2258
3179
3179
3898
4313
4212
3179
3696
3493
5234
4819
3179
1954
3078
3392
3696
4100
3280
2572
2876
2977
5639
5639
4100
3898
4516
4212
5032
6054
6257
4819
4414
3999
6773
6976
6459
6976
6874
6054
6976
7998
8413
7178
6358
6976
9638
10458
10256
10660
10559
9537
11278
11693
12300
10458
9739
10559
12513
14254
13839
13839
14042
13333
15176
15176
14862
13120
13434
13637
14973
16714
15479
16097
15580
15277
17636
17119
16400
15378
16400
16917
17534
18354
17534
18040
17423
17322
19883
20096
19276
17838
19063
19579
20197
21118
20197
20916
20602
19478
21837
21837


Summary of computational transaction
Raw Inputview raw input (R code)
Raw Outputview raw output of R engine
Computing time1 seconds
R Server'AstonUniversity' @ aston.wessa.net

\begin{tabular}{lllllllll}
\hline
Summary of computational transaction \tabularnewline
Raw Input & view raw input (R code)  \tabularnewline
Raw Output & view raw output of R engine  \tabularnewline
Computing time & 1 seconds \tabularnewline
R Server & 'AstonUniversity' @ aston.wessa.net \tabularnewline
\hline
\end{tabular}
%Source: https://freestatistics.org/blog/index.php?pk=123362&T=0

[TABLE]
[ROW][C]Summary of computational transaction[/C][/ROW]
[ROW][C]Raw Input[/C][C]view raw input (R code) [/C][/ROW]
[ROW][C]Raw Output[/C][C]view raw output of R engine [/C][/ROW]
[ROW][C]Computing time[/C][C]1 seconds[/C][/ROW]
[ROW][C]R Server[/C][C]'AstonUniversity' @ aston.wessa.net[/C][/ROW]
[/TABLE]
Source: https://freestatistics.org/blog/index.php?pk=123362&T=0

Globally Unique Identifier (entire table): ba.freestatistics.org/blog/index.php?pk=123362&T=0

As an alternative you can also use a QR Code:  

The GUIDs for individual cells are displayed in the table below:

Summary of computational transaction
Raw Inputview raw input (R code)
Raw Outputview raw output of R engine
Computing time1 seconds
R Server'AstonUniversity' @ aston.wessa.net


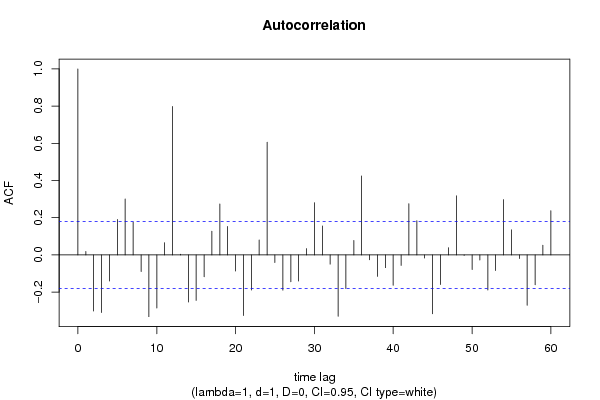
Autocorrelation Function
Time lag kACF(k)T-STATP-value
10.0188230.20530.418832
2-0.301957-3.2940.000651
3-0.309559-3.37690.000496
4-0.140983-1.53790.063359
50.1908322.08170.019755
60.3009093.28250.000675
70.1758911.91870.028706
8-0.089049-0.97140.166657
9-0.332204-3.62390.000214
10-0.286089-3.12090.001132
110.0652160.71140.239109
120.7980368.70550
130.0036890.04020.483985
14-0.253096-2.76090.003339
15-0.24486-2.67110.004309
16-0.117941-1.28660.100367
170.1277631.39370.082998
180.2737472.98620.001715
190.1524611.66320.049457
20-0.087038-0.94950.172151
21-0.325788-3.55390.000273
22-0.188679-2.05820.020875
230.0798560.87110.192719
240.6055976.60630
25-0.041293-0.45040.326603
26-0.18975-2.06990.020311
27-0.144887-1.58050.05832
28-0.140567-1.53340.063916
290.0336780.36740.356992
300.280723.06230.001358
310.1555071.69640.046214
32-0.050013-0.54560.293188
33-0.3301-3.6010.000232
34-0.180604-1.97020.025572
350.0772840.84310.200442
360.4243894.62955e-06
37-0.026103-0.28470.388167
38-0.115719-1.26230.104646
39-0.068794-0.75040.227233
40-0.163469-1.78320.038549
41-0.056717-0.61870.268643
420.2749752.99960.001646
430.183472.00140.023811
44-0.016879-0.18410.427112
45-0.316529-3.45290.000384
46-0.159939-1.74470.041807
470.0381620.41630.338971
480.3176473.46510.000369
49-0.002898-0.03160.487416
50-0.078819-0.85980.195811
51-0.027934-0.30470.380553
52-0.189155-2.06340.020623
53-0.084046-0.91680.180541
540.297223.24230.000769
550.13461.46830.072329
56-0.019502-0.21270.415947
57-0.270629-2.95220.001901
58-0.160574-1.75170.041205
590.052450.57220.284146
600.2375342.59120.00538

\begin{tabular}{lllllllll}
\hline
Autocorrelation Function \tabularnewline
Time lag k & ACF(k) & T-STAT & P-value \tabularnewline
1 & 0.018823 & 0.2053 & 0.418832 \tabularnewline
2 & -0.301957 & -3.294 & 0.000651 \tabularnewline
3 & -0.309559 & -3.3769 & 0.000496 \tabularnewline
4 & -0.140983 & -1.5379 & 0.063359 \tabularnewline
5 & 0.190832 & 2.0817 & 0.019755 \tabularnewline
6 & 0.300909 & 3.2825 & 0.000675 \tabularnewline
7 & 0.175891 & 1.9187 & 0.028706 \tabularnewline
8 & -0.089049 & -0.9714 & 0.166657 \tabularnewline
9 & -0.332204 & -3.6239 & 0.000214 \tabularnewline
10 & -0.286089 & -3.1209 & 0.001132 \tabularnewline
11 & 0.065216 & 0.7114 & 0.239109 \tabularnewline
12 & 0.798036 & 8.7055 & 0 \tabularnewline
13 & 0.003689 & 0.0402 & 0.483985 \tabularnewline
14 & -0.253096 & -2.7609 & 0.003339 \tabularnewline
15 & -0.24486 & -2.6711 & 0.004309 \tabularnewline
16 & -0.117941 & -1.2866 & 0.100367 \tabularnewline
17 & 0.127763 & 1.3937 & 0.082998 \tabularnewline
18 & 0.273747 & 2.9862 & 0.001715 \tabularnewline
19 & 0.152461 & 1.6632 & 0.049457 \tabularnewline
20 & -0.087038 & -0.9495 & 0.172151 \tabularnewline
21 & -0.325788 & -3.5539 & 0.000273 \tabularnewline
22 & -0.188679 & -2.0582 & 0.020875 \tabularnewline
23 & 0.079856 & 0.8711 & 0.192719 \tabularnewline
24 & 0.605597 & 6.6063 & 0 \tabularnewline
25 & -0.041293 & -0.4504 & 0.326603 \tabularnewline
26 & -0.18975 & -2.0699 & 0.020311 \tabularnewline
27 & -0.144887 & -1.5805 & 0.05832 \tabularnewline
28 & -0.140567 & -1.5334 & 0.063916 \tabularnewline
29 & 0.033678 & 0.3674 & 0.356992 \tabularnewline
30 & 0.28072 & 3.0623 & 0.001358 \tabularnewline
31 & 0.155507 & 1.6964 & 0.046214 \tabularnewline
32 & -0.050013 & -0.5456 & 0.293188 \tabularnewline
33 & -0.3301 & -3.601 & 0.000232 \tabularnewline
34 & -0.180604 & -1.9702 & 0.025572 \tabularnewline
35 & 0.077284 & 0.8431 & 0.200442 \tabularnewline
36 & 0.424389 & 4.6295 & 5e-06 \tabularnewline
37 & -0.026103 & -0.2847 & 0.388167 \tabularnewline
38 & -0.115719 & -1.2623 & 0.104646 \tabularnewline
39 & -0.068794 & -0.7504 & 0.227233 \tabularnewline
40 & -0.163469 & -1.7832 & 0.038549 \tabularnewline
41 & -0.056717 & -0.6187 & 0.268643 \tabularnewline
42 & 0.274975 & 2.9996 & 0.001646 \tabularnewline
43 & 0.18347 & 2.0014 & 0.023811 \tabularnewline
44 & -0.016879 & -0.1841 & 0.427112 \tabularnewline
45 & -0.316529 & -3.4529 & 0.000384 \tabularnewline
46 & -0.159939 & -1.7447 & 0.041807 \tabularnewline
47 & 0.038162 & 0.4163 & 0.338971 \tabularnewline
48 & 0.317647 & 3.4651 & 0.000369 \tabularnewline
49 & -0.002898 & -0.0316 & 0.487416 \tabularnewline
50 & -0.078819 & -0.8598 & 0.195811 \tabularnewline
51 & -0.027934 & -0.3047 & 0.380553 \tabularnewline
52 & -0.189155 & -2.0634 & 0.020623 \tabularnewline
53 & -0.084046 & -0.9168 & 0.180541 \tabularnewline
54 & 0.29722 & 3.2423 & 0.000769 \tabularnewline
55 & 0.1346 & 1.4683 & 0.072329 \tabularnewline
56 & -0.019502 & -0.2127 & 0.415947 \tabularnewline
57 & -0.270629 & -2.9522 & 0.001901 \tabularnewline
58 & -0.160574 & -1.7517 & 0.041205 \tabularnewline
59 & 0.05245 & 0.5722 & 0.284146 \tabularnewline
60 & 0.237534 & 2.5912 & 0.00538 \tabularnewline
\hline
\end{tabular}
%Source: https://freestatistics.org/blog/index.php?pk=123362&T=1

[TABLE]
[ROW][C]Autocorrelation Function[/C][/ROW]
[ROW][C]Time lag k[/C][C]ACF(k)[/C][C]T-STAT[/C][C]P-value[/C][/ROW]
[ROW][C]1[/C][C]0.018823[/C][C]0.2053[/C][C]0.418832[/C][/ROW]
[ROW][C]2[/C][C]-0.301957[/C][C]-3.294[/C][C]0.000651[/C][/ROW]
[ROW][C]3[/C][C]-0.309559[/C][C]-3.3769[/C][C]0.000496[/C][/ROW]
[ROW][C]4[/C][C]-0.140983[/C][C]-1.5379[/C][C]0.063359[/C][/ROW]
[ROW][C]5[/C][C]0.190832[/C][C]2.0817[/C][C]0.019755[/C][/ROW]
[ROW][C]6[/C][C]0.300909[/C][C]3.2825[/C][C]0.000675[/C][/ROW]
[ROW][C]7[/C][C]0.175891[/C][C]1.9187[/C][C]0.028706[/C][/ROW]
[ROW][C]8[/C][C]-0.089049[/C][C]-0.9714[/C][C]0.166657[/C][/ROW]
[ROW][C]9[/C][C]-0.332204[/C][C]-3.6239[/C][C]0.000214[/C][/ROW]
[ROW][C]10[/C][C]-0.286089[/C][C]-3.1209[/C][C]0.001132[/C][/ROW]
[ROW][C]11[/C][C]0.065216[/C][C]0.7114[/C][C]0.239109[/C][/ROW]
[ROW][C]12[/C][C]0.798036[/C][C]8.7055[/C][C]0[/C][/ROW]
[ROW][C]13[/C][C]0.003689[/C][C]0.0402[/C][C]0.483985[/C][/ROW]
[ROW][C]14[/C][C]-0.253096[/C][C]-2.7609[/C][C]0.003339[/C][/ROW]
[ROW][C]15[/C][C]-0.24486[/C][C]-2.6711[/C][C]0.004309[/C][/ROW]
[ROW][C]16[/C][C]-0.117941[/C][C]-1.2866[/C][C]0.100367[/C][/ROW]
[ROW][C]17[/C][C]0.127763[/C][C]1.3937[/C][C]0.082998[/C][/ROW]
[ROW][C]18[/C][C]0.273747[/C][C]2.9862[/C][C]0.001715[/C][/ROW]
[ROW][C]19[/C][C]0.152461[/C][C]1.6632[/C][C]0.049457[/C][/ROW]
[ROW][C]20[/C][C]-0.087038[/C][C]-0.9495[/C][C]0.172151[/C][/ROW]
[ROW][C]21[/C][C]-0.325788[/C][C]-3.5539[/C][C]0.000273[/C][/ROW]
[ROW][C]22[/C][C]-0.188679[/C][C]-2.0582[/C][C]0.020875[/C][/ROW]
[ROW][C]23[/C][C]0.079856[/C][C]0.8711[/C][C]0.192719[/C][/ROW]
[ROW][C]24[/C][C]0.605597[/C][C]6.6063[/C][C]0[/C][/ROW]
[ROW][C]25[/C][C]-0.041293[/C][C]-0.4504[/C][C]0.326603[/C][/ROW]
[ROW][C]26[/C][C]-0.18975[/C][C]-2.0699[/C][C]0.020311[/C][/ROW]
[ROW][C]27[/C][C]-0.144887[/C][C]-1.5805[/C][C]0.05832[/C][/ROW]
[ROW][C]28[/C][C]-0.140567[/C][C]-1.5334[/C][C]0.063916[/C][/ROW]
[ROW][C]29[/C][C]0.033678[/C][C]0.3674[/C][C]0.356992[/C][/ROW]
[ROW][C]30[/C][C]0.28072[/C][C]3.0623[/C][C]0.001358[/C][/ROW]
[ROW][C]31[/C][C]0.155507[/C][C]1.6964[/C][C]0.046214[/C][/ROW]
[ROW][C]32[/C][C]-0.050013[/C][C]-0.5456[/C][C]0.293188[/C][/ROW]
[ROW][C]33[/C][C]-0.3301[/C][C]-3.601[/C][C]0.000232[/C][/ROW]
[ROW][C]34[/C][C]-0.180604[/C][C]-1.9702[/C][C]0.025572[/C][/ROW]
[ROW][C]35[/C][C]0.077284[/C][C]0.8431[/C][C]0.200442[/C][/ROW]
[ROW][C]36[/C][C]0.424389[/C][C]4.6295[/C][C]5e-06[/C][/ROW]
[ROW][C]37[/C][C]-0.026103[/C][C]-0.2847[/C][C]0.388167[/C][/ROW]
[ROW][C]38[/C][C]-0.115719[/C][C]-1.2623[/C][C]0.104646[/C][/ROW]
[ROW][C]39[/C][C]-0.068794[/C][C]-0.7504[/C][C]0.227233[/C][/ROW]
[ROW][C]40[/C][C]-0.163469[/C][C]-1.7832[/C][C]0.038549[/C][/ROW]
[ROW][C]41[/C][C]-0.056717[/C][C]-0.6187[/C][C]0.268643[/C][/ROW]
[ROW][C]42[/C][C]0.274975[/C][C]2.9996[/C][C]0.001646[/C][/ROW]
[ROW][C]43[/C][C]0.18347[/C][C]2.0014[/C][C]0.023811[/C][/ROW]
[ROW][C]44[/C][C]-0.016879[/C][C]-0.1841[/C][C]0.427112[/C][/ROW]
[ROW][C]45[/C][C]-0.316529[/C][C]-3.4529[/C][C]0.000384[/C][/ROW]
[ROW][C]46[/C][C]-0.159939[/C][C]-1.7447[/C][C]0.041807[/C][/ROW]
[ROW][C]47[/C][C]0.038162[/C][C]0.4163[/C][C]0.338971[/C][/ROW]
[ROW][C]48[/C][C]0.317647[/C][C]3.4651[/C][C]0.000369[/C][/ROW]
[ROW][C]49[/C][C]-0.002898[/C][C]-0.0316[/C][C]0.487416[/C][/ROW]
[ROW][C]50[/C][C]-0.078819[/C][C]-0.8598[/C][C]0.195811[/C][/ROW]
[ROW][C]51[/C][C]-0.027934[/C][C]-0.3047[/C][C]0.380553[/C][/ROW]
[ROW][C]52[/C][C]-0.189155[/C][C]-2.0634[/C][C]0.020623[/C][/ROW]
[ROW][C]53[/C][C]-0.084046[/C][C]-0.9168[/C][C]0.180541[/C][/ROW]
[ROW][C]54[/C][C]0.29722[/C][C]3.2423[/C][C]0.000769[/C][/ROW]
[ROW][C]55[/C][C]0.1346[/C][C]1.4683[/C][C]0.072329[/C][/ROW]
[ROW][C]56[/C][C]-0.019502[/C][C]-0.2127[/C][C]0.415947[/C][/ROW]
[ROW][C]57[/C][C]-0.270629[/C][C]-2.9522[/C][C]0.001901[/C][/ROW]
[ROW][C]58[/C][C]-0.160574[/C][C]-1.7517[/C][C]0.041205[/C][/ROW]
[ROW][C]59[/C][C]0.05245[/C][C]0.5722[/C][C]0.284146[/C][/ROW]
[ROW][C]60[/C][C]0.237534[/C][C]2.5912[/C][C]0.00538[/C][/ROW]
[/TABLE]
Source: https://freestatistics.org/blog/index.php?pk=123362&T=1

Globally Unique Identifier (entire table): ba.freestatistics.org/blog/index.php?pk=123362&T=1

As an alternative you can also use a QR Code:  

The GUIDs for individual cells are displayed in the table below:

Autocorrelation Function
Time lag kACF(k)T-STATP-value
10.0188230.20530.418832
2-0.301957-3.2940.000651
3-0.309559-3.37690.000496
4-0.140983-1.53790.063359
50.1908322.08170.019755
60.3009093.28250.000675
70.1758911.91870.028706
8-0.089049-0.97140.166657
9-0.332204-3.62390.000214
10-0.286089-3.12090.001132
110.0652160.71140.239109
120.7980368.70550
130.0036890.04020.483985
14-0.253096-2.76090.003339
15-0.24486-2.67110.004309
16-0.117941-1.28660.100367
170.1277631.39370.082998
180.2737472.98620.001715
190.1524611.66320.049457
20-0.087038-0.94950.172151
21-0.325788-3.55390.000273
22-0.188679-2.05820.020875
230.0798560.87110.192719
240.6055976.60630
25-0.041293-0.45040.326603
26-0.18975-2.06990.020311
27-0.144887-1.58050.05832
28-0.140567-1.53340.063916
290.0336780.36740.356992
300.280723.06230.001358
310.1555071.69640.046214
32-0.050013-0.54560.293188
33-0.3301-3.6010.000232
34-0.180604-1.97020.025572
350.0772840.84310.200442
360.4243894.62955e-06
37-0.026103-0.28470.388167
38-0.115719-1.26230.104646
39-0.068794-0.75040.227233
40-0.163469-1.78320.038549
41-0.056717-0.61870.268643
420.2749752.99960.001646
430.183472.00140.023811
44-0.016879-0.18410.427112
45-0.316529-3.45290.000384
46-0.159939-1.74470.041807
470.0381620.41630.338971
480.3176473.46510.000369
49-0.002898-0.03160.487416
50-0.078819-0.85980.195811
51-0.027934-0.30470.380553
52-0.189155-2.06340.020623
53-0.084046-0.91680.180541
540.297223.24230.000769
550.13461.46830.072329
56-0.019502-0.21270.415947
57-0.270629-2.95220.001901
58-0.160574-1.75170.041205
590.052450.57220.284146
600.2375342.59120.00538


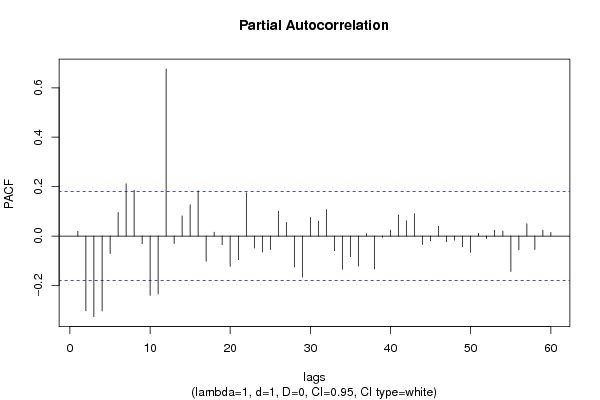
Partial Autocorrelation Function
Time lag kPACF(k)T-STATP-value
10.0188230.20530.418832
2-0.302418-3.2990.00064
3-0.326422-3.56080.000266
4-0.304035-3.31660.000604
5-0.070778-0.77210.220794
60.0953711.04040.150139
70.2112282.30420.011472
80.1850612.01880.022879
9-0.031142-0.33970.367333
10-0.240331-2.62170.004946
11-0.23516-2.56530.005776
120.6762187.37670
13-0.030333-0.33090.370651
140.0813950.88790.18819
150.1266271.38130.084882
160.1828371.99450.024191
17-0.102572-1.11890.132711
180.0151970.16580.434306
19-0.035657-0.3890.348997
20-0.12283-1.33990.091412
21-0.095895-1.04610.148819
220.1754351.91380.029026
23-0.048517-0.52930.298806
24-0.064572-0.70440.241282
25-0.054782-0.59760.275622
260.100361.09480.137909
270.0547610.59740.275696
28-0.125413-1.36810.08693
29-0.166663-1.81810.035784
300.0748250.81620.207995
310.0599210.65370.257296
320.1062011.15850.124487
33-0.059266-0.64650.259594
34-0.134836-1.47090.071981
35-0.08275-0.90270.184257
36-0.121368-1.3240.094026
370.009590.10460.458431
38-0.133504-1.45640.073964
39-0.005241-0.05720.477251
400.0240030.26180.396947
410.0854890.93260.176463
420.0616010.6720.251445
430.0905060.98730.162747
44-0.034855-0.38020.352229
45-0.019565-0.21340.415679
460.0391870.42750.334902
47-0.023402-0.25530.399473
48-0.016662-0.18180.428041
49-0.043157-0.47080.319327
50-0.065705-0.71680.237464
510.0116090.12660.44972
52-0.009823-0.10720.457422
530.0237880.25950.397851
540.0202040.22040.41297
55-0.143416-1.56450.06018
56-0.05559-0.60640.272698
570.0495560.54060.294898
58-0.054624-0.59590.276195
590.0232150.25320.400256
600.0143990.15710.437724

\begin{tabular}{lllllllll}
\hline
Partial Autocorrelation Function \tabularnewline
Time lag k & PACF(k) & T-STAT & P-value \tabularnewline
1 & 0.018823 & 0.2053 & 0.418832 \tabularnewline
2 & -0.302418 & -3.299 & 0.00064 \tabularnewline
3 & -0.326422 & -3.5608 & 0.000266 \tabularnewline
4 & -0.304035 & -3.3166 & 0.000604 \tabularnewline
5 & -0.070778 & -0.7721 & 0.220794 \tabularnewline
6 & 0.095371 & 1.0404 & 0.150139 \tabularnewline
7 & 0.211228 & 2.3042 & 0.011472 \tabularnewline
8 & 0.185061 & 2.0188 & 0.022879 \tabularnewline
9 & -0.031142 & -0.3397 & 0.367333 \tabularnewline
10 & -0.240331 & -2.6217 & 0.004946 \tabularnewline
11 & -0.23516 & -2.5653 & 0.005776 \tabularnewline
12 & 0.676218 & 7.3767 & 0 \tabularnewline
13 & -0.030333 & -0.3309 & 0.370651 \tabularnewline
14 & 0.081395 & 0.8879 & 0.18819 \tabularnewline
15 & 0.126627 & 1.3813 & 0.084882 \tabularnewline
16 & 0.182837 & 1.9945 & 0.024191 \tabularnewline
17 & -0.102572 & -1.1189 & 0.132711 \tabularnewline
18 & 0.015197 & 0.1658 & 0.434306 \tabularnewline
19 & -0.035657 & -0.389 & 0.348997 \tabularnewline
20 & -0.12283 & -1.3399 & 0.091412 \tabularnewline
21 & -0.095895 & -1.0461 & 0.148819 \tabularnewline
22 & 0.175435 & 1.9138 & 0.029026 \tabularnewline
23 & -0.048517 & -0.5293 & 0.298806 \tabularnewline
24 & -0.064572 & -0.7044 & 0.241282 \tabularnewline
25 & -0.054782 & -0.5976 & 0.275622 \tabularnewline
26 & 0.10036 & 1.0948 & 0.137909 \tabularnewline
27 & 0.054761 & 0.5974 & 0.275696 \tabularnewline
28 & -0.125413 & -1.3681 & 0.08693 \tabularnewline
29 & -0.166663 & -1.8181 & 0.035784 \tabularnewline
30 & 0.074825 & 0.8162 & 0.207995 \tabularnewline
31 & 0.059921 & 0.6537 & 0.257296 \tabularnewline
32 & 0.106201 & 1.1585 & 0.124487 \tabularnewline
33 & -0.059266 & -0.6465 & 0.259594 \tabularnewline
34 & -0.134836 & -1.4709 & 0.071981 \tabularnewline
35 & -0.08275 & -0.9027 & 0.184257 \tabularnewline
36 & -0.121368 & -1.324 & 0.094026 \tabularnewline
37 & 0.00959 & 0.1046 & 0.458431 \tabularnewline
38 & -0.133504 & -1.4564 & 0.073964 \tabularnewline
39 & -0.005241 & -0.0572 & 0.477251 \tabularnewline
40 & 0.024003 & 0.2618 & 0.396947 \tabularnewline
41 & 0.085489 & 0.9326 & 0.176463 \tabularnewline
42 & 0.061601 & 0.672 & 0.251445 \tabularnewline
43 & 0.090506 & 0.9873 & 0.162747 \tabularnewline
44 & -0.034855 & -0.3802 & 0.352229 \tabularnewline
45 & -0.019565 & -0.2134 & 0.415679 \tabularnewline
46 & 0.039187 & 0.4275 & 0.334902 \tabularnewline
47 & -0.023402 & -0.2553 & 0.399473 \tabularnewline
48 & -0.016662 & -0.1818 & 0.428041 \tabularnewline
49 & -0.043157 & -0.4708 & 0.319327 \tabularnewline
50 & -0.065705 & -0.7168 & 0.237464 \tabularnewline
51 & 0.011609 & 0.1266 & 0.44972 \tabularnewline
52 & -0.009823 & -0.1072 & 0.457422 \tabularnewline
53 & 0.023788 & 0.2595 & 0.397851 \tabularnewline
54 & 0.020204 & 0.2204 & 0.41297 \tabularnewline
55 & -0.143416 & -1.5645 & 0.06018 \tabularnewline
56 & -0.05559 & -0.6064 & 0.272698 \tabularnewline
57 & 0.049556 & 0.5406 & 0.294898 \tabularnewline
58 & -0.054624 & -0.5959 & 0.276195 \tabularnewline
59 & 0.023215 & 0.2532 & 0.400256 \tabularnewline
60 & 0.014399 & 0.1571 & 0.437724 \tabularnewline
\hline
\end{tabular}
%Source: https://freestatistics.org/blog/index.php?pk=123362&T=2

[TABLE]
[ROW][C]Partial Autocorrelation Function[/C][/ROW]
[ROW][C]Time lag k[/C][C]PACF(k)[/C][C]T-STAT[/C][C]P-value[/C][/ROW]
[ROW][C]1[/C][C]0.018823[/C][C]0.2053[/C][C]0.418832[/C][/ROW]
[ROW][C]2[/C][C]-0.302418[/C][C]-3.299[/C][C]0.00064[/C][/ROW]
[ROW][C]3[/C][C]-0.326422[/C][C]-3.5608[/C][C]0.000266[/C][/ROW]
[ROW][C]4[/C][C]-0.304035[/C][C]-3.3166[/C][C]0.000604[/C][/ROW]
[ROW][C]5[/C][C]-0.070778[/C][C]-0.7721[/C][C]0.220794[/C][/ROW]
[ROW][C]6[/C][C]0.095371[/C][C]1.0404[/C][C]0.150139[/C][/ROW]
[ROW][C]7[/C][C]0.211228[/C][C]2.3042[/C][C]0.011472[/C][/ROW]
[ROW][C]8[/C][C]0.185061[/C][C]2.0188[/C][C]0.022879[/C][/ROW]
[ROW][C]9[/C][C]-0.031142[/C][C]-0.3397[/C][C]0.367333[/C][/ROW]
[ROW][C]10[/C][C]-0.240331[/C][C]-2.6217[/C][C]0.004946[/C][/ROW]
[ROW][C]11[/C][C]-0.23516[/C][C]-2.5653[/C][C]0.005776[/C][/ROW]
[ROW][C]12[/C][C]0.676218[/C][C]7.3767[/C][C]0[/C][/ROW]
[ROW][C]13[/C][C]-0.030333[/C][C]-0.3309[/C][C]0.370651[/C][/ROW]
[ROW][C]14[/C][C]0.081395[/C][C]0.8879[/C][C]0.18819[/C][/ROW]
[ROW][C]15[/C][C]0.126627[/C][C]1.3813[/C][C]0.084882[/C][/ROW]
[ROW][C]16[/C][C]0.182837[/C][C]1.9945[/C][C]0.024191[/C][/ROW]
[ROW][C]17[/C][C]-0.102572[/C][C]-1.1189[/C][C]0.132711[/C][/ROW]
[ROW][C]18[/C][C]0.015197[/C][C]0.1658[/C][C]0.434306[/C][/ROW]
[ROW][C]19[/C][C]-0.035657[/C][C]-0.389[/C][C]0.348997[/C][/ROW]
[ROW][C]20[/C][C]-0.12283[/C][C]-1.3399[/C][C]0.091412[/C][/ROW]
[ROW][C]21[/C][C]-0.095895[/C][C]-1.0461[/C][C]0.148819[/C][/ROW]
[ROW][C]22[/C][C]0.175435[/C][C]1.9138[/C][C]0.029026[/C][/ROW]
[ROW][C]23[/C][C]-0.048517[/C][C]-0.5293[/C][C]0.298806[/C][/ROW]
[ROW][C]24[/C][C]-0.064572[/C][C]-0.7044[/C][C]0.241282[/C][/ROW]
[ROW][C]25[/C][C]-0.054782[/C][C]-0.5976[/C][C]0.275622[/C][/ROW]
[ROW][C]26[/C][C]0.10036[/C][C]1.0948[/C][C]0.137909[/C][/ROW]
[ROW][C]27[/C][C]0.054761[/C][C]0.5974[/C][C]0.275696[/C][/ROW]
[ROW][C]28[/C][C]-0.125413[/C][C]-1.3681[/C][C]0.08693[/C][/ROW]
[ROW][C]29[/C][C]-0.166663[/C][C]-1.8181[/C][C]0.035784[/C][/ROW]
[ROW][C]30[/C][C]0.074825[/C][C]0.8162[/C][C]0.207995[/C][/ROW]
[ROW][C]31[/C][C]0.059921[/C][C]0.6537[/C][C]0.257296[/C][/ROW]
[ROW][C]32[/C][C]0.106201[/C][C]1.1585[/C][C]0.124487[/C][/ROW]
[ROW][C]33[/C][C]-0.059266[/C][C]-0.6465[/C][C]0.259594[/C][/ROW]
[ROW][C]34[/C][C]-0.134836[/C][C]-1.4709[/C][C]0.071981[/C][/ROW]
[ROW][C]35[/C][C]-0.08275[/C][C]-0.9027[/C][C]0.184257[/C][/ROW]
[ROW][C]36[/C][C]-0.121368[/C][C]-1.324[/C][C]0.094026[/C][/ROW]
[ROW][C]37[/C][C]0.00959[/C][C]0.1046[/C][C]0.458431[/C][/ROW]
[ROW][C]38[/C][C]-0.133504[/C][C]-1.4564[/C][C]0.073964[/C][/ROW]
[ROW][C]39[/C][C]-0.005241[/C][C]-0.0572[/C][C]0.477251[/C][/ROW]
[ROW][C]40[/C][C]0.024003[/C][C]0.2618[/C][C]0.396947[/C][/ROW]
[ROW][C]41[/C][C]0.085489[/C][C]0.9326[/C][C]0.176463[/C][/ROW]
[ROW][C]42[/C][C]0.061601[/C][C]0.672[/C][C]0.251445[/C][/ROW]
[ROW][C]43[/C][C]0.090506[/C][C]0.9873[/C][C]0.162747[/C][/ROW]
[ROW][C]44[/C][C]-0.034855[/C][C]-0.3802[/C][C]0.352229[/C][/ROW]
[ROW][C]45[/C][C]-0.019565[/C][C]-0.2134[/C][C]0.415679[/C][/ROW]
[ROW][C]46[/C][C]0.039187[/C][C]0.4275[/C][C]0.334902[/C][/ROW]
[ROW][C]47[/C][C]-0.023402[/C][C]-0.2553[/C][C]0.399473[/C][/ROW]
[ROW][C]48[/C][C]-0.016662[/C][C]-0.1818[/C][C]0.428041[/C][/ROW]
[ROW][C]49[/C][C]-0.043157[/C][C]-0.4708[/C][C]0.319327[/C][/ROW]
[ROW][C]50[/C][C]-0.065705[/C][C]-0.7168[/C][C]0.237464[/C][/ROW]
[ROW][C]51[/C][C]0.011609[/C][C]0.1266[/C][C]0.44972[/C][/ROW]
[ROW][C]52[/C][C]-0.009823[/C][C]-0.1072[/C][C]0.457422[/C][/ROW]
[ROW][C]53[/C][C]0.023788[/C][C]0.2595[/C][C]0.397851[/C][/ROW]
[ROW][C]54[/C][C]0.020204[/C][C]0.2204[/C][C]0.41297[/C][/ROW]
[ROW][C]55[/C][C]-0.143416[/C][C]-1.5645[/C][C]0.06018[/C][/ROW]
[ROW][C]56[/C][C]-0.05559[/C][C]-0.6064[/C][C]0.272698[/C][/ROW]
[ROW][C]57[/C][C]0.049556[/C][C]0.5406[/C][C]0.294898[/C][/ROW]
[ROW][C]58[/C][C]-0.054624[/C][C]-0.5959[/C][C]0.276195[/C][/ROW]
[ROW][C]59[/C][C]0.023215[/C][C]0.2532[/C][C]0.400256[/C][/ROW]
[ROW][C]60[/C][C]0.014399[/C][C]0.1571[/C][C]0.437724[/C][/ROW]
[/TABLE]
Source: https://freestatistics.org/blog/index.php?pk=123362&T=2

Globally Unique Identifier (entire table): ba.freestatistics.org/blog/index.php?pk=123362&T=2

As an alternative you can also use a QR Code:  

The GUIDs for individual cells are displayed in the table below:

Partial Autocorrelation Function
Time lag kPACF(k)T-STATP-value
10.0188230.20530.418832
2-0.302418-3.2990.00064
3-0.326422-3.56080.000266
4-0.304035-3.31660.000604
5-0.070778-0.77210.220794
60.0953711.04040.150139
70.2112282.30420.011472
80.1850612.01880.022879
9-0.031142-0.33970.367333
10-0.240331-2.62170.004946
11-0.23516-2.56530.005776
120.6762187.37670
13-0.030333-0.33090.370651
140.0813950.88790.18819
150.1266271.38130.084882
160.1828371.99450.024191
17-0.102572-1.11890.132711
180.0151970.16580.434306
19-0.035657-0.3890.348997
20-0.12283-1.33990.091412
21-0.095895-1.04610.148819
220.1754351.91380.029026
23-0.048517-0.52930.298806
24-0.064572-0.70440.241282
25-0.054782-0.59760.275622
260.100361.09480.137909
270.0547610.59740.275696
28-0.125413-1.36810.08693
29-0.166663-1.81810.035784
300.0748250.81620.207995
310.0599210.65370.257296
320.1062011.15850.124487
33-0.059266-0.64650.259594
34-0.134836-1.47090.071981
35-0.08275-0.90270.184257
36-0.121368-1.3240.094026
370.009590.10460.458431
38-0.133504-1.45640.073964
39-0.005241-0.05720.477251
400.0240030.26180.396947
410.0854890.93260.176463
420.0616010.6720.251445
430.0905060.98730.162747
44-0.034855-0.38020.352229
45-0.019565-0.21340.415679
460.0391870.42750.334902
47-0.023402-0.25530.399473
48-0.016662-0.18180.428041
49-0.043157-0.47080.319327
50-0.065705-0.71680.237464
510.0116090.12660.44972
52-0.009823-0.10720.457422
530.0237880.25950.397851
540.0202040.22040.41297
55-0.143416-1.56450.06018
56-0.05559-0.60640.272698
570.0495560.54060.294898
58-0.054624-0.59590.276195
590.0232150.25320.400256
600.0143990.15710.437724


Parameters (Session):
par1 = 60 ; par2 = 1 ; par3 = 1 ; par4 = 0 ; par5 = 12 ; par6 = White Noise ; par7 = 0.95 ;
Parameters (R input):
par1 = 60 ; par2 = 1 ; par3 = 1 ; par4 = 0 ; par5 = 12 ; par6 = White Noise ; par7 = 0.95 ; par8 = ;
R code (references can be found in the software module):
if (par1 == 'Default') {
par1 = 10*log10(length(x))
} else {
par1 <- as.numeric(par1)
}
par2 <- as.numeric(par2)
par3 <- as.numeric(par3)
par4 <- as.numeric(par4)
par5 <- as.numeric(par5)
if (par6 == 'White Noise') par6 <- 'white' else par6 <- 'ma'
par7 <- as.numeric(par7)
if (par8 != '') par8 <- as.numeric(par8)
ox <- x
if (par8 == '') {
if (par2 == 0) {
x <- log(x)
} else {
x <- (x ^ par2 - 1) / par2
}
} else {
x <- log(x,base=par8)
}
if (par3 > 0) x <- diff(x,lag=1,difference=par3)
if (par4 > 0) x <- diff(x,lag=par5,difference=par4)
bitmap(file='picts.png')
op <- par(mfrow=c(2,1))
plot(ox,type='l',main='Original Time Series',xlab='time',ylab='value')
if (par8=='') {
mytitle <- paste('Working Time Series (lambda=',par2,', d=',par3,', D=',par4,')',sep='')
mysub <- paste('(lambda=',par2,', d=',par3,', D=',par4,', CI=', par7, ', CI type=',par6,')',sep='')
} else {
mytitle <- paste('Working Time Series (base=',par8,', d=',par3,', D=',par4,')',sep='')
mysub <- paste('(base=',par8,', d=',par3,', D=',par4,', CI=', par7, ', CI type=',par6,')',sep='')
}
plot(x,type='l', main=mytitle,xlab='time',ylab='value')
par(op)
dev.off()
bitmap(file='pic1.png')
racf <- acf(x, par1, main='Autocorrelation', xlab='time lag', ylab='ACF', ci.type=par6, ci=par7, sub=mysub)
dev.off()
bitmap(file='pic2.png')
rpacf <- pacf(x,par1,main='Partial Autocorrelation',xlab='lags',ylab='PACF',sub=mysub)
dev.off()
(myacf <- c(racf$acf))
(mypacf <- c(rpacf$acf))
lengthx <- length(x)
sqrtn <- sqrt(lengthx)
load(file='createtable')
a<-table.start()
a<-table.row.start(a)
a<-table.element(a,'Autocorrelation Function',4,TRUE)
a<-table.row.end(a)
a<-table.row.start(a)
a<-table.element(a,'Time lag k',header=TRUE)
a<-table.element(a,hyperlink('basics.htm','ACF(k)','click here for more information about the Autocorrelation Function'),header=TRUE)
a<-table.element(a,'T-STAT',header=TRUE)
a<-table.element(a,'P-value',header=TRUE)
a<-table.row.end(a)
for (i in 2:(par1+1)) {
a<-table.row.start(a)
a<-table.element(a,i-1,header=TRUE)
a<-table.element(a,round(myacf[i],6))
mytstat <- myacf[i]*sqrtn
a<-table.element(a,round(mytstat,4))
a<-table.element(a,round(1-pt(abs(mytstat),lengthx),6))
a<-table.row.end(a)
}
a<-table.end(a)
table.save(a,file='mytable.tab')
a<-table.start()
a<-table.row.start(a)
a<-table.element(a,'Partial Autocorrelation Function',4,TRUE)
a<-table.row.end(a)
a<-table.row.start(a)
a<-table.element(a,'Time lag k',header=TRUE)
a<-table.element(a,hyperlink('basics.htm','PACF(k)','click here for more information about the Partial Autocorrelation Function'),header=TRUE)
a<-table.element(a,'T-STAT',header=TRUE)
a<-table.element(a,'P-value',header=TRUE)
a<-table.row.end(a)
for (i in 1:par1) {
a<-table.row.start(a)
a<-table.element(a,i,header=TRUE)
a<-table.element(a,round(mypacf[i],6))
mytstat <- mypacf[i]*sqrtn
a<-table.element(a,round(mytstat,4))
a<-table.element(a,round(1-pt(abs(mytstat),lengthx),6))
a<-table.row.end(a)
}
a<-table.end(a)
table.save(a,file='mytable1.tab')