Free Statistics

of Irreproducible Research!

Author's title

Author*Unverified author*
R Software Modulerwasp_smp.wasp
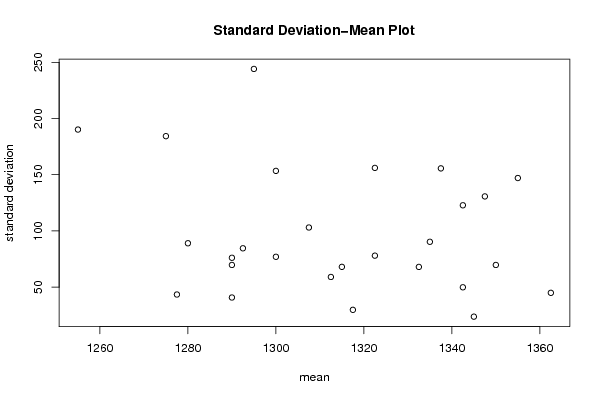
Title produced by softwareStandard Deviation-Mean Plot
Date of computationWed, 03 Aug 2011 10:56:54 -0400
Cite this page as followsStatistical Computations at FreeStatistics.org, Office for Research Development and Education, URL https://freestatistics.org/blog/index.php?v=date/2011/Aug/03/t1312384762f9kfw2jf7ohg34a.htm/, Retrieved Tue, 14 May 2024 04:30:58 +0000
Statistical Computations at FreeStatistics.org, Office for Research Development and Education, URL https://freestatistics.org/blog/index.php?pk=123360, Retrieved Tue, 14 May 2024 04:30:58 +0000
QR Codes:

Original text written by user:
IsPrivate?No (this computation is public)
User-defined keywordsVan Laer Axel
Estimated Impact130
Family? (F = Feedback message, R = changed R code, M = changed R Module, P = changed Parameters, D = changed Data)
-       [Standard Deviation-Mean Plot] [Cijferreeks B, St...] [2011-08-03 14:56:54] [3bbb4c38423daa916cf90d93c467bd86] [Current]
Feedback Forum

Post a new message
Dataseries X:
1220
1250
1350
1380
1310
1350
1360
1230
1330
1330
1380
1340
1220
1230
1400
1320
1320
1380
1340
1220
1310
1280
1330
1350
1240
1260
1340
1270
1330
1440
1350
1220
1310
1350
1300
1410
1260
1210
1410
1240
1360
1420
1310
1360
1260
1410
1330
1400
1240
1280
1460
1250
1340
1440
1170
1420
1250
1390
1260
1390
1290
1310
1540
1250
1320
1430
1080
1370
1290
1380
1260
1400
1250
1290
1550
1200
1320
1500
1060
1220
1260
1270
1280
1350
1320
1350
1530
1150
1270
1460
1000
1290
1330
1180
1350
1300
1350
1350
1540
1180
1280
1520
960
1420
1370
1210
1320
1260


Summary of computational transaction
Raw Inputview raw input (R code)
Raw Outputview raw output of R engine
Computing time0 seconds
R Server'Gertrude Mary Cox' @ cox.wessa.net

\begin{tabular}{lllllllll}
\hline
Summary of computational transaction \tabularnewline
Raw Input & view raw input (R code)  \tabularnewline
Raw Output & view raw output of R engine  \tabularnewline
Computing time & 0 seconds \tabularnewline
R Server & 'Gertrude Mary Cox' @ cox.wessa.net \tabularnewline
\hline
\end{tabular}
%Source: https://freestatistics.org/blog/index.php?pk=123360&T=0

[TABLE]
[ROW][C]Summary of computational transaction[/C][/ROW]
[ROW][C]Raw Input[/C][C]view raw input (R code) [/C][/ROW]
[ROW][C]Raw Output[/C][C]view raw output of R engine [/C][/ROW]
[ROW][C]Computing time[/C][C]0 seconds[/C][/ROW]
[ROW][C]R Server[/C][C]'Gertrude Mary Cox' @ cox.wessa.net[/C][/ROW]
[/TABLE]
Source: https://freestatistics.org/blog/index.php?pk=123360&T=0

Globally Unique Identifier (entire table): ba.freestatistics.org/blog/index.php?pk=123360&T=0

As an alternative you can also use a QR Code:  

The GUIDs for individual cells are displayed in the table below:

Summary of computational transaction
Raw Inputview raw input (R code)
Raw Outputview raw output of R engine
Computing time0 seconds
R Server'Gertrude Mary Cox' @ cox.wessa.net


Standard Deviation-Mean Plot
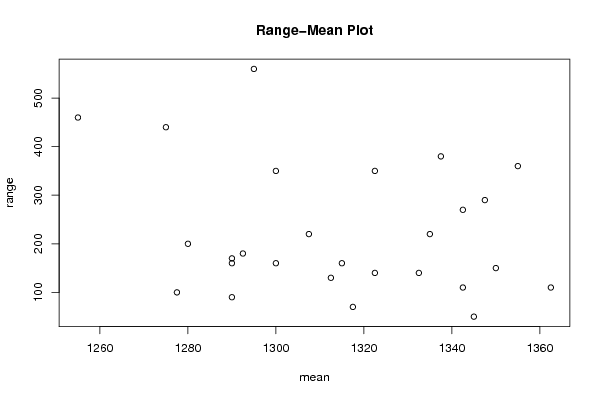
SectionMeanStandard DeviationRange
1130077.0281333886089160
21312.559.0903263374528130
3134523.804761428476250
41292.584.6069343099804180
5131568.0685928555405160
61317.529.860788111948270
71277.543.493294502333100
8133590.3696114115064220
91342.549.9165971062398110
10128089.0692614392492200
111362.545110
12135069.7614984548545150
131307.5103.077640640442220
141342.5122.848144742469270
151322.578.049129826454140
161347.5130.735101126923290
171300153.405779986718350
181332.568.0073525436772140
191322.5156.07156478146350
201275184.300479290388440
21129040.824829046386390
221337.5155.643824162734380
231255190.175357674612460
24129076.1577310586391170
251355147.082743152735360
261295244.062833439806560
27129069.7614984548545160

\begin{tabular}{lllllllll}
\hline
Standard Deviation-Mean Plot \tabularnewline
Section & Mean & Standard Deviation & Range \tabularnewline
1 & 1300 & 77.0281333886089 & 160 \tabularnewline
2 & 1312.5 & 59.0903263374528 & 130 \tabularnewline
3 & 1345 & 23.8047614284762 & 50 \tabularnewline
4 & 1292.5 & 84.6069343099804 & 180 \tabularnewline
5 & 1315 & 68.0685928555405 & 160 \tabularnewline
6 & 1317.5 & 29.8607881119482 & 70 \tabularnewline
7 & 1277.5 & 43.493294502333 & 100 \tabularnewline
8 & 1335 & 90.3696114115064 & 220 \tabularnewline
9 & 1342.5 & 49.9165971062398 & 110 \tabularnewline
10 & 1280 & 89.0692614392492 & 200 \tabularnewline
11 & 1362.5 & 45 & 110 \tabularnewline
12 & 1350 & 69.7614984548545 & 150 \tabularnewline
13 & 1307.5 & 103.077640640442 & 220 \tabularnewline
14 & 1342.5 & 122.848144742469 & 270 \tabularnewline
15 & 1322.5 & 78.049129826454 & 140 \tabularnewline
16 & 1347.5 & 130.735101126923 & 290 \tabularnewline
17 & 1300 & 153.405779986718 & 350 \tabularnewline
18 & 1332.5 & 68.0073525436772 & 140 \tabularnewline
19 & 1322.5 & 156.07156478146 & 350 \tabularnewline
20 & 1275 & 184.300479290388 & 440 \tabularnewline
21 & 1290 & 40.8248290463863 & 90 \tabularnewline
22 & 1337.5 & 155.643824162734 & 380 \tabularnewline
23 & 1255 & 190.175357674612 & 460 \tabularnewline
24 & 1290 & 76.1577310586391 & 170 \tabularnewline
25 & 1355 & 147.082743152735 & 360 \tabularnewline
26 & 1295 & 244.062833439806 & 560 \tabularnewline
27 & 1290 & 69.7614984548545 & 160 \tabularnewline
\hline
\end{tabular}
%Source: https://freestatistics.org/blog/index.php?pk=123360&T=1

[TABLE]
[ROW][C]Standard Deviation-Mean Plot[/C][/ROW]
[ROW][C]Section[/C][C]Mean[/C][C]Standard Deviation[/C][C]Range[/C][/ROW]
[ROW][C]1[/C][C]1300[/C][C]77.0281333886089[/C][C]160[/C][/ROW]
[ROW][C]2[/C][C]1312.5[/C][C]59.0903263374528[/C][C]130[/C][/ROW]
[ROW][C]3[/C][C]1345[/C][C]23.8047614284762[/C][C]50[/C][/ROW]
[ROW][C]4[/C][C]1292.5[/C][C]84.6069343099804[/C][C]180[/C][/ROW]
[ROW][C]5[/C][C]1315[/C][C]68.0685928555405[/C][C]160[/C][/ROW]
[ROW][C]6[/C][C]1317.5[/C][C]29.8607881119482[/C][C]70[/C][/ROW]
[ROW][C]7[/C][C]1277.5[/C][C]43.493294502333[/C][C]100[/C][/ROW]
[ROW][C]8[/C][C]1335[/C][C]90.3696114115064[/C][C]220[/C][/ROW]
[ROW][C]9[/C][C]1342.5[/C][C]49.9165971062398[/C][C]110[/C][/ROW]
[ROW][C]10[/C][C]1280[/C][C]89.0692614392492[/C][C]200[/C][/ROW]
[ROW][C]11[/C][C]1362.5[/C][C]45[/C][C]110[/C][/ROW]
[ROW][C]12[/C][C]1350[/C][C]69.7614984548545[/C][C]150[/C][/ROW]
[ROW][C]13[/C][C]1307.5[/C][C]103.077640640442[/C][C]220[/C][/ROW]
[ROW][C]14[/C][C]1342.5[/C][C]122.848144742469[/C][C]270[/C][/ROW]
[ROW][C]15[/C][C]1322.5[/C][C]78.049129826454[/C][C]140[/C][/ROW]
[ROW][C]16[/C][C]1347.5[/C][C]130.735101126923[/C][C]290[/C][/ROW]
[ROW][C]17[/C][C]1300[/C][C]153.405779986718[/C][C]350[/C][/ROW]
[ROW][C]18[/C][C]1332.5[/C][C]68.0073525436772[/C][C]140[/C][/ROW]
[ROW][C]19[/C][C]1322.5[/C][C]156.07156478146[/C][C]350[/C][/ROW]
[ROW][C]20[/C][C]1275[/C][C]184.300479290388[/C][C]440[/C][/ROW]
[ROW][C]21[/C][C]1290[/C][C]40.8248290463863[/C][C]90[/C][/ROW]
[ROW][C]22[/C][C]1337.5[/C][C]155.643824162734[/C][C]380[/C][/ROW]
[ROW][C]23[/C][C]1255[/C][C]190.175357674612[/C][C]460[/C][/ROW]
[ROW][C]24[/C][C]1290[/C][C]76.1577310586391[/C][C]170[/C][/ROW]
[ROW][C]25[/C][C]1355[/C][C]147.082743152735[/C][C]360[/C][/ROW]
[ROW][C]26[/C][C]1295[/C][C]244.062833439806[/C][C]560[/C][/ROW]
[ROW][C]27[/C][C]1290[/C][C]69.7614984548545[/C][C]160[/C][/ROW]
[/TABLE]
Source: https://freestatistics.org/blog/index.php?pk=123360&T=1

Globally Unique Identifier (entire table): ba.freestatistics.org/blog/index.php?pk=123360&T=1

As an alternative you can also use a QR Code:  

The GUIDs for individual cells are displayed in the table below:

Standard Deviation-Mean Plot
SectionMeanStandard DeviationRange
1130077.0281333886089160
21312.559.0903263374528130
3134523.804761428476250
41292.584.6069343099804180
5131568.0685928555405160
61317.529.860788111948270
71277.543.493294502333100
8133590.3696114115064220
91342.549.9165971062398110
10128089.0692614392492200
111362.545110
12135069.7614984548545150
131307.5103.077640640442220
141342.5122.848144742469270
151322.578.049129826454140
161347.5130.735101126923290
171300153.405779986718350
181332.568.0073525436772140
191322.5156.07156478146350
201275184.300479290388440
21129040.824829046386390
221337.5155.643824162734380
231255190.175357674612460
24129076.1577310586391170
251355147.082743152735360
261295244.062833439806560
27129069.7614984548545160


Regression: S.E.(k) = alpha + beta * Mean(k)
alpha700.843042582086
beta-0.458476814550731
S.D.0.3774501497981
T-STAT-1.21466851926267
p-value0.235841256761712

\begin{tabular}{lllllllll}
\hline
Regression: S.E.(k) = alpha + beta * Mean(k) \tabularnewline
alpha & 700.843042582086 \tabularnewline
beta & -0.458476814550731 \tabularnewline
S.D. & 0.3774501497981 \tabularnewline
T-STAT & -1.21466851926267 \tabularnewline
p-value & 0.235841256761712 \tabularnewline
\hline
\end{tabular}
%Source: https://freestatistics.org/blog/index.php?pk=123360&T=2

[TABLE]
[ROW][C]Regression: S.E.(k) = alpha + beta * Mean(k)[/C][/ROW]
[ROW][C]alpha[/C][C]700.843042582086[/C][/ROW]
[ROW][C]beta[/C][C]-0.458476814550731[/C][/ROW]
[ROW][C]S.D.[/C][C]0.3774501497981[/C][/ROW]
[ROW][C]T-STAT[/C][C]-1.21466851926267[/C][/ROW]
[ROW][C]p-value[/C][C]0.235841256761712[/C][/ROW]
[/TABLE]
Source: https://freestatistics.org/blog/index.php?pk=123360&T=2

Globally Unique Identifier (entire table): ba.freestatistics.org/blog/index.php?pk=123360&T=2

As an alternative you can also use a QR Code:  

The GUIDs for individual cells are displayed in the table below:

Regression: S.E.(k) = alpha + beta * Mean(k)
alpha700.843042582086
beta-0.458476814550731
S.D.0.3774501497981
T-STAT-1.21466851926267
p-value0.235841256761712


Regression: ln S.E.(k) = alpha + beta * ln Mean(k)
alpha45.3114096009789
beta-5.69281074229026
S.D.5.26039923034655
T-STAT-1.08220127275686
p-value0.289491531551602
Lambda6.69281074229026

\begin{tabular}{lllllllll}
\hline
Regression: ln S.E.(k) = alpha + beta * ln Mean(k) \tabularnewline
alpha & 45.3114096009789 \tabularnewline
beta & -5.69281074229026 \tabularnewline
S.D. & 5.26039923034655 \tabularnewline
T-STAT & -1.08220127275686 \tabularnewline
p-value & 0.289491531551602 \tabularnewline
Lambda & 6.69281074229026 \tabularnewline
\hline
\end{tabular}
%Source: https://freestatistics.org/blog/index.php?pk=123360&T=3

[TABLE]
[ROW][C]Regression: ln S.E.(k) = alpha + beta * ln Mean(k)[/C][/ROW]
[ROW][C]alpha[/C][C]45.3114096009789[/C][/ROW]
[ROW][C]beta[/C][C]-5.69281074229026[/C][/ROW]
[ROW][C]S.D.[/C][C]5.26039923034655[/C][/ROW]
[ROW][C]T-STAT[/C][C]-1.08220127275686[/C][/ROW]
[ROW][C]p-value[/C][C]0.289491531551602[/C][/ROW]
[ROW][C]Lambda[/C][C]6.69281074229026[/C][/ROW]
[/TABLE]
Source: https://freestatistics.org/blog/index.php?pk=123360&T=3

Globally Unique Identifier (entire table): ba.freestatistics.org/blog/index.php?pk=123360&T=3

As an alternative you can also use a QR Code:  

The GUIDs for individual cells are displayed in the table below:

Regression: ln S.E.(k) = alpha + beta * ln Mean(k)
alpha45.3114096009789
beta-5.69281074229026
S.D.5.26039923034655
T-STAT-1.08220127275686
p-value0.289491531551602
Lambda6.69281074229026


Parameters (Session):
Parameters (R input):
par1 = 4 ;
R code (references can be found in the software module):
par1 <- as.numeric(par1)
(n <- length(x))
(np <- floor(n / par1))
arr <- array(NA,dim=c(par1,np))
j <- 0
k <- 1
for (i in 1:(np*par1))
{
j = j + 1
arr[j,k] <- x[i]
if (j == par1) {
j = 0
k=k+1
}
}
arr
arr.mean <- array(NA,dim=np)
arr.sd <- array(NA,dim=np)
arr.range <- array(NA,dim=np)
for (j in 1:np)
{
arr.mean[j] <- mean(arr[,j],na.rm=TRUE)
arr.sd[j] <- sd(arr[,j],na.rm=TRUE)
arr.range[j] <- max(arr[,j],na.rm=TRUE) - min(arr[,j],na.rm=TRUE)
}
arr.mean
arr.sd
arr.range
(lm1 <- lm(arr.sd~arr.mean))
(lnlm1 <- lm(log(arr.sd)~log(arr.mean)))
(lm2 <- lm(arr.range~arr.mean))
bitmap(file='test1.png')
plot(arr.mean,arr.sd,main='Standard Deviation-Mean Plot',xlab='mean',ylab='standard deviation')
dev.off()
bitmap(file='test2.png')
plot(arr.mean,arr.range,main='Range-Mean Plot',xlab='mean',ylab='range')
dev.off()
load(file='createtable')
a<-table.start()
a<-table.row.start(a)
a<-table.element(a,'Standard Deviation-Mean Plot',4,TRUE)
a<-table.row.end(a)
a<-table.row.start(a)
a<-table.element(a,'Section',header=TRUE)
a<-table.element(a,'Mean',header=TRUE)
a<-table.element(a,'Standard Deviation',header=TRUE)
a<-table.element(a,'Range',header=TRUE)
a<-table.row.end(a)
for (j in 1:np) {
a<-table.row.start(a)
a<-table.element(a,j,header=TRUE)
a<-table.element(a,arr.mean[j])
a<-table.element(a,arr.sd[j] )
a<-table.element(a,arr.range[j] )
a<-table.row.end(a)
}
a<-table.end(a)
table.save(a,file='mytable.tab')
a<-table.start()
a<-table.row.start(a)
a<-table.element(a,'Regression: S.E.(k) = alpha + beta * Mean(k)',2,TRUE)
a<-table.row.end(a)
a<-table.row.start(a)
a<-table.element(a,'alpha',header=TRUE)
a<-table.element(a,lm1$coefficients[[1]])
a<-table.row.end(a)
a<-table.row.start(a)
a<-table.element(a,'beta',header=TRUE)
a<-table.element(a,lm1$coefficients[[2]])
a<-table.row.end(a)
a<-table.row.start(a)
a<-table.element(a,'S.D.',header=TRUE)
a<-table.element(a,summary(lm1)$coefficients[2,2])
a<-table.row.end(a)
a<-table.row.start(a)
a<-table.element(a,'T-STAT',header=TRUE)
a<-table.element(a,summary(lm1)$coefficients[2,3])
a<-table.row.end(a)
a<-table.row.start(a)
a<-table.element(a,'p-value',header=TRUE)
a<-table.element(a,summary(lm1)$coefficients[2,4])
a<-table.row.end(a)
a<-table.end(a)
table.save(a,file='mytable1.tab')
a<-table.start()
a<-table.row.start(a)
a<-table.element(a,'Regression: ln S.E.(k) = alpha + beta * ln Mean(k)',2,TRUE)
a<-table.row.end(a)
a<-table.row.start(a)
a<-table.element(a,'alpha',header=TRUE)
a<-table.element(a,lnlm1$coefficients[[1]])
a<-table.row.end(a)
a<-table.row.start(a)
a<-table.element(a,'beta',header=TRUE)
a<-table.element(a,lnlm1$coefficients[[2]])
a<-table.row.end(a)
a<-table.row.start(a)
a<-table.element(a,'S.D.',header=TRUE)
a<-table.element(a,summary(lnlm1)$coefficients[2,2])
a<-table.row.end(a)
a<-table.row.start(a)
a<-table.element(a,'T-STAT',header=TRUE)
a<-table.element(a,summary(lnlm1)$coefficients[2,3])
a<-table.row.end(a)
a<-table.row.start(a)
a<-table.element(a,'p-value',header=TRUE)
a<-table.element(a,summary(lnlm1)$coefficients[2,4])
a<-table.row.end(a)
a<-table.row.start(a)
a<-table.element(a,'Lambda',header=TRUE)
a<-table.element(a,1-lnlm1$coefficients[[2]])
a<-table.row.end(a)
a<-table.end(a)
table.save(a,file='mytable2.tab')