Free Statistics

of Irreproducible Research!

Author's title

Author*Unverified author*
R Software Modulerwasp_smp.wasp
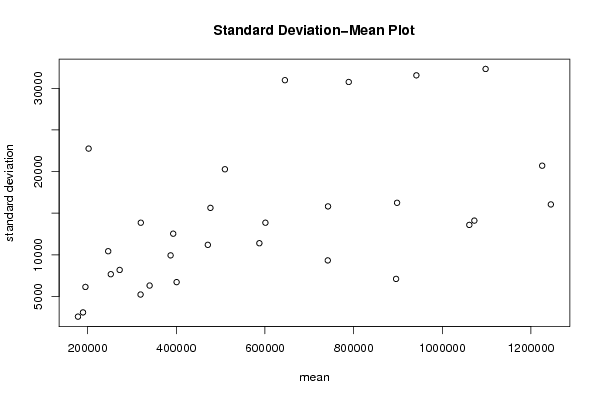
Title produced by softwareStandard Deviation-Mean Plot
Date of computationWed, 03 Aug 2011 10:53:21 -0400
Cite this page as followsStatistical Computations at FreeStatistics.org, Office for Research Development and Education, URL https://freestatistics.org/blog/index.php?v=date/2011/Aug/03/t13123832395juwl50m0to2jyb.htm/, Retrieved Tue, 14 May 2024 14:46:56 +0000
Statistical Computations at FreeStatistics.org, Office for Research Development and Education, URL https://freestatistics.org/blog/index.php?pk=123354, Retrieved Tue, 14 May 2024 14:46:56 +0000
QR Codes:

Original text written by user:
IsPrivate?No (this computation is public)
User-defined keywordsSergeyssels Ivan
Estimated Impact114
Family? (F = Feedback message, R = changed R code, M = changed R Module, P = changed Parameters, D = changed Data)
-       [Standard Deviation-Mean Plot] [Tijdreeks A - Sta...] [2011-08-03 14:53:21] [bc909d11ab9ae813672fa3903785080c] [Current]
Feedback Forum

Post a new message
Dataseries X:
192528
190773
188996
185320
221698
219771
192528
174414
176163
176163
178112
181616
192528
188996
194449
203412
254400
254400
243516
232604
241567
252473
254400
259853
276217
265306
265306
281670
327033
330709
321580
299762
316121
316121
317876
327033
334241
337917
337917
348823
390681
401565
403314
376071
390681
385228
374317
397889
403314
394185
396112
408773
456085
479624
479624
468740
485082
468740
459588
494239
499664
486832
519533
532366
570521
595842
592339
590389
604999
603222
581432
614128
625040
614128
659491
681309
732102
752143
746712
735800
744935
755841
719441
748461
766753
759373
806657
822993
892101
904761
888424
897554
903007
908460
873809
906511
924624
906511
959275
975618
1046468
1057380
1060884
1079170
1079170
1086378
1053676
1070041
1080925
1060884
1119079
1129986
1202597
1215430
1233543
1249908
1251657
1253584
1220883
1253584


Summary of computational transaction
Raw Inputview raw input (R code)
Raw Outputview raw output of R engine
Computing time1 seconds
R Server'Gwilym Jenkins' @ jenkins.wessa.net

\begin{tabular}{lllllllll}
\hline
Summary of computational transaction \tabularnewline
Raw Input & view raw input (R code)  \tabularnewline
Raw Output & view raw output of R engine  \tabularnewline
Computing time & 1 seconds \tabularnewline
R Server & 'Gwilym Jenkins' @ jenkins.wessa.net \tabularnewline
\hline
\end{tabular}
%Source: https://freestatistics.org/blog/index.php?pk=123354&T=0

[TABLE]
[ROW][C]Summary of computational transaction[/C][/ROW]
[ROW][C]Raw Input[/C][C]view raw input (R code) [/C][/ROW]
[ROW][C]Raw Output[/C][C]view raw output of R engine [/C][/ROW]
[ROW][C]Computing time[/C][C]1 seconds[/C][/ROW]
[ROW][C]R Server[/C][C]'Gwilym Jenkins' @ jenkins.wessa.net[/C][/ROW]
[/TABLE]
Source: https://freestatistics.org/blog/index.php?pk=123354&T=0

Globally Unique Identifier (entire table): ba.freestatistics.org/blog/index.php?pk=123354&T=0

As an alternative you can also use a QR Code:  

The GUIDs for individual cells are displayed in the table below:

Summary of computational transaction
Raw Inputview raw input (R code)
Raw Outputview raw output of R engine
Computing time1 seconds
R Server'Gwilym Jenkins' @ jenkins.wessa.net


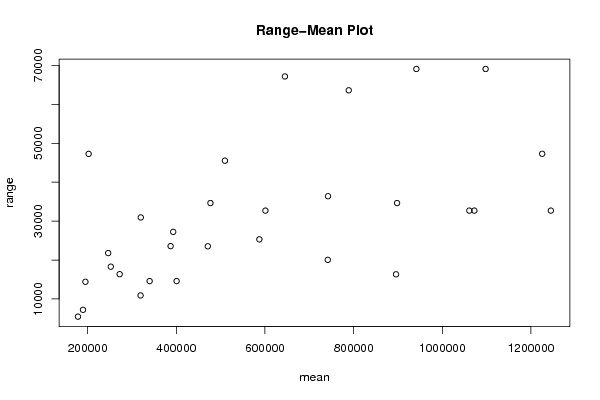
Standard Deviation-Mean Plot
SectionMeanStandard DeviationRange
1189404.253081.074312097437208
2202102.7522763.154400258347284
3178013.52571.407461553565453
4194846.256140.8356855290214416
524623010432.824353932221796
6252073.257669.840605688418286
7272124.758182.2778154985716364
831977113856.515314705430947
9319287.755229.3577282492410912
10339724.56308.3433377287514582
11392907.7512538.90721913227243
12387028.759935.0431763866423572
134005966719.5741432524314588
14471018.2511199.854831648523539
15476912.2515640.507118270434651
16509598.7520281.856906687245534
17587272.7511393.434904218625321
18600945.2513858.430680155232696
1964499230982.867792808867181
20741689.259329.3003444345520041
21742169.515819.034810421736400
2278894430767.782348857563620
238957107104.7311466843516337
24897946.7516249.224686632534651
2594150731564.842520331669107
261060975.513594.648199444832702
271072316.2514110.780568416532702
281097718.532332.978772970169102
291225369.520706.878897281147311
30124492716055.052517302332701

\begin{tabular}{lllllllll}
\hline
Standard Deviation-Mean Plot \tabularnewline
Section & Mean & Standard Deviation & Range \tabularnewline
1 & 189404.25 & 3081.07431209743 & 7208 \tabularnewline
2 & 202102.75 & 22763.1544002583 & 47284 \tabularnewline
3 & 178013.5 & 2571.40746155356 & 5453 \tabularnewline
4 & 194846.25 & 6140.83568552902 & 14416 \tabularnewline
5 & 246230 & 10432.8243539322 & 21796 \tabularnewline
6 & 252073.25 & 7669.8406056884 & 18286 \tabularnewline
7 & 272124.75 & 8182.27781549857 & 16364 \tabularnewline
8 & 319771 & 13856.5153147054 & 30947 \tabularnewline
9 & 319287.75 & 5229.35772824924 & 10912 \tabularnewline
10 & 339724.5 & 6308.34333772875 & 14582 \tabularnewline
11 & 392907.75 & 12538.907219132 & 27243 \tabularnewline
12 & 387028.75 & 9935.04317638664 & 23572 \tabularnewline
13 & 400596 & 6719.57414325243 & 14588 \tabularnewline
14 & 471018.25 & 11199.8548316485 & 23539 \tabularnewline
15 & 476912.25 & 15640.5071182704 & 34651 \tabularnewline
16 & 509598.75 & 20281.8569066872 & 45534 \tabularnewline
17 & 587272.75 & 11393.4349042186 & 25321 \tabularnewline
18 & 600945.25 & 13858.4306801552 & 32696 \tabularnewline
19 & 644992 & 30982.8677928088 & 67181 \tabularnewline
20 & 741689.25 & 9329.30034443455 & 20041 \tabularnewline
21 & 742169.5 & 15819.0348104217 & 36400 \tabularnewline
22 & 788944 & 30767.7823488575 & 63620 \tabularnewline
23 & 895710 & 7104.73114668435 & 16337 \tabularnewline
24 & 897946.75 & 16249.2246866325 & 34651 \tabularnewline
25 & 941507 & 31564.8425203316 & 69107 \tabularnewline
26 & 1060975.5 & 13594.6481994448 & 32702 \tabularnewline
27 & 1072316.25 & 14110.7805684165 & 32702 \tabularnewline
28 & 1097718.5 & 32332.9787729701 & 69102 \tabularnewline
29 & 1225369.5 & 20706.8788972811 & 47311 \tabularnewline
30 & 1244927 & 16055.0525173023 & 32701 \tabularnewline
\hline
\end{tabular}
%Source: https://freestatistics.org/blog/index.php?pk=123354&T=1

[TABLE]
[ROW][C]Standard Deviation-Mean Plot[/C][/ROW]
[ROW][C]Section[/C][C]Mean[/C][C]Standard Deviation[/C][C]Range[/C][/ROW]
[ROW][C]1[/C][C]189404.25[/C][C]3081.07431209743[/C][C]7208[/C][/ROW]
[ROW][C]2[/C][C]202102.75[/C][C]22763.1544002583[/C][C]47284[/C][/ROW]
[ROW][C]3[/C][C]178013.5[/C][C]2571.40746155356[/C][C]5453[/C][/ROW]
[ROW][C]4[/C][C]194846.25[/C][C]6140.83568552902[/C][C]14416[/C][/ROW]
[ROW][C]5[/C][C]246230[/C][C]10432.8243539322[/C][C]21796[/C][/ROW]
[ROW][C]6[/C][C]252073.25[/C][C]7669.8406056884[/C][C]18286[/C][/ROW]
[ROW][C]7[/C][C]272124.75[/C][C]8182.27781549857[/C][C]16364[/C][/ROW]
[ROW][C]8[/C][C]319771[/C][C]13856.5153147054[/C][C]30947[/C][/ROW]
[ROW][C]9[/C][C]319287.75[/C][C]5229.35772824924[/C][C]10912[/C][/ROW]
[ROW][C]10[/C][C]339724.5[/C][C]6308.34333772875[/C][C]14582[/C][/ROW]
[ROW][C]11[/C][C]392907.75[/C][C]12538.907219132[/C][C]27243[/C][/ROW]
[ROW][C]12[/C][C]387028.75[/C][C]9935.04317638664[/C][C]23572[/C][/ROW]
[ROW][C]13[/C][C]400596[/C][C]6719.57414325243[/C][C]14588[/C][/ROW]
[ROW][C]14[/C][C]471018.25[/C][C]11199.8548316485[/C][C]23539[/C][/ROW]
[ROW][C]15[/C][C]476912.25[/C][C]15640.5071182704[/C][C]34651[/C][/ROW]
[ROW][C]16[/C][C]509598.75[/C][C]20281.8569066872[/C][C]45534[/C][/ROW]
[ROW][C]17[/C][C]587272.75[/C][C]11393.4349042186[/C][C]25321[/C][/ROW]
[ROW][C]18[/C][C]600945.25[/C][C]13858.4306801552[/C][C]32696[/C][/ROW]
[ROW][C]19[/C][C]644992[/C][C]30982.8677928088[/C][C]67181[/C][/ROW]
[ROW][C]20[/C][C]741689.25[/C][C]9329.30034443455[/C][C]20041[/C][/ROW]
[ROW][C]21[/C][C]742169.5[/C][C]15819.0348104217[/C][C]36400[/C][/ROW]
[ROW][C]22[/C][C]788944[/C][C]30767.7823488575[/C][C]63620[/C][/ROW]
[ROW][C]23[/C][C]895710[/C][C]7104.73114668435[/C][C]16337[/C][/ROW]
[ROW][C]24[/C][C]897946.75[/C][C]16249.2246866325[/C][C]34651[/C][/ROW]
[ROW][C]25[/C][C]941507[/C][C]31564.8425203316[/C][C]69107[/C][/ROW]
[ROW][C]26[/C][C]1060975.5[/C][C]13594.6481994448[/C][C]32702[/C][/ROW]
[ROW][C]27[/C][C]1072316.25[/C][C]14110.7805684165[/C][C]32702[/C][/ROW]
[ROW][C]28[/C][C]1097718.5[/C][C]32332.9787729701[/C][C]69102[/C][/ROW]
[ROW][C]29[/C][C]1225369.5[/C][C]20706.8788972811[/C][C]47311[/C][/ROW]
[ROW][C]30[/C][C]1244927[/C][C]16055.0525173023[/C][C]32701[/C][/ROW]
[/TABLE]
Source: https://freestatistics.org/blog/index.php?pk=123354&T=1

Globally Unique Identifier (entire table): ba.freestatistics.org/blog/index.php?pk=123354&T=1

As an alternative you can also use a QR Code:  

The GUIDs for individual cells are displayed in the table below:

Standard Deviation-Mean Plot
SectionMeanStandard DeviationRange
1189404.253081.074312097437208
2202102.7522763.154400258347284
3178013.52571.407461553565453
4194846.256140.8356855290214416
524623010432.824353932221796
6252073.257669.840605688418286
7272124.758182.2778154985716364
831977113856.515314705430947
9319287.755229.3577282492410912
10339724.56308.3433377287514582
11392907.7512538.90721913227243
12387028.759935.0431763866423572
134005966719.5741432524314588
14471018.2511199.854831648523539
15476912.2515640.507118270434651
16509598.7520281.856906687245534
17587272.7511393.434904218625321
18600945.2513858.430680155232696
1964499230982.867792808867181
20741689.259329.3003444345520041
21742169.515819.034810421736400
2278894430767.782348857563620
238957107104.7311466843516337
24897946.7516249.224686632534651
2594150731564.842520331669107
261060975.513594.648199444832702
271072316.2514110.780568416532702
281097718.532332.978772970169102
291225369.520706.878897281147311
30124492716055.052517302332701


Regression: S.E.(k) = alpha + beta * Mean(k)
alpha6313.39786473287
beta0.0133953757786465
S.D.0.00403429423803501
T-STAT3.32037649915465
p-value0.00250633392289015

\begin{tabular}{lllllllll}
\hline
Regression: S.E.(k) = alpha + beta * Mean(k) \tabularnewline
alpha & 6313.39786473287 \tabularnewline
beta & 0.0133953757786465 \tabularnewline
S.D. & 0.00403429423803501 \tabularnewline
T-STAT & 3.32037649915465 \tabularnewline
p-value & 0.00250633392289015 \tabularnewline
\hline
\end{tabular}
%Source: https://freestatistics.org/blog/index.php?pk=123354&T=2

[TABLE]
[ROW][C]Regression: S.E.(k) = alpha + beta * Mean(k)[/C][/ROW]
[ROW][C]alpha[/C][C]6313.39786473287[/C][/ROW]
[ROW][C]beta[/C][C]0.0133953757786465[/C][/ROW]
[ROW][C]S.D.[/C][C]0.00403429423803501[/C][/ROW]
[ROW][C]T-STAT[/C][C]3.32037649915465[/C][/ROW]
[ROW][C]p-value[/C][C]0.00250633392289015[/C][/ROW]
[/TABLE]
Source: https://freestatistics.org/blog/index.php?pk=123354&T=2

Globally Unique Identifier (entire table): ba.freestatistics.org/blog/index.php?pk=123354&T=2

As an alternative you can also use a QR Code:  

The GUIDs for individual cells are displayed in the table below:

Regression: S.E.(k) = alpha + beta * Mean(k)
alpha6313.39786473287
beta0.0133953757786465
S.D.0.00403429423803501
T-STAT3.32037649915465
p-value0.00250633392289015


Regression: ln S.E.(k) = alpha + beta * ln Mean(k)
alpha0.660051915286549
beta0.664857690568654
S.D.0.152663171681276
T-STAT4.35506273875089
p-value0.000161142694610988
Lambda0.335142309431346

\begin{tabular}{lllllllll}
\hline
Regression: ln S.E.(k) = alpha + beta * ln Mean(k) \tabularnewline
alpha & 0.660051915286549 \tabularnewline
beta & 0.664857690568654 \tabularnewline
S.D. & 0.152663171681276 \tabularnewline
T-STAT & 4.35506273875089 \tabularnewline
p-value & 0.000161142694610988 \tabularnewline
Lambda & 0.335142309431346 \tabularnewline
\hline
\end{tabular}
%Source: https://freestatistics.org/blog/index.php?pk=123354&T=3

[TABLE]
[ROW][C]Regression: ln S.E.(k) = alpha + beta * ln Mean(k)[/C][/ROW]
[ROW][C]alpha[/C][C]0.660051915286549[/C][/ROW]
[ROW][C]beta[/C][C]0.664857690568654[/C][/ROW]
[ROW][C]S.D.[/C][C]0.152663171681276[/C][/ROW]
[ROW][C]T-STAT[/C][C]4.35506273875089[/C][/ROW]
[ROW][C]p-value[/C][C]0.000161142694610988[/C][/ROW]
[ROW][C]Lambda[/C][C]0.335142309431346[/C][/ROW]
[/TABLE]
Source: https://freestatistics.org/blog/index.php?pk=123354&T=3

Globally Unique Identifier (entire table): ba.freestatistics.org/blog/index.php?pk=123354&T=3

As an alternative you can also use a QR Code:  

The GUIDs for individual cells are displayed in the table below:

Regression: ln S.E.(k) = alpha + beta * ln Mean(k)
alpha0.660051915286549
beta0.664857690568654
S.D.0.152663171681276
T-STAT4.35506273875089
p-value0.000161142694610988
Lambda0.335142309431346


Parameters (Session):
par1 = 4 ;
Parameters (R input):
par1 = 4 ;
R code (references can be found in the software module):
par1 <- as.numeric(par1)
(n <- length(x))
(np <- floor(n / par1))
arr <- array(NA,dim=c(par1,np))
j <- 0
k <- 1
for (i in 1:(np*par1))
{
j = j + 1
arr[j,k] <- x[i]
if (j == par1) {
j = 0
k=k+1
}
}
arr
arr.mean <- array(NA,dim=np)
arr.sd <- array(NA,dim=np)
arr.range <- array(NA,dim=np)
for (j in 1:np)
{
arr.mean[j] <- mean(arr[,j],na.rm=TRUE)
arr.sd[j] <- sd(arr[,j],na.rm=TRUE)
arr.range[j] <- max(arr[,j],na.rm=TRUE) - min(arr[,j],na.rm=TRUE)
}
arr.mean
arr.sd
arr.range
(lm1 <- lm(arr.sd~arr.mean))
(lnlm1 <- lm(log(arr.sd)~log(arr.mean)))
(lm2 <- lm(arr.range~arr.mean))
bitmap(file='test1.png')
plot(arr.mean,arr.sd,main='Standard Deviation-Mean Plot',xlab='mean',ylab='standard deviation')
dev.off()
bitmap(file='test2.png')
plot(arr.mean,arr.range,main='Range-Mean Plot',xlab='mean',ylab='range')
dev.off()
load(file='createtable')
a<-table.start()
a<-table.row.start(a)
a<-table.element(a,'Standard Deviation-Mean Plot',4,TRUE)
a<-table.row.end(a)
a<-table.row.start(a)
a<-table.element(a,'Section',header=TRUE)
a<-table.element(a,'Mean',header=TRUE)
a<-table.element(a,'Standard Deviation',header=TRUE)
a<-table.element(a,'Range',header=TRUE)
a<-table.row.end(a)
for (j in 1:np) {
a<-table.row.start(a)
a<-table.element(a,j,header=TRUE)
a<-table.element(a,arr.mean[j])
a<-table.element(a,arr.sd[j] )
a<-table.element(a,arr.range[j] )
a<-table.row.end(a)
}
a<-table.end(a)
table.save(a,file='mytable.tab')
a<-table.start()
a<-table.row.start(a)
a<-table.element(a,'Regression: S.E.(k) = alpha + beta * Mean(k)',2,TRUE)
a<-table.row.end(a)
a<-table.row.start(a)
a<-table.element(a,'alpha',header=TRUE)
a<-table.element(a,lm1$coefficients[[1]])
a<-table.row.end(a)
a<-table.row.start(a)
a<-table.element(a,'beta',header=TRUE)
a<-table.element(a,lm1$coefficients[[2]])
a<-table.row.end(a)
a<-table.row.start(a)
a<-table.element(a,'S.D.',header=TRUE)
a<-table.element(a,summary(lm1)$coefficients[2,2])
a<-table.row.end(a)
a<-table.row.start(a)
a<-table.element(a,'T-STAT',header=TRUE)
a<-table.element(a,summary(lm1)$coefficients[2,3])
a<-table.row.end(a)
a<-table.row.start(a)
a<-table.element(a,'p-value',header=TRUE)
a<-table.element(a,summary(lm1)$coefficients[2,4])
a<-table.row.end(a)
a<-table.end(a)
table.save(a,file='mytable1.tab')
a<-table.start()
a<-table.row.start(a)
a<-table.element(a,'Regression: ln S.E.(k) = alpha + beta * ln Mean(k)',2,TRUE)
a<-table.row.end(a)
a<-table.row.start(a)
a<-table.element(a,'alpha',header=TRUE)
a<-table.element(a,lnlm1$coefficients[[1]])
a<-table.row.end(a)
a<-table.row.start(a)
a<-table.element(a,'beta',header=TRUE)
a<-table.element(a,lnlm1$coefficients[[2]])
a<-table.row.end(a)
a<-table.row.start(a)
a<-table.element(a,'S.D.',header=TRUE)
a<-table.element(a,summary(lnlm1)$coefficients[2,2])
a<-table.row.end(a)
a<-table.row.start(a)
a<-table.element(a,'T-STAT',header=TRUE)
a<-table.element(a,summary(lnlm1)$coefficients[2,3])
a<-table.row.end(a)
a<-table.row.start(a)
a<-table.element(a,'p-value',header=TRUE)
a<-table.element(a,summary(lnlm1)$coefficients[2,4])
a<-table.row.end(a)
a<-table.row.start(a)
a<-table.element(a,'Lambda',header=TRUE)
a<-table.element(a,1-lnlm1$coefficients[[2]])
a<-table.row.end(a)
a<-table.end(a)
table.save(a,file='mytable2.tab')