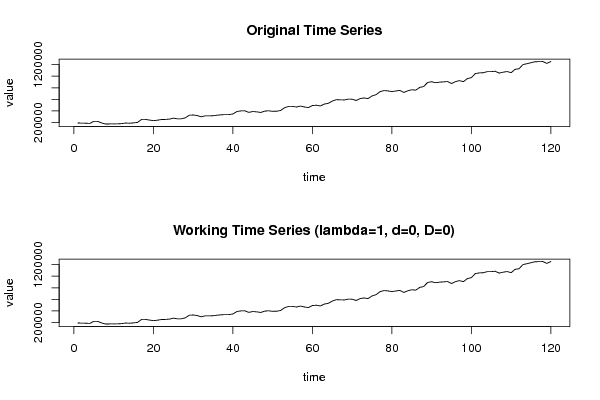
Free Statistics

of Irreproducible Research!

Author's title

Author*Unverified author*
R Software Modulerwasp_autocorrelation.wasp
Title produced by software(Partial) Autocorrelation Function
Date of computationWed, 03 Aug 2011 10:31:57 -0400
Cite this page as followsStatistical Computations at FreeStatistics.org, Office for Research Development and Education, URL https://freestatistics.org/blog/index.php?v=date/2011/Aug/03/t1312381994mqeqb9wsmv2m9ve.htm/, Retrieved Tue, 14 May 2024 05:55:00 +0000
Statistical Computations at FreeStatistics.org, Office for Research Development and Education, URL https://freestatistics.org/blog/index.php?pk=123351, Retrieved Tue, 14 May 2024 05:55:00 +0000
QR Codes:

Original text written by user:
IsPrivate?No (this computation is public)
User-defined keywordsSergeyssels Ivan
Estimated Impact168
Family? (F = Feedback message, R = changed R code, M = changed R Module, P = changed Parameters, D = changed Data)
-       [(Partial) Autocorrelation Function] [Tijdreeks A - Sta...] [2011-08-03 14:31:57] [bc909d11ab9ae813672fa3903785080c] [Current]
Feedback Forum

Post a new message
Dataseries X:
192528
190773
188996
185320
221698
219771
192528
174414
176163
176163
178112
181616
192528
188996
194449
203412
254400
254400
243516
232604
241567
252473
254400
259853
276217
265306
265306
281670
327033
330709
321580
299762
316121
316121
317876
327033
334241
337917
337917
348823
390681
401565
403314
376071
390681
385228
374317
397889
403314
394185
396112
408773
456085
479624
479624
468740
485082
468740
459588
494239
499664
486832
519533
532366
570521
595842
592339
590389
604999
603222
581432
614128
625040
614128
659491
681309
732102
752143
746712
735800
744935
755841
719441
748461
766753
759373
806657
822993
892101
904761
888424
897554
903007
908460
873809
906511
924624
906511
959275
975618
1046468
1057380
1060884
1079170
1079170
1086378
1053676
1070041
1080925
1060884
1119079
1129986
1202597
1215430
1233543
1249908
1251657
1253584
1220883
1253584


Summary of computational transaction
Raw Inputview raw input (R code)
Raw Outputview raw output of R engine
Computing time1 seconds
R Server'AstonUniversity' @ aston.wessa.net

\begin{tabular}{lllllllll}
\hline
Summary of computational transaction \tabularnewline
Raw Input & view raw input (R code)  \tabularnewline
Raw Output & view raw output of R engine  \tabularnewline
Computing time & 1 seconds \tabularnewline
R Server & 'AstonUniversity' @ aston.wessa.net \tabularnewline
\hline
\end{tabular}
%Source: https://freestatistics.org/blog/index.php?pk=123351&T=0

[TABLE]
[ROW][C]Summary of computational transaction[/C][/ROW]
[ROW][C]Raw Input[/C][C]view raw input (R code) [/C][/ROW]
[ROW][C]Raw Output[/C][C]view raw output of R engine [/C][/ROW]
[ROW][C]Computing time[/C][C]1 seconds[/C][/ROW]
[ROW][C]R Server[/C][C]'AstonUniversity' @ aston.wessa.net[/C][/ROW]
[/TABLE]
Source: https://freestatistics.org/blog/index.php?pk=123351&T=0

Globally Unique Identifier (entire table): ba.freestatistics.org/blog/index.php?pk=123351&T=0

As an alternative you can also use a QR Code:  

The GUIDs for individual cells are displayed in the table below:

Summary of computational transaction
Raw Inputview raw input (R code)
Raw Outputview raw output of R engine
Computing time1 seconds
R Server'AstonUniversity' @ aston.wessa.net


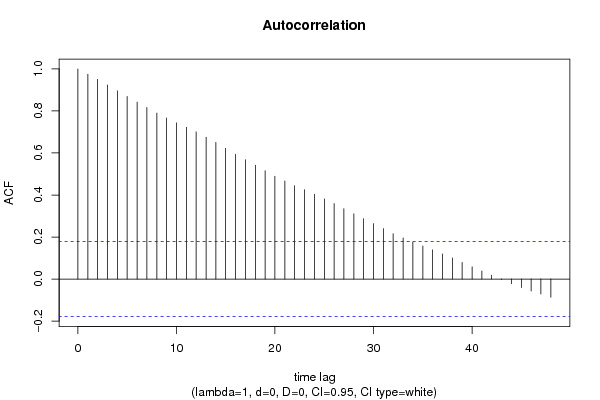
Autocorrelation Function
Time lag kACF(k)T-STATP-value
10.97471910.67750
20.95039510.41110
30.92351610.11660
40.8958759.81380
50.8690729.52020
60.8423119.22710
70.8164468.94370
80.78988.65180
90.7667178.3990
100.7435868.14560
110.7229077.9190
120.7006377.67510
130.6751797.39620
140.6498337.11860
150.6222466.81640
160.5944656.5120
170.5678056.220
180.5415115.9320
190.5156225.64840
200.4892585.35960
210.4665475.11081e-06
220.4446294.87072e-06
230.4250494.65624e-06
240.4040814.42651.1e-05
250.3812884.17682.8e-05
260.3591693.93457e-05
270.3347323.66680.000184
280.3102513.39860.00046
290.2869823.14370.001051
300.2639372.89130.002278
310.2401662.63090.004817
320.2159112.36520.009812
330.1953362.13980.017198
340.1754081.92150.02852
350.1575811.72620.043441
360.1390181.52290.065211
370.1191111.30480.09723
380.1001561.09720.137386
390.0790280.86570.194188
400.0579960.63530.263217
410.0382730.41930.337887
420.0181420.19870.421404
43-0.001973-0.02160.491395
44-0.022262-0.24390.403874
45-0.03994-0.43750.331261
46-0.056616-0.62020.268153
47-0.071657-0.7850.21701
48-0.087163-0.95480.170793

\begin{tabular}{lllllllll}
\hline
Autocorrelation Function \tabularnewline
Time lag k & ACF(k) & T-STAT & P-value \tabularnewline
1 & 0.974719 & 10.6775 & 0 \tabularnewline
2 & 0.950395 & 10.4111 & 0 \tabularnewline
3 & 0.923516 & 10.1166 & 0 \tabularnewline
4 & 0.895875 & 9.8138 & 0 \tabularnewline
5 & 0.869072 & 9.5202 & 0 \tabularnewline
6 & 0.842311 & 9.2271 & 0 \tabularnewline
7 & 0.816446 & 8.9437 & 0 \tabularnewline
8 & 0.7898 & 8.6518 & 0 \tabularnewline
9 & 0.766717 & 8.399 & 0 \tabularnewline
10 & 0.743586 & 8.1456 & 0 \tabularnewline
11 & 0.722907 & 7.919 & 0 \tabularnewline
12 & 0.700637 & 7.6751 & 0 \tabularnewline
13 & 0.675179 & 7.3962 & 0 \tabularnewline
14 & 0.649833 & 7.1186 & 0 \tabularnewline
15 & 0.622246 & 6.8164 & 0 \tabularnewline
16 & 0.594465 & 6.512 & 0 \tabularnewline
17 & 0.567805 & 6.22 & 0 \tabularnewline
18 & 0.541511 & 5.932 & 0 \tabularnewline
19 & 0.515622 & 5.6484 & 0 \tabularnewline
20 & 0.489258 & 5.3596 & 0 \tabularnewline
21 & 0.466547 & 5.1108 & 1e-06 \tabularnewline
22 & 0.444629 & 4.8707 & 2e-06 \tabularnewline
23 & 0.425049 & 4.6562 & 4e-06 \tabularnewline
24 & 0.404081 & 4.4265 & 1.1e-05 \tabularnewline
25 & 0.381288 & 4.1768 & 2.8e-05 \tabularnewline
26 & 0.359169 & 3.9345 & 7e-05 \tabularnewline
27 & 0.334732 & 3.6668 & 0.000184 \tabularnewline
28 & 0.310251 & 3.3986 & 0.00046 \tabularnewline
29 & 0.286982 & 3.1437 & 0.001051 \tabularnewline
30 & 0.263937 & 2.8913 & 0.002278 \tabularnewline
31 & 0.240166 & 2.6309 & 0.004817 \tabularnewline
32 & 0.215911 & 2.3652 & 0.009812 \tabularnewline
33 & 0.195336 & 2.1398 & 0.017198 \tabularnewline
34 & 0.175408 & 1.9215 & 0.02852 \tabularnewline
35 & 0.157581 & 1.7262 & 0.043441 \tabularnewline
36 & 0.139018 & 1.5229 & 0.065211 \tabularnewline
37 & 0.119111 & 1.3048 & 0.09723 \tabularnewline
38 & 0.100156 & 1.0972 & 0.137386 \tabularnewline
39 & 0.079028 & 0.8657 & 0.194188 \tabularnewline
40 & 0.057996 & 0.6353 & 0.263217 \tabularnewline
41 & 0.038273 & 0.4193 & 0.337887 \tabularnewline
42 & 0.018142 & 0.1987 & 0.421404 \tabularnewline
43 & -0.001973 & -0.0216 & 0.491395 \tabularnewline
44 & -0.022262 & -0.2439 & 0.403874 \tabularnewline
45 & -0.03994 & -0.4375 & 0.331261 \tabularnewline
46 & -0.056616 & -0.6202 & 0.268153 \tabularnewline
47 & -0.071657 & -0.785 & 0.21701 \tabularnewline
48 & -0.087163 & -0.9548 & 0.170793 \tabularnewline
\hline
\end{tabular}
%Source: https://freestatistics.org/blog/index.php?pk=123351&T=1

[TABLE]
[ROW][C]Autocorrelation Function[/C][/ROW]
[ROW][C]Time lag k[/C][C]ACF(k)[/C][C]T-STAT[/C][C]P-value[/C][/ROW]
[ROW][C]1[/C][C]0.974719[/C][C]10.6775[/C][C]0[/C][/ROW]
[ROW][C]2[/C][C]0.950395[/C][C]10.4111[/C][C]0[/C][/ROW]
[ROW][C]3[/C][C]0.923516[/C][C]10.1166[/C][C]0[/C][/ROW]
[ROW][C]4[/C][C]0.895875[/C][C]9.8138[/C][C]0[/C][/ROW]
[ROW][C]5[/C][C]0.869072[/C][C]9.5202[/C][C]0[/C][/ROW]
[ROW][C]6[/C][C]0.842311[/C][C]9.2271[/C][C]0[/C][/ROW]
[ROW][C]7[/C][C]0.816446[/C][C]8.9437[/C][C]0[/C][/ROW]
[ROW][C]8[/C][C]0.7898[/C][C]8.6518[/C][C]0[/C][/ROW]
[ROW][C]9[/C][C]0.766717[/C][C]8.399[/C][C]0[/C][/ROW]
[ROW][C]10[/C][C]0.743586[/C][C]8.1456[/C][C]0[/C][/ROW]
[ROW][C]11[/C][C]0.722907[/C][C]7.919[/C][C]0[/C][/ROW]
[ROW][C]12[/C][C]0.700637[/C][C]7.6751[/C][C]0[/C][/ROW]
[ROW][C]13[/C][C]0.675179[/C][C]7.3962[/C][C]0[/C][/ROW]
[ROW][C]14[/C][C]0.649833[/C][C]7.1186[/C][C]0[/C][/ROW]
[ROW][C]15[/C][C]0.622246[/C][C]6.8164[/C][C]0[/C][/ROW]
[ROW][C]16[/C][C]0.594465[/C][C]6.512[/C][C]0[/C][/ROW]
[ROW][C]17[/C][C]0.567805[/C][C]6.22[/C][C]0[/C][/ROW]
[ROW][C]18[/C][C]0.541511[/C][C]5.932[/C][C]0[/C][/ROW]
[ROW][C]19[/C][C]0.515622[/C][C]5.6484[/C][C]0[/C][/ROW]
[ROW][C]20[/C][C]0.489258[/C][C]5.3596[/C][C]0[/C][/ROW]
[ROW][C]21[/C][C]0.466547[/C][C]5.1108[/C][C]1e-06[/C][/ROW]
[ROW][C]22[/C][C]0.444629[/C][C]4.8707[/C][C]2e-06[/C][/ROW]
[ROW][C]23[/C][C]0.425049[/C][C]4.6562[/C][C]4e-06[/C][/ROW]
[ROW][C]24[/C][C]0.404081[/C][C]4.4265[/C][C]1.1e-05[/C][/ROW]
[ROW][C]25[/C][C]0.381288[/C][C]4.1768[/C][C]2.8e-05[/C][/ROW]
[ROW][C]26[/C][C]0.359169[/C][C]3.9345[/C][C]7e-05[/C][/ROW]
[ROW][C]27[/C][C]0.334732[/C][C]3.6668[/C][C]0.000184[/C][/ROW]
[ROW][C]28[/C][C]0.310251[/C][C]3.3986[/C][C]0.00046[/C][/ROW]
[ROW][C]29[/C][C]0.286982[/C][C]3.1437[/C][C]0.001051[/C][/ROW]
[ROW][C]30[/C][C]0.263937[/C][C]2.8913[/C][C]0.002278[/C][/ROW]
[ROW][C]31[/C][C]0.240166[/C][C]2.6309[/C][C]0.004817[/C][/ROW]
[ROW][C]32[/C][C]0.215911[/C][C]2.3652[/C][C]0.009812[/C][/ROW]
[ROW][C]33[/C][C]0.195336[/C][C]2.1398[/C][C]0.017198[/C][/ROW]
[ROW][C]34[/C][C]0.175408[/C][C]1.9215[/C][C]0.02852[/C][/ROW]
[ROW][C]35[/C][C]0.157581[/C][C]1.7262[/C][C]0.043441[/C][/ROW]
[ROW][C]36[/C][C]0.139018[/C][C]1.5229[/C][C]0.065211[/C][/ROW]
[ROW][C]37[/C][C]0.119111[/C][C]1.3048[/C][C]0.09723[/C][/ROW]
[ROW][C]38[/C][C]0.100156[/C][C]1.0972[/C][C]0.137386[/C][/ROW]
[ROW][C]39[/C][C]0.079028[/C][C]0.8657[/C][C]0.194188[/C][/ROW]
[ROW][C]40[/C][C]0.057996[/C][C]0.6353[/C][C]0.263217[/C][/ROW]
[ROW][C]41[/C][C]0.038273[/C][C]0.4193[/C][C]0.337887[/C][/ROW]
[ROW][C]42[/C][C]0.018142[/C][C]0.1987[/C][C]0.421404[/C][/ROW]
[ROW][C]43[/C][C]-0.001973[/C][C]-0.0216[/C][C]0.491395[/C][/ROW]
[ROW][C]44[/C][C]-0.022262[/C][C]-0.2439[/C][C]0.403874[/C][/ROW]
[ROW][C]45[/C][C]-0.03994[/C][C]-0.4375[/C][C]0.331261[/C][/ROW]
[ROW][C]46[/C][C]-0.056616[/C][C]-0.6202[/C][C]0.268153[/C][/ROW]
[ROW][C]47[/C][C]-0.071657[/C][C]-0.785[/C][C]0.21701[/C][/ROW]
[ROW][C]48[/C][C]-0.087163[/C][C]-0.9548[/C][C]0.170793[/C][/ROW]
[/TABLE]
Source: https://freestatistics.org/blog/index.php?pk=123351&T=1

Globally Unique Identifier (entire table): ba.freestatistics.org/blog/index.php?pk=123351&T=1

As an alternative you can also use a QR Code:  

The GUIDs for individual cells are displayed in the table below:

Autocorrelation Function
Time lag kACF(k)T-STATP-value
10.97471910.67750
20.95039510.41110
30.92351610.11660
40.8958759.81380
50.8690729.52020
60.8423119.22710
70.8164468.94370
80.78988.65180
90.7667178.3990
100.7435868.14560
110.7229077.9190
120.7006377.67510
130.6751797.39620
140.6498337.11860
150.6222466.81640
160.5944656.5120
170.5678056.220
180.5415115.9320
190.5156225.64840
200.4892585.35960
210.4665475.11081e-06
220.4446294.87072e-06
230.4250494.65624e-06
240.4040814.42651.1e-05
250.3812884.17682.8e-05
260.3591693.93457e-05
270.3347323.66680.000184
280.3102513.39860.00046
290.2869823.14370.001051
300.2639372.89130.002278
310.2401662.63090.004817
320.2159112.36520.009812
330.1953362.13980.017198
340.1754081.92150.02852
350.1575811.72620.043441
360.1390181.52290.065211
370.1191111.30480.09723
380.1001561.09720.137386
390.0790280.86570.194188
400.0579960.63530.263217
410.0382730.41930.337887
420.0181420.19870.421404
43-0.001973-0.02160.491395
44-0.022262-0.24390.403874
45-0.03994-0.43750.331261
46-0.056616-0.62020.268153
47-0.071657-0.7850.21701
48-0.087163-0.95480.170793


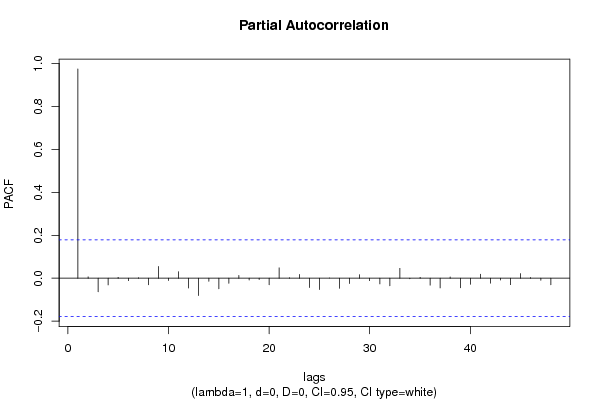
Partial Autocorrelation Function
Time lag kPACF(k)T-STATP-value
10.97471910.67750
20.0063680.06980.472253
3-0.063311-0.69350.244657
4-0.031197-0.34170.36657
50.0041570.04550.481876
6-0.011185-0.12250.451342
70.0020640.02260.490998
8-0.030063-0.32930.371244
90.0548150.60050.274664
10-0.010431-0.11430.454609
110.0302580.33150.37044
12-0.04571-0.50070.308739
13-0.080954-0.88680.188479
14-0.014005-0.15340.439162
15-0.049488-0.54210.294372
16-0.02328-0.2550.399574
170.0129710.14210.443625
18-0.00874-0.09570.461945
19-0.006114-0.0670.473356
20-0.030349-0.33250.37006
210.0483570.52970.298642
220.0021780.02390.490502
230.0173620.19020.42474
24-0.043154-0.47270.318634
25-0.053015-0.58070.28125
26-7.7e-05-8e-040.499664
27-0.046988-0.51470.303845
28-0.025061-0.27450.392076
290.0165220.1810.42834
30-0.011396-0.12480.450431
31-0.026337-0.28850.386728
32-0.03544-0.38820.349267
330.0459470.50330.307831
34-0.002612-0.02860.488612
350.0042850.04690.481322
36-0.032199-0.35270.362458
37-0.045079-0.49380.311169
380.0056710.06210.475285
39-0.04436-0.48590.313948
40-0.028294-0.30990.37857
410.0185480.20320.419669
42-0.022868-0.25050.401312
43-0.008316-0.09110.463782
44-0.02998-0.32840.371585
450.0216220.23690.406585
460.0039550.04330.482757
47-0.009773-0.10710.45746
48-0.030051-0.32920.371291

\begin{tabular}{lllllllll}
\hline
Partial Autocorrelation Function \tabularnewline
Time lag k & PACF(k) & T-STAT & P-value \tabularnewline
1 & 0.974719 & 10.6775 & 0 \tabularnewline
2 & 0.006368 & 0.0698 & 0.472253 \tabularnewline
3 & -0.063311 & -0.6935 & 0.244657 \tabularnewline
4 & -0.031197 & -0.3417 & 0.36657 \tabularnewline
5 & 0.004157 & 0.0455 & 0.481876 \tabularnewline
6 & -0.011185 & -0.1225 & 0.451342 \tabularnewline
7 & 0.002064 & 0.0226 & 0.490998 \tabularnewline
8 & -0.030063 & -0.3293 & 0.371244 \tabularnewline
9 & 0.054815 & 0.6005 & 0.274664 \tabularnewline
10 & -0.010431 & -0.1143 & 0.454609 \tabularnewline
11 & 0.030258 & 0.3315 & 0.37044 \tabularnewline
12 & -0.04571 & -0.5007 & 0.308739 \tabularnewline
13 & -0.080954 & -0.8868 & 0.188479 \tabularnewline
14 & -0.014005 & -0.1534 & 0.439162 \tabularnewline
15 & -0.049488 & -0.5421 & 0.294372 \tabularnewline
16 & -0.02328 & -0.255 & 0.399574 \tabularnewline
17 & 0.012971 & 0.1421 & 0.443625 \tabularnewline
18 & -0.00874 & -0.0957 & 0.461945 \tabularnewline
19 & -0.006114 & -0.067 & 0.473356 \tabularnewline
20 & -0.030349 & -0.3325 & 0.37006 \tabularnewline
21 & 0.048357 & 0.5297 & 0.298642 \tabularnewline
22 & 0.002178 & 0.0239 & 0.490502 \tabularnewline
23 & 0.017362 & 0.1902 & 0.42474 \tabularnewline
24 & -0.043154 & -0.4727 & 0.318634 \tabularnewline
25 & -0.053015 & -0.5807 & 0.28125 \tabularnewline
26 & -7.7e-05 & -8e-04 & 0.499664 \tabularnewline
27 & -0.046988 & -0.5147 & 0.303845 \tabularnewline
28 & -0.025061 & -0.2745 & 0.392076 \tabularnewline
29 & 0.016522 & 0.181 & 0.42834 \tabularnewline
30 & -0.011396 & -0.1248 & 0.450431 \tabularnewline
31 & -0.026337 & -0.2885 & 0.386728 \tabularnewline
32 & -0.03544 & -0.3882 & 0.349267 \tabularnewline
33 & 0.045947 & 0.5033 & 0.307831 \tabularnewline
34 & -0.002612 & -0.0286 & 0.488612 \tabularnewline
35 & 0.004285 & 0.0469 & 0.481322 \tabularnewline
36 & -0.032199 & -0.3527 & 0.362458 \tabularnewline
37 & -0.045079 & -0.4938 & 0.311169 \tabularnewline
38 & 0.005671 & 0.0621 & 0.475285 \tabularnewline
39 & -0.04436 & -0.4859 & 0.313948 \tabularnewline
40 & -0.028294 & -0.3099 & 0.37857 \tabularnewline
41 & 0.018548 & 0.2032 & 0.419669 \tabularnewline
42 & -0.022868 & -0.2505 & 0.401312 \tabularnewline
43 & -0.008316 & -0.0911 & 0.463782 \tabularnewline
44 & -0.02998 & -0.3284 & 0.371585 \tabularnewline
45 & 0.021622 & 0.2369 & 0.406585 \tabularnewline
46 & 0.003955 & 0.0433 & 0.482757 \tabularnewline
47 & -0.009773 & -0.1071 & 0.45746 \tabularnewline
48 & -0.030051 & -0.3292 & 0.371291 \tabularnewline
\hline
\end{tabular}
%Source: https://freestatistics.org/blog/index.php?pk=123351&T=2

[TABLE]
[ROW][C]Partial Autocorrelation Function[/C][/ROW]
[ROW][C]Time lag k[/C][C]PACF(k)[/C][C]T-STAT[/C][C]P-value[/C][/ROW]
[ROW][C]1[/C][C]0.974719[/C][C]10.6775[/C][C]0[/C][/ROW]
[ROW][C]2[/C][C]0.006368[/C][C]0.0698[/C][C]0.472253[/C][/ROW]
[ROW][C]3[/C][C]-0.063311[/C][C]-0.6935[/C][C]0.244657[/C][/ROW]
[ROW][C]4[/C][C]-0.031197[/C][C]-0.3417[/C][C]0.36657[/C][/ROW]
[ROW][C]5[/C][C]0.004157[/C][C]0.0455[/C][C]0.481876[/C][/ROW]
[ROW][C]6[/C][C]-0.011185[/C][C]-0.1225[/C][C]0.451342[/C][/ROW]
[ROW][C]7[/C][C]0.002064[/C][C]0.0226[/C][C]0.490998[/C][/ROW]
[ROW][C]8[/C][C]-0.030063[/C][C]-0.3293[/C][C]0.371244[/C][/ROW]
[ROW][C]9[/C][C]0.054815[/C][C]0.6005[/C][C]0.274664[/C][/ROW]
[ROW][C]10[/C][C]-0.010431[/C][C]-0.1143[/C][C]0.454609[/C][/ROW]
[ROW][C]11[/C][C]0.030258[/C][C]0.3315[/C][C]0.37044[/C][/ROW]
[ROW][C]12[/C][C]-0.04571[/C][C]-0.5007[/C][C]0.308739[/C][/ROW]
[ROW][C]13[/C][C]-0.080954[/C][C]-0.8868[/C][C]0.188479[/C][/ROW]
[ROW][C]14[/C][C]-0.014005[/C][C]-0.1534[/C][C]0.439162[/C][/ROW]
[ROW][C]15[/C][C]-0.049488[/C][C]-0.5421[/C][C]0.294372[/C][/ROW]
[ROW][C]16[/C][C]-0.02328[/C][C]-0.255[/C][C]0.399574[/C][/ROW]
[ROW][C]17[/C][C]0.012971[/C][C]0.1421[/C][C]0.443625[/C][/ROW]
[ROW][C]18[/C][C]-0.00874[/C][C]-0.0957[/C][C]0.461945[/C][/ROW]
[ROW][C]19[/C][C]-0.006114[/C][C]-0.067[/C][C]0.473356[/C][/ROW]
[ROW][C]20[/C][C]-0.030349[/C][C]-0.3325[/C][C]0.37006[/C][/ROW]
[ROW][C]21[/C][C]0.048357[/C][C]0.5297[/C][C]0.298642[/C][/ROW]
[ROW][C]22[/C][C]0.002178[/C][C]0.0239[/C][C]0.490502[/C][/ROW]
[ROW][C]23[/C][C]0.017362[/C][C]0.1902[/C][C]0.42474[/C][/ROW]
[ROW][C]24[/C][C]-0.043154[/C][C]-0.4727[/C][C]0.318634[/C][/ROW]
[ROW][C]25[/C][C]-0.053015[/C][C]-0.5807[/C][C]0.28125[/C][/ROW]
[ROW][C]26[/C][C]-7.7e-05[/C][C]-8e-04[/C][C]0.499664[/C][/ROW]
[ROW][C]27[/C][C]-0.046988[/C][C]-0.5147[/C][C]0.303845[/C][/ROW]
[ROW][C]28[/C][C]-0.025061[/C][C]-0.2745[/C][C]0.392076[/C][/ROW]
[ROW][C]29[/C][C]0.016522[/C][C]0.181[/C][C]0.42834[/C][/ROW]
[ROW][C]30[/C][C]-0.011396[/C][C]-0.1248[/C][C]0.450431[/C][/ROW]
[ROW][C]31[/C][C]-0.026337[/C][C]-0.2885[/C][C]0.386728[/C][/ROW]
[ROW][C]32[/C][C]-0.03544[/C][C]-0.3882[/C][C]0.349267[/C][/ROW]
[ROW][C]33[/C][C]0.045947[/C][C]0.5033[/C][C]0.307831[/C][/ROW]
[ROW][C]34[/C][C]-0.002612[/C][C]-0.0286[/C][C]0.488612[/C][/ROW]
[ROW][C]35[/C][C]0.004285[/C][C]0.0469[/C][C]0.481322[/C][/ROW]
[ROW][C]36[/C][C]-0.032199[/C][C]-0.3527[/C][C]0.362458[/C][/ROW]
[ROW][C]37[/C][C]-0.045079[/C][C]-0.4938[/C][C]0.311169[/C][/ROW]
[ROW][C]38[/C][C]0.005671[/C][C]0.0621[/C][C]0.475285[/C][/ROW]
[ROW][C]39[/C][C]-0.04436[/C][C]-0.4859[/C][C]0.313948[/C][/ROW]
[ROW][C]40[/C][C]-0.028294[/C][C]-0.3099[/C][C]0.37857[/C][/ROW]
[ROW][C]41[/C][C]0.018548[/C][C]0.2032[/C][C]0.419669[/C][/ROW]
[ROW][C]42[/C][C]-0.022868[/C][C]-0.2505[/C][C]0.401312[/C][/ROW]
[ROW][C]43[/C][C]-0.008316[/C][C]-0.0911[/C][C]0.463782[/C][/ROW]
[ROW][C]44[/C][C]-0.02998[/C][C]-0.3284[/C][C]0.371585[/C][/ROW]
[ROW][C]45[/C][C]0.021622[/C][C]0.2369[/C][C]0.406585[/C][/ROW]
[ROW][C]46[/C][C]0.003955[/C][C]0.0433[/C][C]0.482757[/C][/ROW]
[ROW][C]47[/C][C]-0.009773[/C][C]-0.1071[/C][C]0.45746[/C][/ROW]
[ROW][C]48[/C][C]-0.030051[/C][C]-0.3292[/C][C]0.371291[/C][/ROW]
[/TABLE]
Source: https://freestatistics.org/blog/index.php?pk=123351&T=2

Globally Unique Identifier (entire table): ba.freestatistics.org/blog/index.php?pk=123351&T=2

As an alternative you can also use a QR Code:  

The GUIDs for individual cells are displayed in the table below:

Partial Autocorrelation Function
Time lag kPACF(k)T-STATP-value
10.97471910.67750
20.0063680.06980.472253
3-0.063311-0.69350.244657
4-0.031197-0.34170.36657
50.0041570.04550.481876
6-0.011185-0.12250.451342
70.0020640.02260.490998
8-0.030063-0.32930.371244
90.0548150.60050.274664
10-0.010431-0.11430.454609
110.0302580.33150.37044
12-0.04571-0.50070.308739
13-0.080954-0.88680.188479
14-0.014005-0.15340.439162
15-0.049488-0.54210.294372
16-0.02328-0.2550.399574
170.0129710.14210.443625
18-0.00874-0.09570.461945
19-0.006114-0.0670.473356
20-0.030349-0.33250.37006
210.0483570.52970.298642
220.0021780.02390.490502
230.0173620.19020.42474
24-0.043154-0.47270.318634
25-0.053015-0.58070.28125
26-7.7e-05-8e-040.499664
27-0.046988-0.51470.303845
28-0.025061-0.27450.392076
290.0165220.1810.42834
30-0.011396-0.12480.450431
31-0.026337-0.28850.386728
32-0.03544-0.38820.349267
330.0459470.50330.307831
34-0.002612-0.02860.488612
350.0042850.04690.481322
36-0.032199-0.35270.362458
37-0.045079-0.49380.311169
380.0056710.06210.475285
39-0.04436-0.48590.313948
40-0.028294-0.30990.37857
410.0185480.20320.419669
42-0.022868-0.25050.401312
43-0.008316-0.09110.463782
44-0.02998-0.32840.371585
450.0216220.23690.406585
460.0039550.04330.482757
47-0.009773-0.10710.45746
48-0.030051-0.32920.371291


Parameters (Session):
par1 = 48 ; par2 = 1 ; par3 = 0 ; par4 = 0 ; par5 = 12 ; par6 = White Noise ; par7 = 0.95 ;
Parameters (R input):
par1 = 48 ; par2 = 1 ; par3 = 0 ; par4 = 0 ; par5 = 12 ; par6 = White Noise ; par7 = 0.95 ; par8 = ;
R code (references can be found in the software module):
if (par1 == 'Default') {
par1 = 10*log10(length(x))
} else {
par1 <- as.numeric(par1)
}
par2 <- as.numeric(par2)
par3 <- as.numeric(par3)
par4 <- as.numeric(par4)
par5 <- as.numeric(par5)
if (par6 == 'White Noise') par6 <- 'white' else par6 <- 'ma'
par7 <- as.numeric(par7)
if (par8 != '') par8 <- as.numeric(par8)
ox <- x
if (par8 == '') {
if (par2 == 0) {
x <- log(x)
} else {
x <- (x ^ par2 - 1) / par2
}
} else {
x <- log(x,base=par8)
}
if (par3 > 0) x <- diff(x,lag=1,difference=par3)
if (par4 > 0) x <- diff(x,lag=par5,difference=par4)
bitmap(file='picts.png')
op <- par(mfrow=c(2,1))
plot(ox,type='l',main='Original Time Series',xlab='time',ylab='value')
if (par8=='') {
mytitle <- paste('Working Time Series (lambda=',par2,', d=',par3,', D=',par4,')',sep='')
mysub <- paste('(lambda=',par2,', d=',par3,', D=',par4,', CI=', par7, ', CI type=',par6,')',sep='')
} else {
mytitle <- paste('Working Time Series (base=',par8,', d=',par3,', D=',par4,')',sep='')
mysub <- paste('(base=',par8,', d=',par3,', D=',par4,', CI=', par7, ', CI type=',par6,')',sep='')
}
plot(x,type='l', main=mytitle,xlab='time',ylab='value')
par(op)
dev.off()
bitmap(file='pic1.png')
racf <- acf(x, par1, main='Autocorrelation', xlab='time lag', ylab='ACF', ci.type=par6, ci=par7, sub=mysub)
dev.off()
bitmap(file='pic2.png')
rpacf <- pacf(x,par1,main='Partial Autocorrelation',xlab='lags',ylab='PACF',sub=mysub)
dev.off()
(myacf <- c(racf$acf))
(mypacf <- c(rpacf$acf))
lengthx <- length(x)
sqrtn <- sqrt(lengthx)
load(file='createtable')
a<-table.start()
a<-table.row.start(a)
a<-table.element(a,'Autocorrelation Function',4,TRUE)
a<-table.row.end(a)
a<-table.row.start(a)
a<-table.element(a,'Time lag k',header=TRUE)
a<-table.element(a,hyperlink('basics.htm','ACF(k)','click here for more information about the Autocorrelation Function'),header=TRUE)
a<-table.element(a,'T-STAT',header=TRUE)
a<-table.element(a,'P-value',header=TRUE)
a<-table.row.end(a)
for (i in 2:(par1+1)) {
a<-table.row.start(a)
a<-table.element(a,i-1,header=TRUE)
a<-table.element(a,round(myacf[i],6))
mytstat <- myacf[i]*sqrtn
a<-table.element(a,round(mytstat,4))
a<-table.element(a,round(1-pt(abs(mytstat),lengthx),6))
a<-table.row.end(a)
}
a<-table.end(a)
table.save(a,file='mytable.tab')
a<-table.start()
a<-table.row.start(a)
a<-table.element(a,'Partial Autocorrelation Function',4,TRUE)
a<-table.row.end(a)
a<-table.row.start(a)
a<-table.element(a,'Time lag k',header=TRUE)
a<-table.element(a,hyperlink('basics.htm','PACF(k)','click here for more information about the Partial Autocorrelation Function'),header=TRUE)
a<-table.element(a,'T-STAT',header=TRUE)
a<-table.element(a,'P-value',header=TRUE)
a<-table.row.end(a)
for (i in 1:par1) {
a<-table.row.start(a)
a<-table.element(a,i,header=TRUE)
a<-table.element(a,round(mypacf[i],6))
mytstat <- mypacf[i]*sqrtn
a<-table.element(a,round(mytstat,4))
a<-table.element(a,round(1-pt(abs(mytstat),lengthx),6))
a<-table.row.end(a)
}
a<-table.end(a)
table.save(a,file='mytable1.tab')