Free Statistics

of Irreproducible Research!

Author's title

Author*Unverified author*
R Software Modulerwasp_autocorrelation.wasp
Title produced by software(Partial) Autocorrelation Function
Date of computationWed, 03 Aug 2011 10:03:06 -0400
Cite this page as followsStatistical Computations at FreeStatistics.org, Office for Research Development and Education, URL https://freestatistics.org/blog/index.php?v=date/2011/Aug/03/t1312380239bll4322c0jzu0ev.htm/, Retrieved Tue, 14 May 2024 23:22:08 +0000
Statistical Computations at FreeStatistics.org, Office for Research Development and Education, URL https://freestatistics.org/blog/index.php?pk=123342, Retrieved Tue, 14 May 2024 23:22:08 +0000
QR Codes:

Original text written by user:
IsPrivate?No (this computation is public)
User-defined keywordsVan Laer Axel
Estimated Impact162
Family? (F = Feedback message, R = changed R code, M = changed R Module, P = changed Parameters, D = changed Data)
-       [(Partial) Autocorrelation Function] [Cijferreeks B, St...] [2011-08-03 14:03:06] [3bbb4c38423daa916cf90d93c467bd86] [Current]
Feedback Forum

Post a new message
Dataseries X:
1220
1250
1350
1380
1310
1350
1360
1230
1330
1330
1380
1340
1220
1230
1400
1320
1320
1380
1340
1220
1310
1280
1330
1350
1240
1260
1340
1270
1330
1440
1350
1220
1310
1350
1300
1410
1260
1210
1410
1240
1360
1420
1310
1360
1260
1410
1330
1400
1240
1280
1460
1250
1340
1440
1170
1420
1250
1390
1260
1390
1290
1310
1540
1250
1320
1430
1080
1370
1290
1380
1260
1400
1250
1290
1550
1200
1320
1500
1060
1220
1260
1270
1280
1350
1320
1350
1530
1150
1270
1460
1000
1290
1330
1180
1350
1300
1350
1350
1540
1180
1280
1520
960
1420
1370
1210
1320
1260


Summary of computational transaction
Raw Inputview raw input (R code)
Raw Outputview raw output of R engine
Computing time1 seconds
R Server'Gertrude Mary Cox' @ cox.wessa.net

\begin{tabular}{lllllllll}
\hline
Summary of computational transaction \tabularnewline
Raw Input & view raw input (R code)  \tabularnewline
Raw Output & view raw output of R engine  \tabularnewline
Computing time & 1 seconds \tabularnewline
R Server & 'Gertrude Mary Cox' @ cox.wessa.net \tabularnewline
\hline
\end{tabular}
%Source: https://freestatistics.org/blog/index.php?pk=123342&T=0

[TABLE]
[ROW][C]Summary of computational transaction[/C][/ROW]
[ROW][C]Raw Input[/C][C]view raw input (R code) [/C][/ROW]
[ROW][C]Raw Output[/C][C]view raw output of R engine [/C][/ROW]
[ROW][C]Computing time[/C][C]1 seconds[/C][/ROW]
[ROW][C]R Server[/C][C]'Gertrude Mary Cox' @ cox.wessa.net[/C][/ROW]
[/TABLE]
Source: https://freestatistics.org/blog/index.php?pk=123342&T=0

Globally Unique Identifier (entire table): ba.freestatistics.org/blog/index.php?pk=123342&T=0

As an alternative you can also use a QR Code:  

The GUIDs for individual cells are displayed in the table below:

Summary of computational transaction
Raw Inputview raw input (R code)
Raw Outputview raw output of R engine
Computing time1 seconds
R Server'Gertrude Mary Cox' @ cox.wessa.net


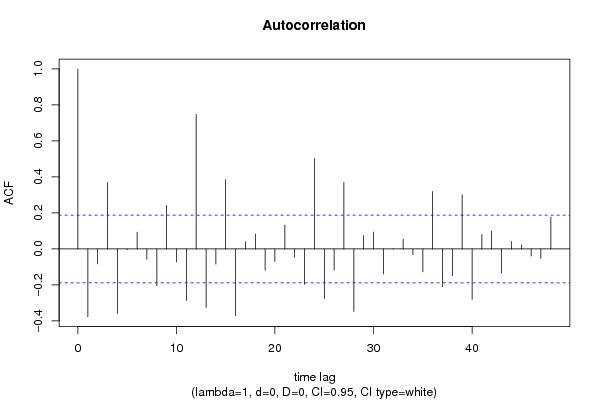
Autocorrelation Function
Time lag kACF(k)T-STATP-value
1-0.375907-3.90658.2e-05
2-0.08196-0.85180.198118
30.3697393.84240.000103
4-0.358641-3.72710.000155
5-0.003331-0.03460.486223
60.0926450.96280.168902
7-0.057291-0.59540.276414
8-0.203669-2.11660.018296
90.2416542.51130.006754
10-0.072559-0.75410.22623
11-0.286266-2.9750.001808
120.7470547.76360
13-0.324899-3.37650.000511
14-0.084174-0.87480.191823
150.3853924.00515.7e-05
16-0.369895-3.84410.000102
170.0393630.40910.341647
180.0835440.86820.193601
19-0.11826-1.2290.110872
20-0.069271-0.71990.236574
210.1333951.38630.084259
22-0.044958-0.46720.320642
23-0.195627-2.0330.022252
240.5028785.22610
25-0.275249-2.86050.00254
26-0.117169-1.21770.113004
270.3693073.83790.000105
28-0.346731-3.60330.000238
290.0743480.77260.220709
300.0937980.97480.165925
31-0.139287-1.44750.075325
320.0013720.01430.494327
330.05380.55910.288623
34-0.032446-0.33720.368314
35-0.126502-1.31460.095707
360.3194393.31970.000615
37-0.20987-2.1810.015675
38-0.148533-1.54360.062806
390.3011193.12930.001127
40-0.279901-2.90880.002203
410.0803990.83550.202631
420.0997581.03670.151092
43-0.133689-1.38930.083795
440.0418450.43490.332263
450.0221370.23010.409242
46-0.038951-0.40480.343218
47-0.052407-0.54460.293566
480.1776111.84580.033831

\begin{tabular}{lllllllll}
\hline
Autocorrelation Function \tabularnewline
Time lag k & ACF(k) & T-STAT & P-value \tabularnewline
1 & -0.375907 & -3.9065 & 8.2e-05 \tabularnewline
2 & -0.08196 & -0.8518 & 0.198118 \tabularnewline
3 & 0.369739 & 3.8424 & 0.000103 \tabularnewline
4 & -0.358641 & -3.7271 & 0.000155 \tabularnewline
5 & -0.003331 & -0.0346 & 0.486223 \tabularnewline
6 & 0.092645 & 0.9628 & 0.168902 \tabularnewline
7 & -0.057291 & -0.5954 & 0.276414 \tabularnewline
8 & -0.203669 & -2.1166 & 0.018296 \tabularnewline
9 & 0.241654 & 2.5113 & 0.006754 \tabularnewline
10 & -0.072559 & -0.7541 & 0.22623 \tabularnewline
11 & -0.286266 & -2.975 & 0.001808 \tabularnewline
12 & 0.747054 & 7.7636 & 0 \tabularnewline
13 & -0.324899 & -3.3765 & 0.000511 \tabularnewline
14 & -0.084174 & -0.8748 & 0.191823 \tabularnewline
15 & 0.385392 & 4.0051 & 5.7e-05 \tabularnewline
16 & -0.369895 & -3.8441 & 0.000102 \tabularnewline
17 & 0.039363 & 0.4091 & 0.341647 \tabularnewline
18 & 0.083544 & 0.8682 & 0.193601 \tabularnewline
19 & -0.11826 & -1.229 & 0.110872 \tabularnewline
20 & -0.069271 & -0.7199 & 0.236574 \tabularnewline
21 & 0.133395 & 1.3863 & 0.084259 \tabularnewline
22 & -0.044958 & -0.4672 & 0.320642 \tabularnewline
23 & -0.195627 & -2.033 & 0.022252 \tabularnewline
24 & 0.502878 & 5.2261 & 0 \tabularnewline
25 & -0.275249 & -2.8605 & 0.00254 \tabularnewline
26 & -0.117169 & -1.2177 & 0.113004 \tabularnewline
27 & 0.369307 & 3.8379 & 0.000105 \tabularnewline
28 & -0.346731 & -3.6033 & 0.000238 \tabularnewline
29 & 0.074348 & 0.7726 & 0.220709 \tabularnewline
30 & 0.093798 & 0.9748 & 0.165925 \tabularnewline
31 & -0.139287 & -1.4475 & 0.075325 \tabularnewline
32 & 0.001372 & 0.0143 & 0.494327 \tabularnewline
33 & 0.0538 & 0.5591 & 0.288623 \tabularnewline
34 & -0.032446 & -0.3372 & 0.368314 \tabularnewline
35 & -0.126502 & -1.3146 & 0.095707 \tabularnewline
36 & 0.319439 & 3.3197 & 0.000615 \tabularnewline
37 & -0.20987 & -2.181 & 0.015675 \tabularnewline
38 & -0.148533 & -1.5436 & 0.062806 \tabularnewline
39 & 0.301119 & 3.1293 & 0.001127 \tabularnewline
40 & -0.279901 & -2.9088 & 0.002203 \tabularnewline
41 & 0.080399 & 0.8355 & 0.202631 \tabularnewline
42 & 0.099758 & 1.0367 & 0.151092 \tabularnewline
43 & -0.133689 & -1.3893 & 0.083795 \tabularnewline
44 & 0.041845 & 0.4349 & 0.332263 \tabularnewline
45 & 0.022137 & 0.2301 & 0.409242 \tabularnewline
46 & -0.038951 & -0.4048 & 0.343218 \tabularnewline
47 & -0.052407 & -0.5446 & 0.293566 \tabularnewline
48 & 0.177611 & 1.8458 & 0.033831 \tabularnewline
\hline
\end{tabular}
%Source: https://freestatistics.org/blog/index.php?pk=123342&T=1

[TABLE]
[ROW][C]Autocorrelation Function[/C][/ROW]
[ROW][C]Time lag k[/C][C]ACF(k)[/C][C]T-STAT[/C][C]P-value[/C][/ROW]
[ROW][C]1[/C][C]-0.375907[/C][C]-3.9065[/C][C]8.2e-05[/C][/ROW]
[ROW][C]2[/C][C]-0.08196[/C][C]-0.8518[/C][C]0.198118[/C][/ROW]
[ROW][C]3[/C][C]0.369739[/C][C]3.8424[/C][C]0.000103[/C][/ROW]
[ROW][C]4[/C][C]-0.358641[/C][C]-3.7271[/C][C]0.000155[/C][/ROW]
[ROW][C]5[/C][C]-0.003331[/C][C]-0.0346[/C][C]0.486223[/C][/ROW]
[ROW][C]6[/C][C]0.092645[/C][C]0.9628[/C][C]0.168902[/C][/ROW]
[ROW][C]7[/C][C]-0.057291[/C][C]-0.5954[/C][C]0.276414[/C][/ROW]
[ROW][C]8[/C][C]-0.203669[/C][C]-2.1166[/C][C]0.018296[/C][/ROW]
[ROW][C]9[/C][C]0.241654[/C][C]2.5113[/C][C]0.006754[/C][/ROW]
[ROW][C]10[/C][C]-0.072559[/C][C]-0.7541[/C][C]0.22623[/C][/ROW]
[ROW][C]11[/C][C]-0.286266[/C][C]-2.975[/C][C]0.001808[/C][/ROW]
[ROW][C]12[/C][C]0.747054[/C][C]7.7636[/C][C]0[/C][/ROW]
[ROW][C]13[/C][C]-0.324899[/C][C]-3.3765[/C][C]0.000511[/C][/ROW]
[ROW][C]14[/C][C]-0.084174[/C][C]-0.8748[/C][C]0.191823[/C][/ROW]
[ROW][C]15[/C][C]0.385392[/C][C]4.0051[/C][C]5.7e-05[/C][/ROW]
[ROW][C]16[/C][C]-0.369895[/C][C]-3.8441[/C][C]0.000102[/C][/ROW]
[ROW][C]17[/C][C]0.039363[/C][C]0.4091[/C][C]0.341647[/C][/ROW]
[ROW][C]18[/C][C]0.083544[/C][C]0.8682[/C][C]0.193601[/C][/ROW]
[ROW][C]19[/C][C]-0.11826[/C][C]-1.229[/C][C]0.110872[/C][/ROW]
[ROW][C]20[/C][C]-0.069271[/C][C]-0.7199[/C][C]0.236574[/C][/ROW]
[ROW][C]21[/C][C]0.133395[/C][C]1.3863[/C][C]0.084259[/C][/ROW]
[ROW][C]22[/C][C]-0.044958[/C][C]-0.4672[/C][C]0.320642[/C][/ROW]
[ROW][C]23[/C][C]-0.195627[/C][C]-2.033[/C][C]0.022252[/C][/ROW]
[ROW][C]24[/C][C]0.502878[/C][C]5.2261[/C][C]0[/C][/ROW]
[ROW][C]25[/C][C]-0.275249[/C][C]-2.8605[/C][C]0.00254[/C][/ROW]
[ROW][C]26[/C][C]-0.117169[/C][C]-1.2177[/C][C]0.113004[/C][/ROW]
[ROW][C]27[/C][C]0.369307[/C][C]3.8379[/C][C]0.000105[/C][/ROW]
[ROW][C]28[/C][C]-0.346731[/C][C]-3.6033[/C][C]0.000238[/C][/ROW]
[ROW][C]29[/C][C]0.074348[/C][C]0.7726[/C][C]0.220709[/C][/ROW]
[ROW][C]30[/C][C]0.093798[/C][C]0.9748[/C][C]0.165925[/C][/ROW]
[ROW][C]31[/C][C]-0.139287[/C][C]-1.4475[/C][C]0.075325[/C][/ROW]
[ROW][C]32[/C][C]0.001372[/C][C]0.0143[/C][C]0.494327[/C][/ROW]
[ROW][C]33[/C][C]0.0538[/C][C]0.5591[/C][C]0.288623[/C][/ROW]
[ROW][C]34[/C][C]-0.032446[/C][C]-0.3372[/C][C]0.368314[/C][/ROW]
[ROW][C]35[/C][C]-0.126502[/C][C]-1.3146[/C][C]0.095707[/C][/ROW]
[ROW][C]36[/C][C]0.319439[/C][C]3.3197[/C][C]0.000615[/C][/ROW]
[ROW][C]37[/C][C]-0.20987[/C][C]-2.181[/C][C]0.015675[/C][/ROW]
[ROW][C]38[/C][C]-0.148533[/C][C]-1.5436[/C][C]0.062806[/C][/ROW]
[ROW][C]39[/C][C]0.301119[/C][C]3.1293[/C][C]0.001127[/C][/ROW]
[ROW][C]40[/C][C]-0.279901[/C][C]-2.9088[/C][C]0.002203[/C][/ROW]
[ROW][C]41[/C][C]0.080399[/C][C]0.8355[/C][C]0.202631[/C][/ROW]
[ROW][C]42[/C][C]0.099758[/C][C]1.0367[/C][C]0.151092[/C][/ROW]
[ROW][C]43[/C][C]-0.133689[/C][C]-1.3893[/C][C]0.083795[/C][/ROW]
[ROW][C]44[/C][C]0.041845[/C][C]0.4349[/C][C]0.332263[/C][/ROW]
[ROW][C]45[/C][C]0.022137[/C][C]0.2301[/C][C]0.409242[/C][/ROW]
[ROW][C]46[/C][C]-0.038951[/C][C]-0.4048[/C][C]0.343218[/C][/ROW]
[ROW][C]47[/C][C]-0.052407[/C][C]-0.5446[/C][C]0.293566[/C][/ROW]
[ROW][C]48[/C][C]0.177611[/C][C]1.8458[/C][C]0.033831[/C][/ROW]
[/TABLE]
Source: https://freestatistics.org/blog/index.php?pk=123342&T=1

Globally Unique Identifier (entire table): ba.freestatistics.org/blog/index.php?pk=123342&T=1

As an alternative you can also use a QR Code:  

The GUIDs for individual cells are displayed in the table below:

Autocorrelation Function
Time lag kACF(k)T-STATP-value
1-0.375907-3.90658.2e-05
2-0.08196-0.85180.198118
30.3697393.84240.000103
4-0.358641-3.72710.000155
5-0.003331-0.03460.486223
60.0926450.96280.168902
7-0.057291-0.59540.276414
8-0.203669-2.11660.018296
90.2416542.51130.006754
10-0.072559-0.75410.22623
11-0.286266-2.9750.001808
120.7470547.76360
13-0.324899-3.37650.000511
14-0.084174-0.87480.191823
150.3853924.00515.7e-05
16-0.369895-3.84410.000102
170.0393630.40910.341647
180.0835440.86820.193601
19-0.11826-1.2290.110872
20-0.069271-0.71990.236574
210.1333951.38630.084259
22-0.044958-0.46720.320642
23-0.195627-2.0330.022252
240.5028785.22610
25-0.275249-2.86050.00254
26-0.117169-1.21770.113004
270.3693073.83790.000105
28-0.346731-3.60330.000238
290.0743480.77260.220709
300.0937980.97480.165925
31-0.139287-1.44750.075325
320.0013720.01430.494327
330.05380.55910.288623
34-0.032446-0.33720.368314
35-0.126502-1.31460.095707
360.3194393.31970.000615
37-0.20987-2.1810.015675
38-0.148533-1.54360.062806
390.3011193.12930.001127
40-0.279901-2.90880.002203
410.0803990.83550.202631
420.0997581.03670.151092
43-0.133689-1.38930.083795
440.0418450.43490.332263
450.0221370.23010.409242
46-0.038951-0.40480.343218
47-0.052407-0.54460.293566
480.1776111.84580.033831


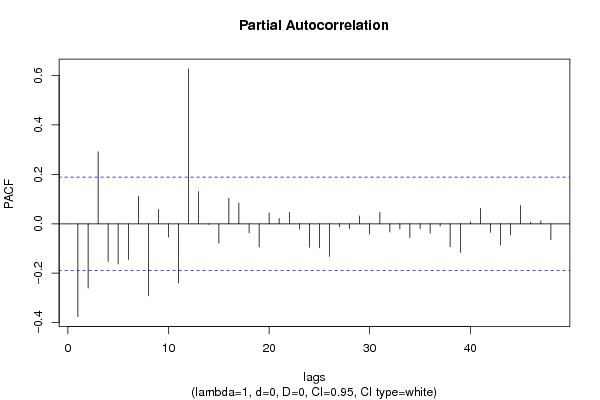
Partial Autocorrelation Function
Time lag kPACF(k)T-STATP-value
1-0.375907-3.90658.2e-05
2-0.260007-2.70210.004002
30.2912413.02670.001546
4-0.152905-1.5890.057488
5-0.162988-1.69380.046591
6-0.14477-1.50450.067686
70.1110861.15440.125434
8-0.291722-3.03170.001523
90.0576840.59950.275057
10-0.053392-0.55490.290067
11-0.239217-2.4860.007225
120.6265716.51150
130.130571.35690.088817
14-0.002515-0.02610.4896
15-0.078349-0.81420.208655
160.1034791.07540.1423
170.0836530.86930.193294
18-0.037722-0.3920.347909
19-0.094224-0.97920.164834
200.0434530.45160.326239
210.0215250.22370.41171
220.0468780.48720.313562
23-0.021125-0.21950.413322
24-0.095372-0.99110.161918
25-0.096892-1.00690.158109
26-0.131419-1.36580.087427
27-0.01227-0.12750.449386
28-0.019227-0.19980.421
290.0313510.32580.3726
30-0.04129-0.42910.334354
310.0458110.47610.31749
32-0.033488-0.3480.364252
33-0.019872-0.20650.418389
34-0.055272-0.57440.283446
35-0.019465-0.20230.420036
36-0.03786-0.39350.347379
37-0.009339-0.09710.461433
38-0.092867-0.96510.168326
39-0.116162-1.20720.114997
400.0083670.0870.465436
410.0618740.6430.260791
42-0.034617-0.35970.359869
43-0.085851-0.89220.187137
44-0.044861-0.46620.321002
450.0738290.76720.222304
460.0060290.06270.475078
470.0118360.1230.451165
48-0.064532-0.67060.251942

\begin{tabular}{lllllllll}
\hline
Partial Autocorrelation Function \tabularnewline
Time lag k & PACF(k) & T-STAT & P-value \tabularnewline
1 & -0.375907 & -3.9065 & 8.2e-05 \tabularnewline
2 & -0.260007 & -2.7021 & 0.004002 \tabularnewline
3 & 0.291241 & 3.0267 & 0.001546 \tabularnewline
4 & -0.152905 & -1.589 & 0.057488 \tabularnewline
5 & -0.162988 & -1.6938 & 0.046591 \tabularnewline
6 & -0.14477 & -1.5045 & 0.067686 \tabularnewline
7 & 0.111086 & 1.1544 & 0.125434 \tabularnewline
8 & -0.291722 & -3.0317 & 0.001523 \tabularnewline
9 & 0.057684 & 0.5995 & 0.275057 \tabularnewline
10 & -0.053392 & -0.5549 & 0.290067 \tabularnewline
11 & -0.239217 & -2.486 & 0.007225 \tabularnewline
12 & 0.626571 & 6.5115 & 0 \tabularnewline
13 & 0.13057 & 1.3569 & 0.088817 \tabularnewline
14 & -0.002515 & -0.0261 & 0.4896 \tabularnewline
15 & -0.078349 & -0.8142 & 0.208655 \tabularnewline
16 & 0.103479 & 1.0754 & 0.1423 \tabularnewline
17 & 0.083653 & 0.8693 & 0.193294 \tabularnewline
18 & -0.037722 & -0.392 & 0.347909 \tabularnewline
19 & -0.094224 & -0.9792 & 0.164834 \tabularnewline
20 & 0.043453 & 0.4516 & 0.326239 \tabularnewline
21 & 0.021525 & 0.2237 & 0.41171 \tabularnewline
22 & 0.046878 & 0.4872 & 0.313562 \tabularnewline
23 & -0.021125 & -0.2195 & 0.413322 \tabularnewline
24 & -0.095372 & -0.9911 & 0.161918 \tabularnewline
25 & -0.096892 & -1.0069 & 0.158109 \tabularnewline
26 & -0.131419 & -1.3658 & 0.087427 \tabularnewline
27 & -0.01227 & -0.1275 & 0.449386 \tabularnewline
28 & -0.019227 & -0.1998 & 0.421 \tabularnewline
29 & 0.031351 & 0.3258 & 0.3726 \tabularnewline
30 & -0.04129 & -0.4291 & 0.334354 \tabularnewline
31 & 0.045811 & 0.4761 & 0.31749 \tabularnewline
32 & -0.033488 & -0.348 & 0.364252 \tabularnewline
33 & -0.019872 & -0.2065 & 0.418389 \tabularnewline
34 & -0.055272 & -0.5744 & 0.283446 \tabularnewline
35 & -0.019465 & -0.2023 & 0.420036 \tabularnewline
36 & -0.03786 & -0.3935 & 0.347379 \tabularnewline
37 & -0.009339 & -0.0971 & 0.461433 \tabularnewline
38 & -0.092867 & -0.9651 & 0.168326 \tabularnewline
39 & -0.116162 & -1.2072 & 0.114997 \tabularnewline
40 & 0.008367 & 0.087 & 0.465436 \tabularnewline
41 & 0.061874 & 0.643 & 0.260791 \tabularnewline
42 & -0.034617 & -0.3597 & 0.359869 \tabularnewline
43 & -0.085851 & -0.8922 & 0.187137 \tabularnewline
44 & -0.044861 & -0.4662 & 0.321002 \tabularnewline
45 & 0.073829 & 0.7672 & 0.222304 \tabularnewline
46 & 0.006029 & 0.0627 & 0.475078 \tabularnewline
47 & 0.011836 & 0.123 & 0.451165 \tabularnewline
48 & -0.064532 & -0.6706 & 0.251942 \tabularnewline
\hline
\end{tabular}
%Source: https://freestatistics.org/blog/index.php?pk=123342&T=2

[TABLE]
[ROW][C]Partial Autocorrelation Function[/C][/ROW]
[ROW][C]Time lag k[/C][C]PACF(k)[/C][C]T-STAT[/C][C]P-value[/C][/ROW]
[ROW][C]1[/C][C]-0.375907[/C][C]-3.9065[/C][C]8.2e-05[/C][/ROW]
[ROW][C]2[/C][C]-0.260007[/C][C]-2.7021[/C][C]0.004002[/C][/ROW]
[ROW][C]3[/C][C]0.291241[/C][C]3.0267[/C][C]0.001546[/C][/ROW]
[ROW][C]4[/C][C]-0.152905[/C][C]-1.589[/C][C]0.057488[/C][/ROW]
[ROW][C]5[/C][C]-0.162988[/C][C]-1.6938[/C][C]0.046591[/C][/ROW]
[ROW][C]6[/C][C]-0.14477[/C][C]-1.5045[/C][C]0.067686[/C][/ROW]
[ROW][C]7[/C][C]0.111086[/C][C]1.1544[/C][C]0.125434[/C][/ROW]
[ROW][C]8[/C][C]-0.291722[/C][C]-3.0317[/C][C]0.001523[/C][/ROW]
[ROW][C]9[/C][C]0.057684[/C][C]0.5995[/C][C]0.275057[/C][/ROW]
[ROW][C]10[/C][C]-0.053392[/C][C]-0.5549[/C][C]0.290067[/C][/ROW]
[ROW][C]11[/C][C]-0.239217[/C][C]-2.486[/C][C]0.007225[/C][/ROW]
[ROW][C]12[/C][C]0.626571[/C][C]6.5115[/C][C]0[/C][/ROW]
[ROW][C]13[/C][C]0.13057[/C][C]1.3569[/C][C]0.088817[/C][/ROW]
[ROW][C]14[/C][C]-0.002515[/C][C]-0.0261[/C][C]0.4896[/C][/ROW]
[ROW][C]15[/C][C]-0.078349[/C][C]-0.8142[/C][C]0.208655[/C][/ROW]
[ROW][C]16[/C][C]0.103479[/C][C]1.0754[/C][C]0.1423[/C][/ROW]
[ROW][C]17[/C][C]0.083653[/C][C]0.8693[/C][C]0.193294[/C][/ROW]
[ROW][C]18[/C][C]-0.037722[/C][C]-0.392[/C][C]0.347909[/C][/ROW]
[ROW][C]19[/C][C]-0.094224[/C][C]-0.9792[/C][C]0.164834[/C][/ROW]
[ROW][C]20[/C][C]0.043453[/C][C]0.4516[/C][C]0.326239[/C][/ROW]
[ROW][C]21[/C][C]0.021525[/C][C]0.2237[/C][C]0.41171[/C][/ROW]
[ROW][C]22[/C][C]0.046878[/C][C]0.4872[/C][C]0.313562[/C][/ROW]
[ROW][C]23[/C][C]-0.021125[/C][C]-0.2195[/C][C]0.413322[/C][/ROW]
[ROW][C]24[/C][C]-0.095372[/C][C]-0.9911[/C][C]0.161918[/C][/ROW]
[ROW][C]25[/C][C]-0.096892[/C][C]-1.0069[/C][C]0.158109[/C][/ROW]
[ROW][C]26[/C][C]-0.131419[/C][C]-1.3658[/C][C]0.087427[/C][/ROW]
[ROW][C]27[/C][C]-0.01227[/C][C]-0.1275[/C][C]0.449386[/C][/ROW]
[ROW][C]28[/C][C]-0.019227[/C][C]-0.1998[/C][C]0.421[/C][/ROW]
[ROW][C]29[/C][C]0.031351[/C][C]0.3258[/C][C]0.3726[/C][/ROW]
[ROW][C]30[/C][C]-0.04129[/C][C]-0.4291[/C][C]0.334354[/C][/ROW]
[ROW][C]31[/C][C]0.045811[/C][C]0.4761[/C][C]0.31749[/C][/ROW]
[ROW][C]32[/C][C]-0.033488[/C][C]-0.348[/C][C]0.364252[/C][/ROW]
[ROW][C]33[/C][C]-0.019872[/C][C]-0.2065[/C][C]0.418389[/C][/ROW]
[ROW][C]34[/C][C]-0.055272[/C][C]-0.5744[/C][C]0.283446[/C][/ROW]
[ROW][C]35[/C][C]-0.019465[/C][C]-0.2023[/C][C]0.420036[/C][/ROW]
[ROW][C]36[/C][C]-0.03786[/C][C]-0.3935[/C][C]0.347379[/C][/ROW]
[ROW][C]37[/C][C]-0.009339[/C][C]-0.0971[/C][C]0.461433[/C][/ROW]
[ROW][C]38[/C][C]-0.092867[/C][C]-0.9651[/C][C]0.168326[/C][/ROW]
[ROW][C]39[/C][C]-0.116162[/C][C]-1.2072[/C][C]0.114997[/C][/ROW]
[ROW][C]40[/C][C]0.008367[/C][C]0.087[/C][C]0.465436[/C][/ROW]
[ROW][C]41[/C][C]0.061874[/C][C]0.643[/C][C]0.260791[/C][/ROW]
[ROW][C]42[/C][C]-0.034617[/C][C]-0.3597[/C][C]0.359869[/C][/ROW]
[ROW][C]43[/C][C]-0.085851[/C][C]-0.8922[/C][C]0.187137[/C][/ROW]
[ROW][C]44[/C][C]-0.044861[/C][C]-0.4662[/C][C]0.321002[/C][/ROW]
[ROW][C]45[/C][C]0.073829[/C][C]0.7672[/C][C]0.222304[/C][/ROW]
[ROW][C]46[/C][C]0.006029[/C][C]0.0627[/C][C]0.475078[/C][/ROW]
[ROW][C]47[/C][C]0.011836[/C][C]0.123[/C][C]0.451165[/C][/ROW]
[ROW][C]48[/C][C]-0.064532[/C][C]-0.6706[/C][C]0.251942[/C][/ROW]
[/TABLE]
Source: https://freestatistics.org/blog/index.php?pk=123342&T=2

Globally Unique Identifier (entire table): ba.freestatistics.org/blog/index.php?pk=123342&T=2

As an alternative you can also use a QR Code:  

The GUIDs for individual cells are displayed in the table below:

Partial Autocorrelation Function
Time lag kPACF(k)T-STATP-value
1-0.375907-3.90658.2e-05
2-0.260007-2.70210.004002
30.2912413.02670.001546
4-0.152905-1.5890.057488
5-0.162988-1.69380.046591
6-0.14477-1.50450.067686
70.1110861.15440.125434
8-0.291722-3.03170.001523
90.0576840.59950.275057
10-0.053392-0.55490.290067
11-0.239217-2.4860.007225
120.6265716.51150
130.130571.35690.088817
14-0.002515-0.02610.4896
15-0.078349-0.81420.208655
160.1034791.07540.1423
170.0836530.86930.193294
18-0.037722-0.3920.347909
19-0.094224-0.97920.164834
200.0434530.45160.326239
210.0215250.22370.41171
220.0468780.48720.313562
23-0.021125-0.21950.413322
24-0.095372-0.99110.161918
25-0.096892-1.00690.158109
26-0.131419-1.36580.087427
27-0.01227-0.12750.449386
28-0.019227-0.19980.421
290.0313510.32580.3726
30-0.04129-0.42910.334354
310.0458110.47610.31749
32-0.033488-0.3480.364252
33-0.019872-0.20650.418389
34-0.055272-0.57440.283446
35-0.019465-0.20230.420036
36-0.03786-0.39350.347379
37-0.009339-0.09710.461433
38-0.092867-0.96510.168326
39-0.116162-1.20720.114997
400.0083670.0870.465436
410.0618740.6430.260791
42-0.034617-0.35970.359869
43-0.085851-0.89220.187137
44-0.044861-0.46620.321002
450.0738290.76720.222304
460.0060290.06270.475078
470.0118360.1230.451165
48-0.064532-0.67060.251942


Parameters (Session):
Parameters (R input):
par1 = 48 ; par2 = 1 ; par3 = 0 ; par4 = 0 ; par5 = 12 ; par6 = White Noise ; par7 = 0.95 ; par8 = ;
R code (references can be found in the software module):
if (par1 == 'Default') {
par1 = 10*log10(length(x))
} else {
par1 <- as.numeric(par1)
}
par2 <- as.numeric(par2)
par3 <- as.numeric(par3)
par4 <- as.numeric(par4)
par5 <- as.numeric(par5)
if (par6 == 'White Noise') par6 <- 'white' else par6 <- 'ma'
par7 <- as.numeric(par7)
if (par8 != '') par8 <- as.numeric(par8)
ox <- x
if (par8 == '') {
if (par2 == 0) {
x <- log(x)
} else {
x <- (x ^ par2 - 1) / par2
}
} else {
x <- log(x,base=par8)
}
if (par3 > 0) x <- diff(x,lag=1,difference=par3)
if (par4 > 0) x <- diff(x,lag=par5,difference=par4)
bitmap(file='picts.png')
op <- par(mfrow=c(2,1))
plot(ox,type='l',main='Original Time Series',xlab='time',ylab='value')
if (par8=='') {
mytitle <- paste('Working Time Series (lambda=',par2,', d=',par3,', D=',par4,')',sep='')
mysub <- paste('(lambda=',par2,', d=',par3,', D=',par4,', CI=', par7, ', CI type=',par6,')',sep='')
} else {
mytitle <- paste('Working Time Series (base=',par8,', d=',par3,', D=',par4,')',sep='')
mysub <- paste('(base=',par8,', d=',par3,', D=',par4,', CI=', par7, ', CI type=',par6,')',sep='')
}
plot(x,type='l', main=mytitle,xlab='time',ylab='value')
par(op)
dev.off()
bitmap(file='pic1.png')
racf <- acf(x, par1, main='Autocorrelation', xlab='time lag', ylab='ACF', ci.type=par6, ci=par7, sub=mysub)
dev.off()
bitmap(file='pic2.png')
rpacf <- pacf(x,par1,main='Partial Autocorrelation',xlab='lags',ylab='PACF',sub=mysub)
dev.off()
(myacf <- c(racf$acf))
(mypacf <- c(rpacf$acf))
lengthx <- length(x)
sqrtn <- sqrt(lengthx)
load(file='createtable')
a<-table.start()
a<-table.row.start(a)
a<-table.element(a,'Autocorrelation Function',4,TRUE)
a<-table.row.end(a)
a<-table.row.start(a)
a<-table.element(a,'Time lag k',header=TRUE)
a<-table.element(a,hyperlink('basics.htm','ACF(k)','click here for more information about the Autocorrelation Function'),header=TRUE)
a<-table.element(a,'T-STAT',header=TRUE)
a<-table.element(a,'P-value',header=TRUE)
a<-table.row.end(a)
for (i in 2:(par1+1)) {
a<-table.row.start(a)
a<-table.element(a,i-1,header=TRUE)
a<-table.element(a,round(myacf[i],6))
mytstat <- myacf[i]*sqrtn
a<-table.element(a,round(mytstat,4))
a<-table.element(a,round(1-pt(abs(mytstat),lengthx),6))
a<-table.row.end(a)
}
a<-table.end(a)
table.save(a,file='mytable.tab')
a<-table.start()
a<-table.row.start(a)
a<-table.element(a,'Partial Autocorrelation Function',4,TRUE)
a<-table.row.end(a)
a<-table.row.start(a)
a<-table.element(a,'Time lag k',header=TRUE)
a<-table.element(a,hyperlink('basics.htm','PACF(k)','click here for more information about the Partial Autocorrelation Function'),header=TRUE)
a<-table.element(a,'T-STAT',header=TRUE)
a<-table.element(a,'P-value',header=TRUE)
a<-table.row.end(a)
for (i in 1:par1) {
a<-table.row.start(a)
a<-table.element(a,i,header=TRUE)
a<-table.element(a,round(mypacf[i],6))
mytstat <- mypacf[i]*sqrtn
a<-table.element(a,round(mytstat,4))
a<-table.element(a,round(1-pt(abs(mytstat),lengthx),6))
a<-table.row.end(a)
}
a<-table.end(a)
table.save(a,file='mytable1.tab')