Free Statistics

of Irreproducible Research!

Author's title

Author*Unverified author*
R Software Modulerwasp_smp.wasp
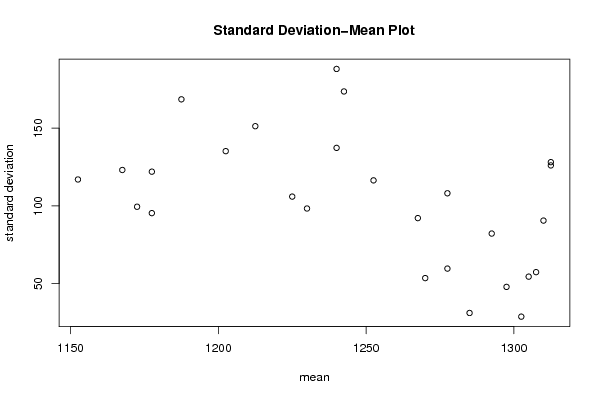
Title produced by softwareStandard Deviation-Mean Plot
Date of computationWed, 03 Aug 2011 08:22:35 -0400
Cite this page as followsStatistical Computations at FreeStatistics.org, Office for Research Development and Education, URL https://freestatistics.org/blog/index.php?v=date/2011/Aug/03/t1312374206purz7b4noojzl5i.htm/, Retrieved Tue, 14 May 2024 03:42:47 +0000
Statistical Computations at FreeStatistics.org, Office for Research Development and Education, URL https://freestatistics.org/blog/index.php?pk=123323, Retrieved Tue, 14 May 2024 03:42:47 +0000
QR Codes:

Original text written by user:
IsPrivate?No (this computation is public)
User-defined keywordsSimons Thomas
Estimated Impact151
Family? (F = Feedback message, R = changed R code, M = changed R Module, P = changed Parameters, D = changed Data)
-       [Standard Deviation-Mean Plot] [Tijdsreeks B - st...] [2011-08-03 12:22:35] [649f27debd29df6d3b5186bbc318d779] [Current]
Feedback Forum

Post a new message
Dataseries X:
1200
1400
1210
1260
1320
1320
1310
1260
1340
1180
1330
1390
1130
1340
1140
1290
1260
1280
1330
1270
1300
1150
1410
1250
1030
1320
1160
1300
1190
1310
1290
1320
1300
1230
1330
1220
1010
1290
1170
1240
1260
1260
1310
1360
1250
1170
1360
1140
1030
1260
1210
1190
1230
1350
1300
1340
1270
1220
1400
1120
1000
1260
1260
1150
1240
1360
1350
1280
1320
1210
1370
1060
1040
1260
1210
1200
1200
1290
1400
1280
1280
1220
1350
1000
980
1240
1190
1200
1150
1270
1410
1420
1260
1300
1410
1000
950
1280
1330
1190
1170
1270
1340
1470
1270
1280
1430
980


Summary of computational transaction
Raw Inputview raw input (R code)
Raw Outputview raw output of R engine
Computing time1 seconds
R Server'Gwilym Jenkins' @ jenkins.wessa.net

\begin{tabular}{lllllllll}
\hline
Summary of computational transaction \tabularnewline
Raw Input & view raw input (R code)  \tabularnewline
Raw Output & view raw output of R engine  \tabularnewline
Computing time & 1 seconds \tabularnewline
R Server & 'Gwilym Jenkins' @ jenkins.wessa.net \tabularnewline
\hline
\end{tabular}
%Source: https://freestatistics.org/blog/index.php?pk=123323&T=0

[TABLE]
[ROW][C]Summary of computational transaction[/C][/ROW]
[ROW][C]Raw Input[/C][C]view raw input (R code) [/C][/ROW]
[ROW][C]Raw Output[/C][C]view raw output of R engine [/C][/ROW]
[ROW][C]Computing time[/C][C]1 seconds[/C][/ROW]
[ROW][C]R Server[/C][C]'Gwilym Jenkins' @ jenkins.wessa.net[/C][/ROW]
[/TABLE]
Source: https://freestatistics.org/blog/index.php?pk=123323&T=0

Globally Unique Identifier (entire table): ba.freestatistics.org/blog/index.php?pk=123323&T=0

As an alternative you can also use a QR Code:  

The GUIDs for individual cells are displayed in the table below:

Summary of computational transaction
Raw Inputview raw input (R code)
Raw Outputview raw output of R engine
Computing time1 seconds
R Server'Gwilym Jenkins' @ jenkins.wessa.net


Standard Deviation-Mean Plot
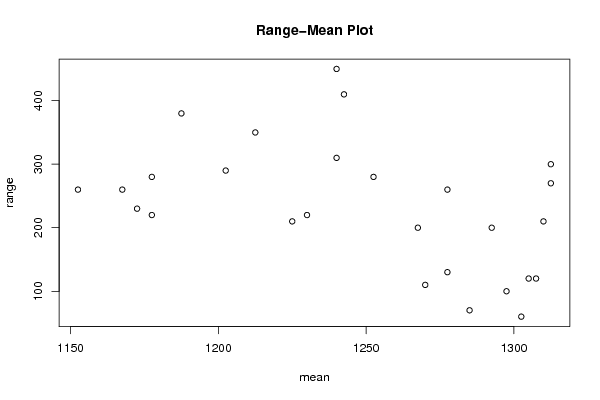
SectionMeanStandard DeviationRange
11267.592.1502396451939200
21302.528.722813232690160
3131090.5538513813742210
41225105.987420637231210
5128531.09126351029670
61277.5108.128010555391260
71202.5135.246688191122290
81277.559.6517672272443130
9127053.5412613473634110
101177.5122.031416719903280
111297.547.8713553878169100
12123098.3192080250175220
131172.599.4568583189046230
14130554.4671154612273120
151252.5116.440256498057280
161167.5123.119183449751260
171307.557.373048260195120
181240137.35598518691310
191177.595.3502316025854220
201292.582.2090830342568200
211212.5151.299922890485350
221152.5117.011395456454260
231312.5128.160056179763270
241242.5173.661548229115410
251187.5168.597153000874380
261312.5126.062153982338300
271240188.148877222268450

\begin{tabular}{lllllllll}
\hline
Standard Deviation-Mean Plot \tabularnewline
Section & Mean & Standard Deviation & Range \tabularnewline
1 & 1267.5 & 92.1502396451939 & 200 \tabularnewline
2 & 1302.5 & 28.7228132326901 & 60 \tabularnewline
3 & 1310 & 90.5538513813742 & 210 \tabularnewline
4 & 1225 & 105.987420637231 & 210 \tabularnewline
5 & 1285 & 31.091263510296 & 70 \tabularnewline
6 & 1277.5 & 108.128010555391 & 260 \tabularnewline
7 & 1202.5 & 135.246688191122 & 290 \tabularnewline
8 & 1277.5 & 59.6517672272443 & 130 \tabularnewline
9 & 1270 & 53.5412613473634 & 110 \tabularnewline
10 & 1177.5 & 122.031416719903 & 280 \tabularnewline
11 & 1297.5 & 47.8713553878169 & 100 \tabularnewline
12 & 1230 & 98.3192080250175 & 220 \tabularnewline
13 & 1172.5 & 99.4568583189046 & 230 \tabularnewline
14 & 1305 & 54.4671154612273 & 120 \tabularnewline
15 & 1252.5 & 116.440256498057 & 280 \tabularnewline
16 & 1167.5 & 123.119183449751 & 260 \tabularnewline
17 & 1307.5 & 57.373048260195 & 120 \tabularnewline
18 & 1240 & 137.35598518691 & 310 \tabularnewline
19 & 1177.5 & 95.3502316025854 & 220 \tabularnewline
20 & 1292.5 & 82.2090830342568 & 200 \tabularnewline
21 & 1212.5 & 151.299922890485 & 350 \tabularnewline
22 & 1152.5 & 117.011395456454 & 260 \tabularnewline
23 & 1312.5 & 128.160056179763 & 270 \tabularnewline
24 & 1242.5 & 173.661548229115 & 410 \tabularnewline
25 & 1187.5 & 168.597153000874 & 380 \tabularnewline
26 & 1312.5 & 126.062153982338 & 300 \tabularnewline
27 & 1240 & 188.148877222268 & 450 \tabularnewline
\hline
\end{tabular}
%Source: https://freestatistics.org/blog/index.php?pk=123323&T=1

[TABLE]
[ROW][C]Standard Deviation-Mean Plot[/C][/ROW]
[ROW][C]Section[/C][C]Mean[/C][C]Standard Deviation[/C][C]Range[/C][/ROW]
[ROW][C]1[/C][C]1267.5[/C][C]92.1502396451939[/C][C]200[/C][/ROW]
[ROW][C]2[/C][C]1302.5[/C][C]28.7228132326901[/C][C]60[/C][/ROW]
[ROW][C]3[/C][C]1310[/C][C]90.5538513813742[/C][C]210[/C][/ROW]
[ROW][C]4[/C][C]1225[/C][C]105.987420637231[/C][C]210[/C][/ROW]
[ROW][C]5[/C][C]1285[/C][C]31.091263510296[/C][C]70[/C][/ROW]
[ROW][C]6[/C][C]1277.5[/C][C]108.128010555391[/C][C]260[/C][/ROW]
[ROW][C]7[/C][C]1202.5[/C][C]135.246688191122[/C][C]290[/C][/ROW]
[ROW][C]8[/C][C]1277.5[/C][C]59.6517672272443[/C][C]130[/C][/ROW]
[ROW][C]9[/C][C]1270[/C][C]53.5412613473634[/C][C]110[/C][/ROW]
[ROW][C]10[/C][C]1177.5[/C][C]122.031416719903[/C][C]280[/C][/ROW]
[ROW][C]11[/C][C]1297.5[/C][C]47.8713553878169[/C][C]100[/C][/ROW]
[ROW][C]12[/C][C]1230[/C][C]98.3192080250175[/C][C]220[/C][/ROW]
[ROW][C]13[/C][C]1172.5[/C][C]99.4568583189046[/C][C]230[/C][/ROW]
[ROW][C]14[/C][C]1305[/C][C]54.4671154612273[/C][C]120[/C][/ROW]
[ROW][C]15[/C][C]1252.5[/C][C]116.440256498057[/C][C]280[/C][/ROW]
[ROW][C]16[/C][C]1167.5[/C][C]123.119183449751[/C][C]260[/C][/ROW]
[ROW][C]17[/C][C]1307.5[/C][C]57.373048260195[/C][C]120[/C][/ROW]
[ROW][C]18[/C][C]1240[/C][C]137.35598518691[/C][C]310[/C][/ROW]
[ROW][C]19[/C][C]1177.5[/C][C]95.3502316025854[/C][C]220[/C][/ROW]
[ROW][C]20[/C][C]1292.5[/C][C]82.2090830342568[/C][C]200[/C][/ROW]
[ROW][C]21[/C][C]1212.5[/C][C]151.299922890485[/C][C]350[/C][/ROW]
[ROW][C]22[/C][C]1152.5[/C][C]117.011395456454[/C][C]260[/C][/ROW]
[ROW][C]23[/C][C]1312.5[/C][C]128.160056179763[/C][C]270[/C][/ROW]
[ROW][C]24[/C][C]1242.5[/C][C]173.661548229115[/C][C]410[/C][/ROW]
[ROW][C]25[/C][C]1187.5[/C][C]168.597153000874[/C][C]380[/C][/ROW]
[ROW][C]26[/C][C]1312.5[/C][C]126.062153982338[/C][C]300[/C][/ROW]
[ROW][C]27[/C][C]1240[/C][C]188.148877222268[/C][C]450[/C][/ROW]
[/TABLE]
Source: https://freestatistics.org/blog/index.php?pk=123323&T=1

Globally Unique Identifier (entire table): ba.freestatistics.org/blog/index.php?pk=123323&T=1

As an alternative you can also use a QR Code:  

The GUIDs for individual cells are displayed in the table below:

Standard Deviation-Mean Plot
SectionMeanStandard DeviationRange
11267.592.1502396451939200
21302.528.722813232690160
3131090.5538513813742210
41225105.987420637231210
5128531.09126351029670
61277.5108.128010555391260
71202.5135.246688191122290
81277.559.6517672272443130
9127053.5412613473634110
101177.5122.031416719903280
111297.547.8713553878169100
12123098.3192080250175220
131172.599.4568583189046230
14130554.4671154612273120
151252.5116.440256498057280
161167.5123.119183449751260
171307.557.373048260195120
181240137.35598518691310
191177.595.3502316025854220
201292.582.2090830342568200
211212.5151.299922890485350
221152.5117.011395456454260
231312.5128.160056179763270
241242.5173.661548229115410
251187.5168.597153000874380
261312.5126.062153982338300
271240188.148877222268450


Regression: S.E.(k) = alpha + beta * Mean(k)
alpha602.775877567639
beta-0.400116938339415
S.D.0.143016717643719
T-STAT-2.79769347899718
p-value0.00976243201418843

\begin{tabular}{lllllllll}
\hline
Regression: S.E.(k) = alpha + beta * Mean(k) \tabularnewline
alpha & 602.775877567639 \tabularnewline
beta & -0.400116938339415 \tabularnewline
S.D. & 0.143016717643719 \tabularnewline
T-STAT & -2.79769347899718 \tabularnewline
p-value & 0.00976243201418843 \tabularnewline
\hline
\end{tabular}
%Source: https://freestatistics.org/blog/index.php?pk=123323&T=2

[TABLE]
[ROW][C]Regression: S.E.(k) = alpha + beta * Mean(k)[/C][/ROW]
[ROW][C]alpha[/C][C]602.775877567639[/C][/ROW]
[ROW][C]beta[/C][C]-0.400116938339415[/C][/ROW]
[ROW][C]S.D.[/C][C]0.143016717643719[/C][/ROW]
[ROW][C]T-STAT[/C][C]-2.79769347899718[/C][/ROW]
[ROW][C]p-value[/C][C]0.00976243201418843[/C][/ROW]
[/TABLE]
Source: https://freestatistics.org/blog/index.php?pk=123323&T=2

Globally Unique Identifier (entire table): ba.freestatistics.org/blog/index.php?pk=123323&T=2

As an alternative you can also use a QR Code:  

The GUIDs for individual cells are displayed in the table below:

Regression: S.E.(k) = alpha + beta * Mean(k)
alpha602.775877567639
beta-0.400116938339415
S.D.0.143016717643719
T-STAT-2.79769347899718
p-value0.00976243201418843


Regression: ln S.E.(k) = alpha + beta * ln Mean(k)
alpha47.4216199311103
beta-6.01588753484072
S.D.2.03074655978773
T-STAT-2.96240193334099
p-value0.00660779877113166
Lambda7.01588753484072

\begin{tabular}{lllllllll}
\hline
Regression: ln S.E.(k) = alpha + beta * ln Mean(k) \tabularnewline
alpha & 47.4216199311103 \tabularnewline
beta & -6.01588753484072 \tabularnewline
S.D. & 2.03074655978773 \tabularnewline
T-STAT & -2.96240193334099 \tabularnewline
p-value & 0.00660779877113166 \tabularnewline
Lambda & 7.01588753484072 \tabularnewline
\hline
\end{tabular}
%Source: https://freestatistics.org/blog/index.php?pk=123323&T=3

[TABLE]
[ROW][C]Regression: ln S.E.(k) = alpha + beta * ln Mean(k)[/C][/ROW]
[ROW][C]alpha[/C][C]47.4216199311103[/C][/ROW]
[ROW][C]beta[/C][C]-6.01588753484072[/C][/ROW]
[ROW][C]S.D.[/C][C]2.03074655978773[/C][/ROW]
[ROW][C]T-STAT[/C][C]-2.96240193334099[/C][/ROW]
[ROW][C]p-value[/C][C]0.00660779877113166[/C][/ROW]
[ROW][C]Lambda[/C][C]7.01588753484072[/C][/ROW]
[/TABLE]
Source: https://freestatistics.org/blog/index.php?pk=123323&T=3

Globally Unique Identifier (entire table): ba.freestatistics.org/blog/index.php?pk=123323&T=3

As an alternative you can also use a QR Code:  

The GUIDs for individual cells are displayed in the table below:

Regression: ln S.E.(k) = alpha + beta * ln Mean(k)
alpha47.4216199311103
beta-6.01588753484072
S.D.2.03074655978773
T-STAT-2.96240193334099
p-value0.00660779877113166
Lambda7.01588753484072


Parameters (Session):
par1 = 4 ;
Parameters (R input):
par1 = 4 ;
R code (references can be found in the software module):
par1 <- as.numeric(par1)
(n <- length(x))
(np <- floor(n / par1))
arr <- array(NA,dim=c(par1,np))
j <- 0
k <- 1
for (i in 1:(np*par1))
{
j = j + 1
arr[j,k] <- x[i]
if (j == par1) {
j = 0
k=k+1
}
}
arr
arr.mean <- array(NA,dim=np)
arr.sd <- array(NA,dim=np)
arr.range <- array(NA,dim=np)
for (j in 1:np)
{
arr.mean[j] <- mean(arr[,j],na.rm=TRUE)
arr.sd[j] <- sd(arr[,j],na.rm=TRUE)
arr.range[j] <- max(arr[,j],na.rm=TRUE) - min(arr[,j],na.rm=TRUE)
}
arr.mean
arr.sd
arr.range
(lm1 <- lm(arr.sd~arr.mean))
(lnlm1 <- lm(log(arr.sd)~log(arr.mean)))
(lm2 <- lm(arr.range~arr.mean))
bitmap(file='test1.png')
plot(arr.mean,arr.sd,main='Standard Deviation-Mean Plot',xlab='mean',ylab='standard deviation')
dev.off()
bitmap(file='test2.png')
plot(arr.mean,arr.range,main='Range-Mean Plot',xlab='mean',ylab='range')
dev.off()
load(file='createtable')
a<-table.start()
a<-table.row.start(a)
a<-table.element(a,'Standard Deviation-Mean Plot',4,TRUE)
a<-table.row.end(a)
a<-table.row.start(a)
a<-table.element(a,'Section',header=TRUE)
a<-table.element(a,'Mean',header=TRUE)
a<-table.element(a,'Standard Deviation',header=TRUE)
a<-table.element(a,'Range',header=TRUE)
a<-table.row.end(a)
for (j in 1:np) {
a<-table.row.start(a)
a<-table.element(a,j,header=TRUE)
a<-table.element(a,arr.mean[j])
a<-table.element(a,arr.sd[j] )
a<-table.element(a,arr.range[j] )
a<-table.row.end(a)
}
a<-table.end(a)
table.save(a,file='mytable.tab')
a<-table.start()
a<-table.row.start(a)
a<-table.element(a,'Regression: S.E.(k) = alpha + beta * Mean(k)',2,TRUE)
a<-table.row.end(a)
a<-table.row.start(a)
a<-table.element(a,'alpha',header=TRUE)
a<-table.element(a,lm1$coefficients[[1]])
a<-table.row.end(a)
a<-table.row.start(a)
a<-table.element(a,'beta',header=TRUE)
a<-table.element(a,lm1$coefficients[[2]])
a<-table.row.end(a)
a<-table.row.start(a)
a<-table.element(a,'S.D.',header=TRUE)
a<-table.element(a,summary(lm1)$coefficients[2,2])
a<-table.row.end(a)
a<-table.row.start(a)
a<-table.element(a,'T-STAT',header=TRUE)
a<-table.element(a,summary(lm1)$coefficients[2,3])
a<-table.row.end(a)
a<-table.row.start(a)
a<-table.element(a,'p-value',header=TRUE)
a<-table.element(a,summary(lm1)$coefficients[2,4])
a<-table.row.end(a)
a<-table.end(a)
table.save(a,file='mytable1.tab')
a<-table.start()
a<-table.row.start(a)
a<-table.element(a,'Regression: ln S.E.(k) = alpha + beta * ln Mean(k)',2,TRUE)
a<-table.row.end(a)
a<-table.row.start(a)
a<-table.element(a,'alpha',header=TRUE)
a<-table.element(a,lnlm1$coefficients[[1]])
a<-table.row.end(a)
a<-table.row.start(a)
a<-table.element(a,'beta',header=TRUE)
a<-table.element(a,lnlm1$coefficients[[2]])
a<-table.row.end(a)
a<-table.row.start(a)
a<-table.element(a,'S.D.',header=TRUE)
a<-table.element(a,summary(lnlm1)$coefficients[2,2])
a<-table.row.end(a)
a<-table.row.start(a)
a<-table.element(a,'T-STAT',header=TRUE)
a<-table.element(a,summary(lnlm1)$coefficients[2,3])
a<-table.row.end(a)
a<-table.row.start(a)
a<-table.element(a,'p-value',header=TRUE)
a<-table.element(a,summary(lnlm1)$coefficients[2,4])
a<-table.row.end(a)
a<-table.row.start(a)
a<-table.element(a,'Lambda',header=TRUE)
a<-table.element(a,1-lnlm1$coefficients[[2]])
a<-table.row.end(a)
a<-table.end(a)
table.save(a,file='mytable2.tab')