Free Statistics

of Irreproducible Research!

Author's title

Author*Unverified author*
R Software Modulerwasp_smp.wasp
Title produced by softwareStandard Deviation-Mean Plot
Date of computationTue, 02 Aug 2011 06:38:20 -0400
Cite this page as followsStatistical Computations at FreeStatistics.org, Office for Research Development and Education, URL https://freestatistics.org/blog/index.php?v=date/2011/Aug/02/t1312281667go03fm7va549kii.htm/, Retrieved Wed, 15 May 2024 01:42:08 +0000
Statistical Computations at FreeStatistics.org, Office for Research Development and Education, URL https://freestatistics.org/blog/index.php?pk=123278, Retrieved Wed, 15 May 2024 01:42:08 +0000
QR Codes:

Original text written by user:
IsPrivate?No (this computation is public)
User-defined keywordsVan Laer Axel
Estimated Impact178
Family? (F = Feedback message, R = changed R code, M = changed R Module, P = changed Parameters, D = changed Data)
-       [Standard Deviation-Mean Plot] [Cijferreeks A, St...] [2011-08-02 10:38:20] [3bbb4c38423daa916cf90d93c467bd86] [Current]
Feedback Forum

Post a new message
Dataseries X:
34671
34355
34035
33373
39924
39577
34671
31409
31724
31724
32075
32706
34671
34035
35017
36631
45813
45813
43853
41888
43502
45466
45813
46795
49742
47777
47777
50724
58893
59555
57911
53982
56928
56928
57244
58893
60191
60853
60853
62817
70355
72315
72630
67724
70355
69373
67408
71653
72630
70986
71333
73613
82133
86372
86372
84412
87355
84412
82764
89004
89981
87670
93559
95870
102741
107301
106670
106319
108950
108630
104706
110594
112559
110594
118763
122692
131839
135448
134470
132505
134150
136114
129559
134785
138079
136750
145265
148207
160652
162932
159990
161634
162616
163598
157358
163247
166509
163247
172749
175692
188451
190416
191047
194340
194340
195638
189749
192696
194656
191047
201527
203491
216567
218878
222140
225087
225402
225749
219860
225749


Summary of computational transaction
Raw Inputview raw input (R code)
Raw Outputview raw output of R engine
Computing time1 seconds
R Server'Gwilym Jenkins' @ jenkins.wessa.net

\begin{tabular}{lllllllll}
\hline
Summary of computational transaction \tabularnewline
Raw Input & view raw input (R code)  \tabularnewline
Raw Output & view raw output of R engine  \tabularnewline
Computing time & 1 seconds \tabularnewline
R Server & 'Gwilym Jenkins' @ jenkins.wessa.net \tabularnewline
\hline
\end{tabular}
%Source: https://freestatistics.org/blog/index.php?pk=123278&T=0

[TABLE]
[ROW][C]Summary of computational transaction[/C][/ROW]
[ROW][C]Raw Input[/C][C]view raw input (R code) [/C][/ROW]
[ROW][C]Raw Output[/C][C]view raw output of R engine [/C][/ROW]
[ROW][C]Computing time[/C][C]1 seconds[/C][/ROW]
[ROW][C]R Server[/C][C]'Gwilym Jenkins' @ jenkins.wessa.net[/C][/ROW]
[/TABLE]
Source: https://freestatistics.org/blog/index.php?pk=123278&T=0

Globally Unique Identifier (entire table): ba.freestatistics.org/blog/index.php?pk=123278&T=0

As an alternative you can also use a QR Code:  

The GUIDs for individual cells are displayed in the table below:

Summary of computational transaction
Raw Inputview raw input (R code)
Raw Outputview raw output of R engine
Computing time1 seconds
R Server'Gwilym Jenkins' @ jenkins.wessa.net


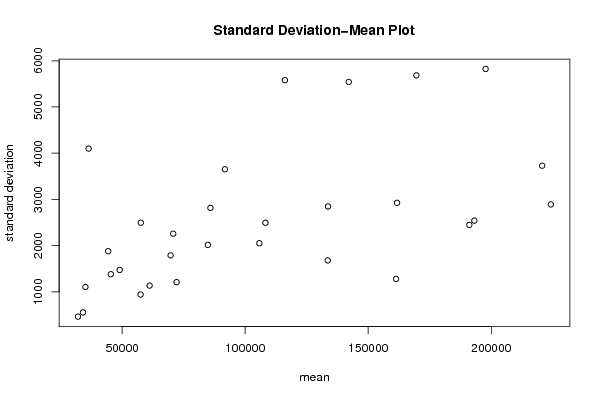
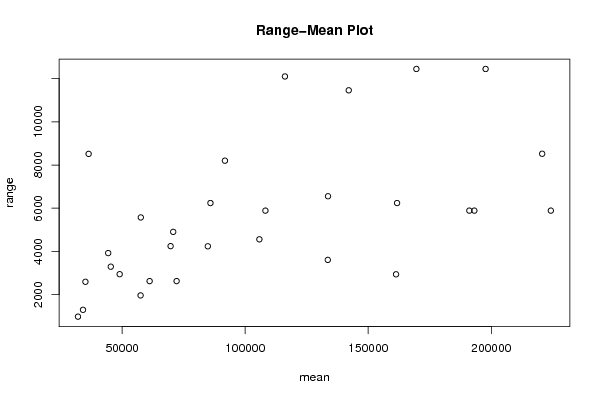
Standard Deviation-Mean Plot
SectionMeanStandard DeviationRange
134108.5554.8366125866851298
236395.254099.241261095368515
332057.25463.070459001651982
435088.51105.831060032832596
544341.751878.733505139393925
6453941381.208408121913293
7490051473.555563933712947
857585.252495.305509017555573
957498.25941.6901029531951965
1061178.51136.036824520522626
11707562258.036167410374906
1269697.251789.170827506424245
1372140.51210.067904430712627
1484822.252016.91354549474239
1585883.752816.583317307226240
16917703652.444021930168200
17105757.752051.796184647334560
181082202495.667712924415888
191161525579.4245222961812098
20133565.51680.018749895373609
211336522848.729892425756555
22142075.255540.7931065868211457
231613021279.448839670172942
24161704.752926.177412598226240
25169549.255684.2839698593512445
26191063.52448.137863765035889
27193105.752541.084332196265889
28197680.255822.6109478480512444
292206683729.014436371458520
302241902891.297632551865889

\begin{tabular}{lllllllll}
\hline
Standard Deviation-Mean Plot \tabularnewline
Section & Mean & Standard Deviation & Range \tabularnewline
1 & 34108.5 & 554.836612586685 & 1298 \tabularnewline
2 & 36395.25 & 4099.24126109536 & 8515 \tabularnewline
3 & 32057.25 & 463.070459001651 & 982 \tabularnewline
4 & 35088.5 & 1105.83106003283 & 2596 \tabularnewline
5 & 44341.75 & 1878.73350513939 & 3925 \tabularnewline
6 & 45394 & 1381.20840812191 & 3293 \tabularnewline
7 & 49005 & 1473.55556393371 & 2947 \tabularnewline
8 & 57585.25 & 2495.30550901755 & 5573 \tabularnewline
9 & 57498.25 & 941.690102953195 & 1965 \tabularnewline
10 & 61178.5 & 1136.03682452052 & 2626 \tabularnewline
11 & 70756 & 2258.03616741037 & 4906 \tabularnewline
12 & 69697.25 & 1789.17082750642 & 4245 \tabularnewline
13 & 72140.5 & 1210.06790443071 & 2627 \tabularnewline
14 & 84822.25 & 2016.9135454947 & 4239 \tabularnewline
15 & 85883.75 & 2816.58331730722 & 6240 \tabularnewline
16 & 91770 & 3652.44402193016 & 8200 \tabularnewline
17 & 105757.75 & 2051.79618464733 & 4560 \tabularnewline
18 & 108220 & 2495.66771292441 & 5888 \tabularnewline
19 & 116152 & 5579.42452229618 & 12098 \tabularnewline
20 & 133565.5 & 1680.01874989537 & 3609 \tabularnewline
21 & 133652 & 2848.72989242575 & 6555 \tabularnewline
22 & 142075.25 & 5540.79310658682 & 11457 \tabularnewline
23 & 161302 & 1279.44883967017 & 2942 \tabularnewline
24 & 161704.75 & 2926.17741259822 & 6240 \tabularnewline
25 & 169549.25 & 5684.28396985935 & 12445 \tabularnewline
26 & 191063.5 & 2448.13786376503 & 5889 \tabularnewline
27 & 193105.75 & 2541.08433219626 & 5889 \tabularnewline
28 & 197680.25 & 5822.61094784805 & 12444 \tabularnewline
29 & 220668 & 3729.01443637145 & 8520 \tabularnewline
30 & 224190 & 2891.29763255186 & 5889 \tabularnewline
\hline
\end{tabular}
%Source: https://freestatistics.org/blog/index.php?pk=123278&T=1

[TABLE]
[ROW][C]Standard Deviation-Mean Plot[/C][/ROW]
[ROW][C]Section[/C][C]Mean[/C][C]Standard Deviation[/C][C]Range[/C][/ROW]
[ROW][C]1[/C][C]34108.5[/C][C]554.836612586685[/C][C]1298[/C][/ROW]
[ROW][C]2[/C][C]36395.25[/C][C]4099.24126109536[/C][C]8515[/C][/ROW]
[ROW][C]3[/C][C]32057.25[/C][C]463.070459001651[/C][C]982[/C][/ROW]
[ROW][C]4[/C][C]35088.5[/C][C]1105.83106003283[/C][C]2596[/C][/ROW]
[ROW][C]5[/C][C]44341.75[/C][C]1878.73350513939[/C][C]3925[/C][/ROW]
[ROW][C]6[/C][C]45394[/C][C]1381.20840812191[/C][C]3293[/C][/ROW]
[ROW][C]7[/C][C]49005[/C][C]1473.55556393371[/C][C]2947[/C][/ROW]
[ROW][C]8[/C][C]57585.25[/C][C]2495.30550901755[/C][C]5573[/C][/ROW]
[ROW][C]9[/C][C]57498.25[/C][C]941.690102953195[/C][C]1965[/C][/ROW]
[ROW][C]10[/C][C]61178.5[/C][C]1136.03682452052[/C][C]2626[/C][/ROW]
[ROW][C]11[/C][C]70756[/C][C]2258.03616741037[/C][C]4906[/C][/ROW]
[ROW][C]12[/C][C]69697.25[/C][C]1789.17082750642[/C][C]4245[/C][/ROW]
[ROW][C]13[/C][C]72140.5[/C][C]1210.06790443071[/C][C]2627[/C][/ROW]
[ROW][C]14[/C][C]84822.25[/C][C]2016.9135454947[/C][C]4239[/C][/ROW]
[ROW][C]15[/C][C]85883.75[/C][C]2816.58331730722[/C][C]6240[/C][/ROW]
[ROW][C]16[/C][C]91770[/C][C]3652.44402193016[/C][C]8200[/C][/ROW]
[ROW][C]17[/C][C]105757.75[/C][C]2051.79618464733[/C][C]4560[/C][/ROW]
[ROW][C]18[/C][C]108220[/C][C]2495.66771292441[/C][C]5888[/C][/ROW]
[ROW][C]19[/C][C]116152[/C][C]5579.42452229618[/C][C]12098[/C][/ROW]
[ROW][C]20[/C][C]133565.5[/C][C]1680.01874989537[/C][C]3609[/C][/ROW]
[ROW][C]21[/C][C]133652[/C][C]2848.72989242575[/C][C]6555[/C][/ROW]
[ROW][C]22[/C][C]142075.25[/C][C]5540.79310658682[/C][C]11457[/C][/ROW]
[ROW][C]23[/C][C]161302[/C][C]1279.44883967017[/C][C]2942[/C][/ROW]
[ROW][C]24[/C][C]161704.75[/C][C]2926.17741259822[/C][C]6240[/C][/ROW]
[ROW][C]25[/C][C]169549.25[/C][C]5684.28396985935[/C][C]12445[/C][/ROW]
[ROW][C]26[/C][C]191063.5[/C][C]2448.13786376503[/C][C]5889[/C][/ROW]
[ROW][C]27[/C][C]193105.75[/C][C]2541.08433219626[/C][C]5889[/C][/ROW]
[ROW][C]28[/C][C]197680.25[/C][C]5822.61094784805[/C][C]12444[/C][/ROW]
[ROW][C]29[/C][C]220668[/C][C]3729.01443637145[/C][C]8520[/C][/ROW]
[ROW][C]30[/C][C]224190[/C][C]2891.29763255186[/C][C]5889[/C][/ROW]
[/TABLE]
Source: https://freestatistics.org/blog/index.php?pk=123278&T=1

Globally Unique Identifier (entire table): ba.freestatistics.org/blog/index.php?pk=123278&T=1

As an alternative you can also use a QR Code:  

The GUIDs for individual cells are displayed in the table below:

Standard Deviation-Mean Plot
SectionMeanStandard DeviationRange
134108.5554.8366125866851298
236395.254099.241261095368515
332057.25463.070459001651982
435088.51105.831060032832596
544341.751878.733505139393925
6453941381.208408121913293
7490051473.555563933712947
857585.252495.305509017555573
957498.25941.6901029531951965
1061178.51136.036824520522626
11707562258.036167410374906
1269697.251789.170827506424245
1372140.51210.067904430712627
1484822.252016.91354549474239
1585883.752816.583317307226240
16917703652.444021930168200
17105757.752051.796184647334560
181082202495.667712924415888
191161525579.4245222961812098
20133565.51680.018749895373609
211336522848.729892425756555
22142075.255540.7931065868211457
231613021279.448839670172942
24161704.752926.177412598226240
25169549.255684.2839698593512445
26191063.52448.137863765035889
27193105.752541.084332196265889
28197680.255822.6109478480512444
292206683729.014436371458520
302241902891.297632551865889


Regression: S.E.(k) = alpha + beta * Mean(k)
alpha1136.9261049947
beta0.0133954683594435
S.D.0.00403428710058345
T-STAT3.32040532204716
p-value0.00250614894461325

\begin{tabular}{lllllllll}
\hline
Regression: S.E.(k) = alpha + beta * Mean(k) \tabularnewline
alpha & 1136.9261049947 \tabularnewline
beta & 0.0133954683594435 \tabularnewline
S.D. & 0.00403428710058345 \tabularnewline
T-STAT & 3.32040532204716 \tabularnewline
p-value & 0.00250614894461325 \tabularnewline
\hline
\end{tabular}
%Source: https://freestatistics.org/blog/index.php?pk=123278&T=2

[TABLE]
[ROW][C]Regression: S.E.(k) = alpha + beta * Mean(k)[/C][/ROW]
[ROW][C]alpha[/C][C]1136.9261049947[/C][/ROW]
[ROW][C]beta[/C][C]0.0133954683594435[/C][/ROW]
[ROW][C]S.D.[/C][C]0.00403428710058345[/C][/ROW]
[ROW][C]T-STAT[/C][C]3.32040532204716[/C][/ROW]
[ROW][C]p-value[/C][C]0.00250614894461325[/C][/ROW]
[/TABLE]
Source: https://freestatistics.org/blog/index.php?pk=123278&T=2

Globally Unique Identifier (entire table): ba.freestatistics.org/blog/index.php?pk=123278&T=2

As an alternative you can also use a QR Code:  

The GUIDs for individual cells are displayed in the table below:

Regression: S.E.(k) = alpha + beta * Mean(k)
alpha1136.9261049947
beta0.0133954683594435
S.D.0.00403428710058345
T-STAT3.32040532204716
p-value0.00250614894461325


Regression: ln S.E.(k) = alpha + beta * ln Mean(k)
alpha0.0854586358697535
beta0.664861691990468
S.D.0.152663510023095
T-STAT4.35507929753409
p-value0.000161135451335229
Lambda0.335138308009532

\begin{tabular}{lllllllll}
\hline
Regression: ln S.E.(k) = alpha + beta * ln Mean(k) \tabularnewline
alpha & 0.0854586358697535 \tabularnewline
beta & 0.664861691990468 \tabularnewline
S.D. & 0.152663510023095 \tabularnewline
T-STAT & 4.35507929753409 \tabularnewline
p-value & 0.000161135451335229 \tabularnewline
Lambda & 0.335138308009532 \tabularnewline
\hline
\end{tabular}
%Source: https://freestatistics.org/blog/index.php?pk=123278&T=3

[TABLE]
[ROW][C]Regression: ln S.E.(k) = alpha + beta * ln Mean(k)[/C][/ROW]
[ROW][C]alpha[/C][C]0.0854586358697535[/C][/ROW]
[ROW][C]beta[/C][C]0.664861691990468[/C][/ROW]
[ROW][C]S.D.[/C][C]0.152663510023095[/C][/ROW]
[ROW][C]T-STAT[/C][C]4.35507929753409[/C][/ROW]
[ROW][C]p-value[/C][C]0.000161135451335229[/C][/ROW]
[ROW][C]Lambda[/C][C]0.335138308009532[/C][/ROW]
[/TABLE]
Source: https://freestatistics.org/blog/index.php?pk=123278&T=3

Globally Unique Identifier (entire table): ba.freestatistics.org/blog/index.php?pk=123278&T=3

As an alternative you can also use a QR Code:  

The GUIDs for individual cells are displayed in the table below:

Regression: ln S.E.(k) = alpha + beta * ln Mean(k)
alpha0.0854586358697535
beta0.664861691990468
S.D.0.152663510023095
T-STAT4.35507929753409
p-value0.000161135451335229
Lambda0.335138308009532


Parameters (Session):
par1 = 4 ;
Parameters (R input):
par1 = 4 ;
R code (references can be found in the software module):
par1 <- as.numeric(par1)
(n <- length(x))
(np <- floor(n / par1))
arr <- array(NA,dim=c(par1,np))
j <- 0
k <- 1
for (i in 1:(np*par1))
{
j = j + 1
arr[j,k] <- x[i]
if (j == par1) {
j = 0
k=k+1
}
}
arr
arr.mean <- array(NA,dim=np)
arr.sd <- array(NA,dim=np)
arr.range <- array(NA,dim=np)
for (j in 1:np)
{
arr.mean[j] <- mean(arr[,j],na.rm=TRUE)
arr.sd[j] <- sd(arr[,j],na.rm=TRUE)
arr.range[j] <- max(arr[,j],na.rm=TRUE) - min(arr[,j],na.rm=TRUE)
}
arr.mean
arr.sd
arr.range
(lm1 <- lm(arr.sd~arr.mean))
(lnlm1 <- lm(log(arr.sd)~log(arr.mean)))
(lm2 <- lm(arr.range~arr.mean))
bitmap(file='test1.png')
plot(arr.mean,arr.sd,main='Standard Deviation-Mean Plot',xlab='mean',ylab='standard deviation')
dev.off()
bitmap(file='test2.png')
plot(arr.mean,arr.range,main='Range-Mean Plot',xlab='mean',ylab='range')
dev.off()
load(file='createtable')
a<-table.start()
a<-table.row.start(a)
a<-table.element(a,'Standard Deviation-Mean Plot',4,TRUE)
a<-table.row.end(a)
a<-table.row.start(a)
a<-table.element(a,'Section',header=TRUE)
a<-table.element(a,'Mean',header=TRUE)
a<-table.element(a,'Standard Deviation',header=TRUE)
a<-table.element(a,'Range',header=TRUE)
a<-table.row.end(a)
for (j in 1:np) {
a<-table.row.start(a)
a<-table.element(a,j,header=TRUE)
a<-table.element(a,arr.mean[j])
a<-table.element(a,arr.sd[j] )
a<-table.element(a,arr.range[j] )
a<-table.row.end(a)
}
a<-table.end(a)
table.save(a,file='mytable.tab')
a<-table.start()
a<-table.row.start(a)
a<-table.element(a,'Regression: S.E.(k) = alpha + beta * Mean(k)',2,TRUE)
a<-table.row.end(a)
a<-table.row.start(a)
a<-table.element(a,'alpha',header=TRUE)
a<-table.element(a,lm1$coefficients[[1]])
a<-table.row.end(a)
a<-table.row.start(a)
a<-table.element(a,'beta',header=TRUE)
a<-table.element(a,lm1$coefficients[[2]])
a<-table.row.end(a)
a<-table.row.start(a)
a<-table.element(a,'S.D.',header=TRUE)
a<-table.element(a,summary(lm1)$coefficients[2,2])
a<-table.row.end(a)
a<-table.row.start(a)
a<-table.element(a,'T-STAT',header=TRUE)
a<-table.element(a,summary(lm1)$coefficients[2,3])
a<-table.row.end(a)
a<-table.row.start(a)
a<-table.element(a,'p-value',header=TRUE)
a<-table.element(a,summary(lm1)$coefficients[2,4])
a<-table.row.end(a)
a<-table.end(a)
table.save(a,file='mytable1.tab')
a<-table.start()
a<-table.row.start(a)
a<-table.element(a,'Regression: ln S.E.(k) = alpha + beta * ln Mean(k)',2,TRUE)
a<-table.row.end(a)
a<-table.row.start(a)
a<-table.element(a,'alpha',header=TRUE)
a<-table.element(a,lnlm1$coefficients[[1]])
a<-table.row.end(a)
a<-table.row.start(a)
a<-table.element(a,'beta',header=TRUE)
a<-table.element(a,lnlm1$coefficients[[2]])
a<-table.row.end(a)
a<-table.row.start(a)
a<-table.element(a,'S.D.',header=TRUE)
a<-table.element(a,summary(lnlm1)$coefficients[2,2])
a<-table.row.end(a)
a<-table.row.start(a)
a<-table.element(a,'T-STAT',header=TRUE)
a<-table.element(a,summary(lnlm1)$coefficients[2,3])
a<-table.row.end(a)
a<-table.row.start(a)
a<-table.element(a,'p-value',header=TRUE)
a<-table.element(a,summary(lnlm1)$coefficients[2,4])
a<-table.row.end(a)
a<-table.row.start(a)
a<-table.element(a,'Lambda',header=TRUE)
a<-table.element(a,1-lnlm1$coefficients[[2]])
a<-table.row.end(a)
a<-table.end(a)
table.save(a,file='mytable2.tab')