Free Statistics

of Irreproducible Research!

Author's title

Author*Unverified author*
R Software Modulerwasp_smp.wasp
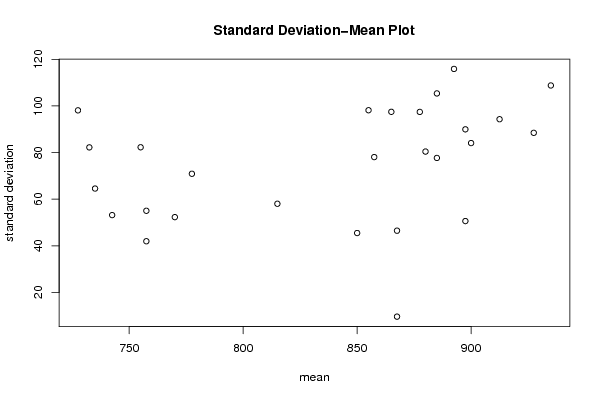
Title produced by softwareStandard Deviation-Mean Plot
Date of computationMon, 01 Aug 2011 09:44:25 -0400
Cite this page as followsStatistical Computations at FreeStatistics.org, Office for Research Development and Education, URL https://freestatistics.org/blog/index.php?v=date/2011/Aug/01/t1312206297os2q3xa2jux8829.htm/, Retrieved Mon, 13 May 2024 23:51:30 +0000
Statistical Computations at FreeStatistics.org, Office for Research Development and Education, URL https://freestatistics.org/blog/index.php?pk=123269, Retrieved Mon, 13 May 2024 23:51:30 +0000
QR Codes:

Original text written by user:
IsPrivate?No (this computation is public)
User-defined keywordsKatrien Monnens
Estimated Impact205
Family? (F = Feedback message, R = changed R code, M = changed R Module, P = changed Parameters, D = changed Data)
-       [Standard Deviation-Mean Plot] [Tijdreeks B stap 21] [2011-08-01 13:44:25] [3f9379635061ebc5737ab9ab2503b0b0] [Current]
Feedback Forum

Post a new message
Dataseries X:
740
730
740
820
820
850
870
930
890
790
840
880
730
730
770
880
820
900
940
1080
920
710
880
910
680
740
740
810
800
900
920
1030
910
720
930
900
680
770
770
810
810
910
820
980
830
760
930
910
640
780
690
820
800
910
850
980
830
820
1010
930
630
760
670
850
780
900
840
1050
810
860
1020
820
670
780
690
800
810
910
870
1010
810
960
990
780
700
810
760
810
840
900
920
1050
860
870
880
860
650
830
730
810
840
940
870
940
770
870
860
760


Summary of computational transaction
Raw Inputview raw input (R code)
Raw Outputview raw output of R engine
Computing time1 seconds
R Server'Gertrude Mary Cox' @ cox.wessa.net

\begin{tabular}{lllllllll}
\hline
Summary of computational transaction \tabularnewline
Raw Input & view raw input (R code)  \tabularnewline
Raw Output & view raw output of R engine  \tabularnewline
Computing time & 1 seconds \tabularnewline
R Server & 'Gertrude Mary Cox' @ cox.wessa.net \tabularnewline
\hline
\end{tabular}
%Source: https://freestatistics.org/blog/index.php?pk=123269&T=0

[TABLE]
[ROW][C]Summary of computational transaction[/C][/ROW]
[ROW][C]Raw Input[/C][C]view raw input (R code) [/C][/ROW]
[ROW][C]Raw Output[/C][C]view raw output of R engine [/C][/ROW]
[ROW][C]Computing time[/C][C]1 seconds[/C][/ROW]
[ROW][C]R Server[/C][C]'Gertrude Mary Cox' @ cox.wessa.net[/C][/ROW]
[/TABLE]
Source: https://freestatistics.org/blog/index.php?pk=123269&T=0

Globally Unique Identifier (entire table): ba.freestatistics.org/blog/index.php?pk=123269&T=0

As an alternative you can also use a QR Code:  

The GUIDs for individual cells are displayed in the table below:

Summary of computational transaction
Raw Inputview raw input (R code)
Raw Outputview raw output of R engine
Computing time1 seconds
R Server'Gertrude Mary Cox' @ cox.wessa.net


Standard Deviation-Mean Plot
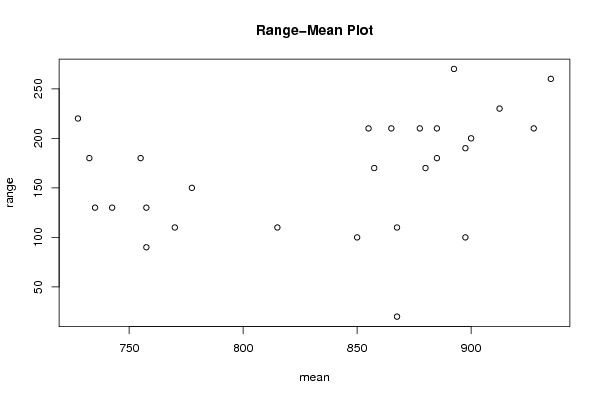
SectionMeanStandard DeviationRange
1757.541.932485418030490
2867.546.4578662158878110
385045.4606056566195100
4777.570.8872343937891150
5935108.781125813871260
685598.1495457622364210
7742.553.1507290636732130
8912.594.2956343987709230
986597.4679434480896210
10757.555130
1188080.4155872120988170
12857.578.049129826454170
13732.582.2090830342568180
1488577.6745346515403180
15897.589.9536917900909190
16727.598.1070843517429220
17892.5115.866302262565270
18877.597.4251849711699210
1973564.5497224367903130
2090084.0634680861233200
21885105.356537528527210
2277052.2812904711937110
23927.588.4590300647707210
24867.59.5742710775633820
2575582.2597511950204180
26897.550.5799696849784100
2781558.022983951764110

\begin{tabular}{lllllllll}
\hline
Standard Deviation-Mean Plot \tabularnewline
Section & Mean & Standard Deviation & Range \tabularnewline
1 & 757.5 & 41.9324854180304 & 90 \tabularnewline
2 & 867.5 & 46.4578662158878 & 110 \tabularnewline
3 & 850 & 45.4606056566195 & 100 \tabularnewline
4 & 777.5 & 70.8872343937891 & 150 \tabularnewline
5 & 935 & 108.781125813871 & 260 \tabularnewline
6 & 855 & 98.1495457622364 & 210 \tabularnewline
7 & 742.5 & 53.1507290636732 & 130 \tabularnewline
8 & 912.5 & 94.2956343987709 & 230 \tabularnewline
9 & 865 & 97.4679434480896 & 210 \tabularnewline
10 & 757.5 & 55 & 130 \tabularnewline
11 & 880 & 80.4155872120988 & 170 \tabularnewline
12 & 857.5 & 78.049129826454 & 170 \tabularnewline
13 & 732.5 & 82.2090830342568 & 180 \tabularnewline
14 & 885 & 77.6745346515403 & 180 \tabularnewline
15 & 897.5 & 89.9536917900909 & 190 \tabularnewline
16 & 727.5 & 98.1070843517429 & 220 \tabularnewline
17 & 892.5 & 115.866302262565 & 270 \tabularnewline
18 & 877.5 & 97.4251849711699 & 210 \tabularnewline
19 & 735 & 64.5497224367903 & 130 \tabularnewline
20 & 900 & 84.0634680861233 & 200 \tabularnewline
21 & 885 & 105.356537528527 & 210 \tabularnewline
22 & 770 & 52.2812904711937 & 110 \tabularnewline
23 & 927.5 & 88.4590300647707 & 210 \tabularnewline
24 & 867.5 & 9.57427107756338 & 20 \tabularnewline
25 & 755 & 82.2597511950204 & 180 \tabularnewline
26 & 897.5 & 50.5799696849784 & 100 \tabularnewline
27 & 815 & 58.022983951764 & 110 \tabularnewline
\hline
\end{tabular}
%Source: https://freestatistics.org/blog/index.php?pk=123269&T=1

[TABLE]
[ROW][C]Standard Deviation-Mean Plot[/C][/ROW]
[ROW][C]Section[/C][C]Mean[/C][C]Standard Deviation[/C][C]Range[/C][/ROW]
[ROW][C]1[/C][C]757.5[/C][C]41.9324854180304[/C][C]90[/C][/ROW]
[ROW][C]2[/C][C]867.5[/C][C]46.4578662158878[/C][C]110[/C][/ROW]
[ROW][C]3[/C][C]850[/C][C]45.4606056566195[/C][C]100[/C][/ROW]
[ROW][C]4[/C][C]777.5[/C][C]70.8872343937891[/C][C]150[/C][/ROW]
[ROW][C]5[/C][C]935[/C][C]108.781125813871[/C][C]260[/C][/ROW]
[ROW][C]6[/C][C]855[/C][C]98.1495457622364[/C][C]210[/C][/ROW]
[ROW][C]7[/C][C]742.5[/C][C]53.1507290636732[/C][C]130[/C][/ROW]
[ROW][C]8[/C][C]912.5[/C][C]94.2956343987709[/C][C]230[/C][/ROW]
[ROW][C]9[/C][C]865[/C][C]97.4679434480896[/C][C]210[/C][/ROW]
[ROW][C]10[/C][C]757.5[/C][C]55[/C][C]130[/C][/ROW]
[ROW][C]11[/C][C]880[/C][C]80.4155872120988[/C][C]170[/C][/ROW]
[ROW][C]12[/C][C]857.5[/C][C]78.049129826454[/C][C]170[/C][/ROW]
[ROW][C]13[/C][C]732.5[/C][C]82.2090830342568[/C][C]180[/C][/ROW]
[ROW][C]14[/C][C]885[/C][C]77.6745346515403[/C][C]180[/C][/ROW]
[ROW][C]15[/C][C]897.5[/C][C]89.9536917900909[/C][C]190[/C][/ROW]
[ROW][C]16[/C][C]727.5[/C][C]98.1070843517429[/C][C]220[/C][/ROW]
[ROW][C]17[/C][C]892.5[/C][C]115.866302262565[/C][C]270[/C][/ROW]
[ROW][C]18[/C][C]877.5[/C][C]97.4251849711699[/C][C]210[/C][/ROW]
[ROW][C]19[/C][C]735[/C][C]64.5497224367903[/C][C]130[/C][/ROW]
[ROW][C]20[/C][C]900[/C][C]84.0634680861233[/C][C]200[/C][/ROW]
[ROW][C]21[/C][C]885[/C][C]105.356537528527[/C][C]210[/C][/ROW]
[ROW][C]22[/C][C]770[/C][C]52.2812904711937[/C][C]110[/C][/ROW]
[ROW][C]23[/C][C]927.5[/C][C]88.4590300647707[/C][C]210[/C][/ROW]
[ROW][C]24[/C][C]867.5[/C][C]9.57427107756338[/C][C]20[/C][/ROW]
[ROW][C]25[/C][C]755[/C][C]82.2597511950204[/C][C]180[/C][/ROW]
[ROW][C]26[/C][C]897.5[/C][C]50.5799696849784[/C][C]100[/C][/ROW]
[ROW][C]27[/C][C]815[/C][C]58.022983951764[/C][C]110[/C][/ROW]
[/TABLE]
Source: https://freestatistics.org/blog/index.php?pk=123269&T=1

Globally Unique Identifier (entire table): ba.freestatistics.org/blog/index.php?pk=123269&T=1

As an alternative you can also use a QR Code:  

The GUIDs for individual cells are displayed in the table below:

Standard Deviation-Mean Plot
SectionMeanStandard DeviationRange
1757.541.932485418030490
2867.546.4578662158878110
385045.4606056566195100
4777.570.8872343937891150
5935108.781125813871260
685598.1495457622364210
7742.553.1507290636732130
8912.594.2956343987709230
986597.4679434480896210
10757.555130
1188080.4155872120988170
12857.578.049129826454170
13732.582.2090830342568180
1488577.6745346515403180
15897.589.9536917900909190
16727.598.1070843517429220
17892.5115.866302262565270
18877.597.4251849711699210
1973564.5497224367903130
2090084.0634680861233200
21885105.356537528527210
2277052.2812904711937110
23927.588.4590300647707210
24867.59.5742710775633820
2575582.2597511950204180
26897.550.5799696849784100
2781558.022983951764110


Regression: S.E.(k) = alpha + beta * Mean(k)
alpha-26.1348919302047
beta0.12076794672928
S.D.0.0697296554497406
T-STAT1.73194526705108
p-value0.0956065437205028

\begin{tabular}{lllllllll}
\hline
Regression: S.E.(k) = alpha + beta * Mean(k) \tabularnewline
alpha & -26.1348919302047 \tabularnewline
beta & 0.12076794672928 \tabularnewline
S.D. & 0.0697296554497406 \tabularnewline
T-STAT & 1.73194526705108 \tabularnewline
p-value & 0.0956065437205028 \tabularnewline
\hline
\end{tabular}
%Source: https://freestatistics.org/blog/index.php?pk=123269&T=2

[TABLE]
[ROW][C]Regression: S.E.(k) = alpha + beta * Mean(k)[/C][/ROW]
[ROW][C]alpha[/C][C]-26.1348919302047[/C][/ROW]
[ROW][C]beta[/C][C]0.12076794672928[/C][/ROW]
[ROW][C]S.D.[/C][C]0.0697296554497406[/C][/ROW]
[ROW][C]T-STAT[/C][C]1.73194526705108[/C][/ROW]
[ROW][C]p-value[/C][C]0.0956065437205028[/C][/ROW]
[/TABLE]
Source: https://freestatistics.org/blog/index.php?pk=123269&T=2

Globally Unique Identifier (entire table): ba.freestatistics.org/blog/index.php?pk=123269&T=2

As an alternative you can also use a QR Code:  

The GUIDs for individual cells are displayed in the table below:

Regression: S.E.(k) = alpha + beta * Mean(k)
alpha-26.1348919302047
beta0.12076794672928
S.D.0.0697296554497406
T-STAT1.73194526705108
p-value0.0956065437205028


Regression: ln S.E.(k) = alpha + beta * ln Mean(k)
alpha-2.56108468866421
beta1.00996679074099
S.D.1.1773695047692
T-STAT0.857816332638048
p-value0.399143316660776
Lambda-0.00996679074099016

\begin{tabular}{lllllllll}
\hline
Regression: ln S.E.(k) = alpha + beta * ln Mean(k) \tabularnewline
alpha & -2.56108468866421 \tabularnewline
beta & 1.00996679074099 \tabularnewline
S.D. & 1.1773695047692 \tabularnewline
T-STAT & 0.857816332638048 \tabularnewline
p-value & 0.399143316660776 \tabularnewline
Lambda & -0.00996679074099016 \tabularnewline
\hline
\end{tabular}
%Source: https://freestatistics.org/blog/index.php?pk=123269&T=3

[TABLE]
[ROW][C]Regression: ln S.E.(k) = alpha + beta * ln Mean(k)[/C][/ROW]
[ROW][C]alpha[/C][C]-2.56108468866421[/C][/ROW]
[ROW][C]beta[/C][C]1.00996679074099[/C][/ROW]
[ROW][C]S.D.[/C][C]1.1773695047692[/C][/ROW]
[ROW][C]T-STAT[/C][C]0.857816332638048[/C][/ROW]
[ROW][C]p-value[/C][C]0.399143316660776[/C][/ROW]
[ROW][C]Lambda[/C][C]-0.00996679074099016[/C][/ROW]
[/TABLE]
Source: https://freestatistics.org/blog/index.php?pk=123269&T=3

Globally Unique Identifier (entire table): ba.freestatistics.org/blog/index.php?pk=123269&T=3

As an alternative you can also use a QR Code:  

The GUIDs for individual cells are displayed in the table below:

Regression: ln S.E.(k) = alpha + beta * ln Mean(k)
alpha-2.56108468866421
beta1.00996679074099
S.D.1.1773695047692
T-STAT0.857816332638048
p-value0.399143316660776
Lambda-0.00996679074099016


Parameters (Session):
par1 = 4 ;
Parameters (R input):
par1 = 4 ;
R code (references can be found in the software module):
par1 <- as.numeric(par1)
(n <- length(x))
(np <- floor(n / par1))
arr <- array(NA,dim=c(par1,np))
j <- 0
k <- 1
for (i in 1:(np*par1))
{
j = j + 1
arr[j,k] <- x[i]
if (j == par1) {
j = 0
k=k+1
}
}
arr
arr.mean <- array(NA,dim=np)
arr.sd <- array(NA,dim=np)
arr.range <- array(NA,dim=np)
for (j in 1:np)
{
arr.mean[j] <- mean(arr[,j],na.rm=TRUE)
arr.sd[j] <- sd(arr[,j],na.rm=TRUE)
arr.range[j] <- max(arr[,j],na.rm=TRUE) - min(arr[,j],na.rm=TRUE)
}
arr.mean
arr.sd
arr.range
(lm1 <- lm(arr.sd~arr.mean))
(lnlm1 <- lm(log(arr.sd)~log(arr.mean)))
(lm2 <- lm(arr.range~arr.mean))
bitmap(file='test1.png')
plot(arr.mean,arr.sd,main='Standard Deviation-Mean Plot',xlab='mean',ylab='standard deviation')
dev.off()
bitmap(file='test2.png')
plot(arr.mean,arr.range,main='Range-Mean Plot',xlab='mean',ylab='range')
dev.off()
load(file='createtable')
a<-table.start()
a<-table.row.start(a)
a<-table.element(a,'Standard Deviation-Mean Plot',4,TRUE)
a<-table.row.end(a)
a<-table.row.start(a)
a<-table.element(a,'Section',header=TRUE)
a<-table.element(a,'Mean',header=TRUE)
a<-table.element(a,'Standard Deviation',header=TRUE)
a<-table.element(a,'Range',header=TRUE)
a<-table.row.end(a)
for (j in 1:np) {
a<-table.row.start(a)
a<-table.element(a,j,header=TRUE)
a<-table.element(a,arr.mean[j])
a<-table.element(a,arr.sd[j] )
a<-table.element(a,arr.range[j] )
a<-table.row.end(a)
}
a<-table.end(a)
table.save(a,file='mytable.tab')
a<-table.start()
a<-table.row.start(a)
a<-table.element(a,'Regression: S.E.(k) = alpha + beta * Mean(k)',2,TRUE)
a<-table.row.end(a)
a<-table.row.start(a)
a<-table.element(a,'alpha',header=TRUE)
a<-table.element(a,lm1$coefficients[[1]])
a<-table.row.end(a)
a<-table.row.start(a)
a<-table.element(a,'beta',header=TRUE)
a<-table.element(a,lm1$coefficients[[2]])
a<-table.row.end(a)
a<-table.row.start(a)
a<-table.element(a,'S.D.',header=TRUE)
a<-table.element(a,summary(lm1)$coefficients[2,2])
a<-table.row.end(a)
a<-table.row.start(a)
a<-table.element(a,'T-STAT',header=TRUE)
a<-table.element(a,summary(lm1)$coefficients[2,3])
a<-table.row.end(a)
a<-table.row.start(a)
a<-table.element(a,'p-value',header=TRUE)
a<-table.element(a,summary(lm1)$coefficients[2,4])
a<-table.row.end(a)
a<-table.end(a)
table.save(a,file='mytable1.tab')
a<-table.start()
a<-table.row.start(a)
a<-table.element(a,'Regression: ln S.E.(k) = alpha + beta * ln Mean(k)',2,TRUE)
a<-table.row.end(a)
a<-table.row.start(a)
a<-table.element(a,'alpha',header=TRUE)
a<-table.element(a,lnlm1$coefficients[[1]])
a<-table.row.end(a)
a<-table.row.start(a)
a<-table.element(a,'beta',header=TRUE)
a<-table.element(a,lnlm1$coefficients[[2]])
a<-table.row.end(a)
a<-table.row.start(a)
a<-table.element(a,'S.D.',header=TRUE)
a<-table.element(a,summary(lnlm1)$coefficients[2,2])
a<-table.row.end(a)
a<-table.row.start(a)
a<-table.element(a,'T-STAT',header=TRUE)
a<-table.element(a,summary(lnlm1)$coefficients[2,3])
a<-table.row.end(a)
a<-table.row.start(a)
a<-table.element(a,'p-value',header=TRUE)
a<-table.element(a,summary(lnlm1)$coefficients[2,4])
a<-table.row.end(a)
a<-table.row.start(a)
a<-table.element(a,'Lambda',header=TRUE)
a<-table.element(a,1-lnlm1$coefficients[[2]])
a<-table.row.end(a)
a<-table.end(a)
table.save(a,file='mytable2.tab')