Free Statistics

of Irreproducible Research!

Author's title

Author*Unverified author*
R Software Modulerwasp_smp.wasp
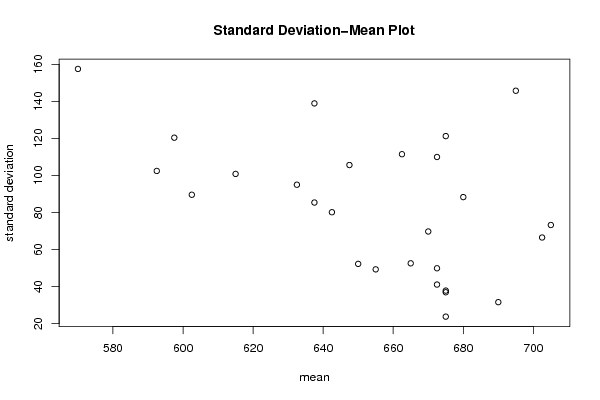
Title produced by softwareStandard Deviation-Mean Plot
Date of computationMon, 01 Aug 2011 04:58:57 -0400
Cite this page as followsStatistical Computations at FreeStatistics.org, Office for Research Development and Education, URL https://freestatistics.org/blog/index.php?v=date/2011/Aug/01/t1312189183aapwcwgr8nipfwb.htm/, Retrieved Tue, 14 May 2024 02:41:01 +0000
Statistical Computations at FreeStatistics.org, Office for Research Development and Education, URL https://freestatistics.org/blog/index.php?pk=123230, Retrieved Tue, 14 May 2024 02:41:01 +0000
QR Codes:

Original text written by user:
IsPrivate?No (this computation is public)
User-defined keywordsvicky koopmans
Estimated Impact141
Family? (F = Feedback message, R = changed R code, M = changed R Module, P = changed Parameters, D = changed Data)
-       [Standard Deviation-Mean Plot] [tijdreeks2-stap21] [2011-08-01 08:58:57] [30681199eb2b91d06bf445c1ee7d20a2] [Current]
Feedback Forum

Post a new message
Dataseries X:
700
700
620
680
700
670
660
730
680
680
650
800
660
710
660
590
660
710
620
700
690
680
640
810
620
700
720
620
630
680
670
720
660
630
620
810
540
690
720
620
650
690
660
700
630
590
570
760
500
660
750
680
710
620
640
720
680
580
530
740
480
640
690
600
640
580
690
690
720
550
510
680
450
560
730
650
680
580
750
670
670
590
480
810
350
570
710
650
710
510
800
680
660
620
580
830
480
550
720
620
730
520
870
660
650
620
560
820


Summary of computational transaction
Raw Inputview raw input (R code)
Raw Outputview raw output of R engine
Computing time1 seconds
R Server'Gertrude Mary Cox' @ cox.wessa.net

\begin{tabular}{lllllllll}
\hline
Summary of computational transaction \tabularnewline
Raw Input & view raw input (R code)  \tabularnewline
Raw Output & view raw output of R engine  \tabularnewline
Computing time & 1 seconds \tabularnewline
R Server & 'Gertrude Mary Cox' @ cox.wessa.net \tabularnewline
\hline
\end{tabular}
%Source: https://freestatistics.org/blog/index.php?pk=123230&T=0

[TABLE]
[ROW][C]Summary of computational transaction[/C][/ROW]
[ROW][C]Raw Input[/C][C]view raw input (R code) [/C][/ROW]
[ROW][C]Raw Output[/C][C]view raw output of R engine [/C][/ROW]
[ROW][C]Computing time[/C][C]1 seconds[/C][/ROW]
[ROW][C]R Server[/C][C]'Gertrude Mary Cox' @ cox.wessa.net[/C][/ROW]
[/TABLE]
Source: https://freestatistics.org/blog/index.php?pk=123230&T=0

Globally Unique Identifier (entire table): ba.freestatistics.org/blog/index.php?pk=123230&T=0

As an alternative you can also use a QR Code:  

The GUIDs for individual cells are displayed in the table below:

Summary of computational transaction
Raw Inputview raw input (R code)
Raw Outputview raw output of R engine
Computing time1 seconds
R Server'Gertrude Mary Cox' @ cox.wessa.net


Standard Deviation-Mean Plot
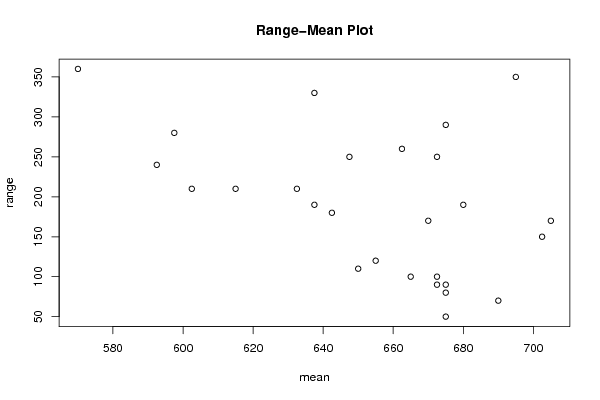
SectionMeanStandard DeviationRange
167537.859388972001880
269031.622776601683870
3702.566.5206734782504150
465549.3288286231625120
5672.541.129875597510290
670573.2575365861197170
766552.5991127935317100
867536.968455021364790
968088.3176086632785190
10642.580.156097709407180
1167523.804761428476250
12637.585.3912563829967190
13647.5105.633012516606250
14672.549.9165971062398100
15632.595210
16602.589.5823643358446210
1765052.2812904711937110
18615100.829889748361210
19597.5120.381338531629280
2067069.7614984548545170
21637.5138.894444333338330
22570157.480157480236360
23675121.243556529821290
24672.5109.962114688045250
25592.5102.428837085396240
26695145.716619962629350
27662.5111.46748404804260

\begin{tabular}{lllllllll}
\hline
Standard Deviation-Mean Plot \tabularnewline
Section & Mean & Standard Deviation & Range \tabularnewline
1 & 675 & 37.8593889720018 & 80 \tabularnewline
2 & 690 & 31.6227766016838 & 70 \tabularnewline
3 & 702.5 & 66.5206734782504 & 150 \tabularnewline
4 & 655 & 49.3288286231625 & 120 \tabularnewline
5 & 672.5 & 41.1298755975102 & 90 \tabularnewline
6 & 705 & 73.2575365861197 & 170 \tabularnewline
7 & 665 & 52.5991127935317 & 100 \tabularnewline
8 & 675 & 36.9684550213647 & 90 \tabularnewline
9 & 680 & 88.3176086632785 & 190 \tabularnewline
10 & 642.5 & 80.156097709407 & 180 \tabularnewline
11 & 675 & 23.8047614284762 & 50 \tabularnewline
12 & 637.5 & 85.3912563829967 & 190 \tabularnewline
13 & 647.5 & 105.633012516606 & 250 \tabularnewline
14 & 672.5 & 49.9165971062398 & 100 \tabularnewline
15 & 632.5 & 95 & 210 \tabularnewline
16 & 602.5 & 89.5823643358446 & 210 \tabularnewline
17 & 650 & 52.2812904711937 & 110 \tabularnewline
18 & 615 & 100.829889748361 & 210 \tabularnewline
19 & 597.5 & 120.381338531629 & 280 \tabularnewline
20 & 670 & 69.7614984548545 & 170 \tabularnewline
21 & 637.5 & 138.894444333338 & 330 \tabularnewline
22 & 570 & 157.480157480236 & 360 \tabularnewline
23 & 675 & 121.243556529821 & 290 \tabularnewline
24 & 672.5 & 109.962114688045 & 250 \tabularnewline
25 & 592.5 & 102.428837085396 & 240 \tabularnewline
26 & 695 & 145.716619962629 & 350 \tabularnewline
27 & 662.5 & 111.46748404804 & 260 \tabularnewline
\hline
\end{tabular}
%Source: https://freestatistics.org/blog/index.php?pk=123230&T=1

[TABLE]
[ROW][C]Standard Deviation-Mean Plot[/C][/ROW]
[ROW][C]Section[/C][C]Mean[/C][C]Standard Deviation[/C][C]Range[/C][/ROW]
[ROW][C]1[/C][C]675[/C][C]37.8593889720018[/C][C]80[/C][/ROW]
[ROW][C]2[/C][C]690[/C][C]31.6227766016838[/C][C]70[/C][/ROW]
[ROW][C]3[/C][C]702.5[/C][C]66.5206734782504[/C][C]150[/C][/ROW]
[ROW][C]4[/C][C]655[/C][C]49.3288286231625[/C][C]120[/C][/ROW]
[ROW][C]5[/C][C]672.5[/C][C]41.1298755975102[/C][C]90[/C][/ROW]
[ROW][C]6[/C][C]705[/C][C]73.2575365861197[/C][C]170[/C][/ROW]
[ROW][C]7[/C][C]665[/C][C]52.5991127935317[/C][C]100[/C][/ROW]
[ROW][C]8[/C][C]675[/C][C]36.9684550213647[/C][C]90[/C][/ROW]
[ROW][C]9[/C][C]680[/C][C]88.3176086632785[/C][C]190[/C][/ROW]
[ROW][C]10[/C][C]642.5[/C][C]80.156097709407[/C][C]180[/C][/ROW]
[ROW][C]11[/C][C]675[/C][C]23.8047614284762[/C][C]50[/C][/ROW]
[ROW][C]12[/C][C]637.5[/C][C]85.3912563829967[/C][C]190[/C][/ROW]
[ROW][C]13[/C][C]647.5[/C][C]105.633012516606[/C][C]250[/C][/ROW]
[ROW][C]14[/C][C]672.5[/C][C]49.9165971062398[/C][C]100[/C][/ROW]
[ROW][C]15[/C][C]632.5[/C][C]95[/C][C]210[/C][/ROW]
[ROW][C]16[/C][C]602.5[/C][C]89.5823643358446[/C][C]210[/C][/ROW]
[ROW][C]17[/C][C]650[/C][C]52.2812904711937[/C][C]110[/C][/ROW]
[ROW][C]18[/C][C]615[/C][C]100.829889748361[/C][C]210[/C][/ROW]
[ROW][C]19[/C][C]597.5[/C][C]120.381338531629[/C][C]280[/C][/ROW]
[ROW][C]20[/C][C]670[/C][C]69.7614984548545[/C][C]170[/C][/ROW]
[ROW][C]21[/C][C]637.5[/C][C]138.894444333338[/C][C]330[/C][/ROW]
[ROW][C]22[/C][C]570[/C][C]157.480157480236[/C][C]360[/C][/ROW]
[ROW][C]23[/C][C]675[/C][C]121.243556529821[/C][C]290[/C][/ROW]
[ROW][C]24[/C][C]672.5[/C][C]109.962114688045[/C][C]250[/C][/ROW]
[ROW][C]25[/C][C]592.5[/C][C]102.428837085396[/C][C]240[/C][/ROW]
[ROW][C]26[/C][C]695[/C][C]145.716619962629[/C][C]350[/C][/ROW]
[ROW][C]27[/C][C]662.5[/C][C]111.46748404804[/C][C]260[/C][/ROW]
[/TABLE]
Source: https://freestatistics.org/blog/index.php?pk=123230&T=1

Globally Unique Identifier (entire table): ba.freestatistics.org/blog/index.php?pk=123230&T=1

As an alternative you can also use a QR Code:  

The GUIDs for individual cells are displayed in the table below:

Standard Deviation-Mean Plot
SectionMeanStandard DeviationRange
167537.859388972001880
269031.622776601683870
3702.566.5206734782504150
465549.3288286231625120
5672.541.129875597510290
670573.2575365861197170
766552.5991127935317100
867536.968455021364790
968088.3176086632785190
10642.580.156097709407180
1167523.804761428476250
12637.585.3912563829967190
13647.5105.633012516606250
14672.549.9165971062398100
15632.595210
16602.589.5823643358446210
1765052.2812904711937110
18615100.829889748361210
19597.5120.381338531629280
2067069.7614984548545170
21637.5138.894444333338330
22570157.480157480236360
23675121.243556529821290
24672.5109.962114688045250
25592.5102.428837085396240
26695145.716619962629350
27662.5111.46748404804260


Regression: S.E.(k) = alpha + beta * Mean(k)
alpha414.269759359981
beta-0.506452408409196
S.D.0.186316788316792
T-STAT-2.71823281726003
p-value0.0117510165532353

\begin{tabular}{lllllllll}
\hline
Regression: S.E.(k) = alpha + beta * Mean(k) \tabularnewline
alpha & 414.269759359981 \tabularnewline
beta & -0.506452408409196 \tabularnewline
S.D. & 0.186316788316792 \tabularnewline
T-STAT & -2.71823281726003 \tabularnewline
p-value & 0.0117510165532353 \tabularnewline
\hline
\end{tabular}
%Source: https://freestatistics.org/blog/index.php?pk=123230&T=2

[TABLE]
[ROW][C]Regression: S.E.(k) = alpha + beta * Mean(k)[/C][/ROW]
[ROW][C]alpha[/C][C]414.269759359981[/C][/ROW]
[ROW][C]beta[/C][C]-0.506452408409196[/C][/ROW]
[ROW][C]S.D.[/C][C]0.186316788316792[/C][/ROW]
[ROW][C]T-STAT[/C][C]-2.71823281726003[/C][/ROW]
[ROW][C]p-value[/C][C]0.0117510165532353[/C][/ROW]
[/TABLE]
Source: https://freestatistics.org/blog/index.php?pk=123230&T=2

Globally Unique Identifier (entire table): ba.freestatistics.org/blog/index.php?pk=123230&T=2

As an alternative you can also use a QR Code:  

The GUIDs for individual cells are displayed in the table below:

Regression: S.E.(k) = alpha + beta * Mean(k)
alpha414.269759359981
beta-0.506452408409196
S.D.0.186316788316792
T-STAT-2.71823281726003
p-value0.0117510165532353


Regression: ln S.E.(k) = alpha + beta * ln Mean(k)
alpha32.6027015080696
beta-4.36509760514597
S.D.1.63700120681786
T-STAT-2.66652070075819
p-value0.0132435522063269
Lambda5.36509760514597

\begin{tabular}{lllllllll}
\hline
Regression: ln S.E.(k) = alpha + beta * ln Mean(k) \tabularnewline
alpha & 32.6027015080696 \tabularnewline
beta & -4.36509760514597 \tabularnewline
S.D. & 1.63700120681786 \tabularnewline
T-STAT & -2.66652070075819 \tabularnewline
p-value & 0.0132435522063269 \tabularnewline
Lambda & 5.36509760514597 \tabularnewline
\hline
\end{tabular}
%Source: https://freestatistics.org/blog/index.php?pk=123230&T=3

[TABLE]
[ROW][C]Regression: ln S.E.(k) = alpha + beta * ln Mean(k)[/C][/ROW]
[ROW][C]alpha[/C][C]32.6027015080696[/C][/ROW]
[ROW][C]beta[/C][C]-4.36509760514597[/C][/ROW]
[ROW][C]S.D.[/C][C]1.63700120681786[/C][/ROW]
[ROW][C]T-STAT[/C][C]-2.66652070075819[/C][/ROW]
[ROW][C]p-value[/C][C]0.0132435522063269[/C][/ROW]
[ROW][C]Lambda[/C][C]5.36509760514597[/C][/ROW]
[/TABLE]
Source: https://freestatistics.org/blog/index.php?pk=123230&T=3

Globally Unique Identifier (entire table): ba.freestatistics.org/blog/index.php?pk=123230&T=3

As an alternative you can also use a QR Code:  

The GUIDs for individual cells are displayed in the table below:

Regression: ln S.E.(k) = alpha + beta * ln Mean(k)
alpha32.6027015080696
beta-4.36509760514597
S.D.1.63700120681786
T-STAT-2.66652070075819
p-value0.0132435522063269
Lambda5.36509760514597


Parameters (Session):
par1 = 4 ;
Parameters (R input):
par1 = 4 ;
R code (references can be found in the software module):
par1 <- as.numeric(par1)
(n <- length(x))
(np <- floor(n / par1))
arr <- array(NA,dim=c(par1,np))
j <- 0
k <- 1
for (i in 1:(np*par1))
{
j = j + 1
arr[j,k] <- x[i]
if (j == par1) {
j = 0
k=k+1
}
}
arr
arr.mean <- array(NA,dim=np)
arr.sd <- array(NA,dim=np)
arr.range <- array(NA,dim=np)
for (j in 1:np)
{
arr.mean[j] <- mean(arr[,j],na.rm=TRUE)
arr.sd[j] <- sd(arr[,j],na.rm=TRUE)
arr.range[j] <- max(arr[,j],na.rm=TRUE) - min(arr[,j],na.rm=TRUE)
}
arr.mean
arr.sd
arr.range
(lm1 <- lm(arr.sd~arr.mean))
(lnlm1 <- lm(log(arr.sd)~log(arr.mean)))
(lm2 <- lm(arr.range~arr.mean))
bitmap(file='test1.png')
plot(arr.mean,arr.sd,main='Standard Deviation-Mean Plot',xlab='mean',ylab='standard deviation')
dev.off()
bitmap(file='test2.png')
plot(arr.mean,arr.range,main='Range-Mean Plot',xlab='mean',ylab='range')
dev.off()
load(file='createtable')
a<-table.start()
a<-table.row.start(a)
a<-table.element(a,'Standard Deviation-Mean Plot',4,TRUE)
a<-table.row.end(a)
a<-table.row.start(a)
a<-table.element(a,'Section',header=TRUE)
a<-table.element(a,'Mean',header=TRUE)
a<-table.element(a,'Standard Deviation',header=TRUE)
a<-table.element(a,'Range',header=TRUE)
a<-table.row.end(a)
for (j in 1:np) {
a<-table.row.start(a)
a<-table.element(a,j,header=TRUE)
a<-table.element(a,arr.mean[j])
a<-table.element(a,arr.sd[j] )
a<-table.element(a,arr.range[j] )
a<-table.row.end(a)
}
a<-table.end(a)
table.save(a,file='mytable.tab')
a<-table.start()
a<-table.row.start(a)
a<-table.element(a,'Regression: S.E.(k) = alpha + beta * Mean(k)',2,TRUE)
a<-table.row.end(a)
a<-table.row.start(a)
a<-table.element(a,'alpha',header=TRUE)
a<-table.element(a,lm1$coefficients[[1]])
a<-table.row.end(a)
a<-table.row.start(a)
a<-table.element(a,'beta',header=TRUE)
a<-table.element(a,lm1$coefficients[[2]])
a<-table.row.end(a)
a<-table.row.start(a)
a<-table.element(a,'S.D.',header=TRUE)
a<-table.element(a,summary(lm1)$coefficients[2,2])
a<-table.row.end(a)
a<-table.row.start(a)
a<-table.element(a,'T-STAT',header=TRUE)
a<-table.element(a,summary(lm1)$coefficients[2,3])
a<-table.row.end(a)
a<-table.row.start(a)
a<-table.element(a,'p-value',header=TRUE)
a<-table.element(a,summary(lm1)$coefficients[2,4])
a<-table.row.end(a)
a<-table.end(a)
table.save(a,file='mytable1.tab')
a<-table.start()
a<-table.row.start(a)
a<-table.element(a,'Regression: ln S.E.(k) = alpha + beta * ln Mean(k)',2,TRUE)
a<-table.row.end(a)
a<-table.row.start(a)
a<-table.element(a,'alpha',header=TRUE)
a<-table.element(a,lnlm1$coefficients[[1]])
a<-table.row.end(a)
a<-table.row.start(a)
a<-table.element(a,'beta',header=TRUE)
a<-table.element(a,lnlm1$coefficients[[2]])
a<-table.row.end(a)
a<-table.row.start(a)
a<-table.element(a,'S.D.',header=TRUE)
a<-table.element(a,summary(lnlm1)$coefficients[2,2])
a<-table.row.end(a)
a<-table.row.start(a)
a<-table.element(a,'T-STAT',header=TRUE)
a<-table.element(a,summary(lnlm1)$coefficients[2,3])
a<-table.row.end(a)
a<-table.row.start(a)
a<-table.element(a,'p-value',header=TRUE)
a<-table.element(a,summary(lnlm1)$coefficients[2,4])
a<-table.row.end(a)
a<-table.row.start(a)
a<-table.element(a,'Lambda',header=TRUE)
a<-table.element(a,1-lnlm1$coefficients[[2]])
a<-table.row.end(a)
a<-table.end(a)
table.save(a,file='mytable2.tab')