Free Statistics
of Irreproducible Research!
Description of Statistical Computation | |||||||||||||||||||||||||||||||||||||||||
|---|---|---|---|---|---|---|---|---|---|---|---|---|---|---|---|---|---|---|---|---|---|---|---|---|---|---|---|---|---|---|---|---|---|---|---|---|---|---|---|---|---|
| Author's title | |||||||||||||||||||||||||||||||||||||||||
| Author | *Unverified author* | ||||||||||||||||||||||||||||||||||||||||
| R Software Module | rwasp_univariatedataseries.wasp | ||||||||||||||||||||||||||||||||||||||||
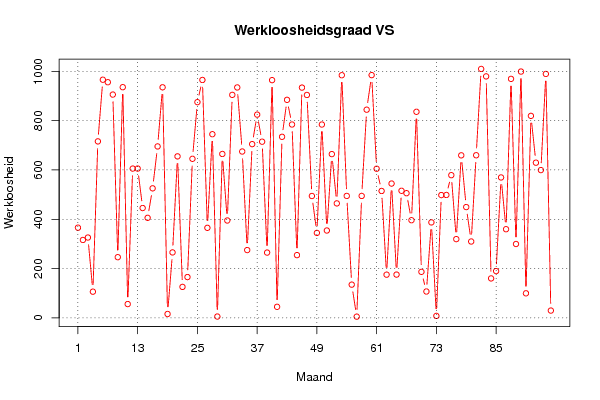
| Title produced by software | Univariate Data Series | ||||||||||||||||||||||||||||||||||||||||
| Date of computation | Sat, 30 Apr 2011 12:32:11 +0000 | ||||||||||||||||||||||||||||||||||||||||
| Cite this page as follows | Statistical Computations at FreeStatistics.org, Office for Research Development and Education, URL https://freestatistics.org/blog/index.php?v=date/2011/Apr/30/t130416677002wadyip7svlycn.htm/, Retrieved Thu, 09 May 2024 16:38:26 +0000 | ||||||||||||||||||||||||||||||||||||||||
| Statistical Computations at FreeStatistics.org, Office for Research Development and Education, URL https://freestatistics.org/blog/index.php?pk=120705, Retrieved Thu, 09 May 2024 16:38:26 +0000 | |||||||||||||||||||||||||||||||||||||||||
| QR Codes: | |||||||||||||||||||||||||||||||||||||||||
|
| |||||||||||||||||||||||||||||||||||||||||
| Original text written by user: | |||||||||||||||||||||||||||||||||||||||||
| IsPrivate? | No (this computation is public) | ||||||||||||||||||||||||||||||||||||||||
| User-defined keywords | |||||||||||||||||||||||||||||||||||||||||
| Estimated Impact | 226 | ||||||||||||||||||||||||||||||||||||||||
Tree of Dependent Computations | |||||||||||||||||||||||||||||||||||||||||
| Family? (F = Feedback message, R = changed R code, M = changed R Module, P = changed Parameters, D = changed Data) | |||||||||||||||||||||||||||||||||||||||||
| - [Univariate Data Series] [Datareeks-Werkloo...] [2011-04-30 12:32:11] [d41d8cd98f00b204e9800998ecf8427e] [Current] | |||||||||||||||||||||||||||||||||||||||||
| Feedback Forum | |||||||||||||||||||||||||||||||||||||||||
Post a new message | |||||||||||||||||||||||||||||||||||||||||
Dataset | |||||||||||||||||||||||||||||||||||||||||
| Dataseries X: | |||||||||||||||||||||||||||||||||||||||||
365,8 315,9 325,9 106,0 716,1 966,3 956,2 906,1 246,1 936,0 55,8 605,7 605,7 445,6 405,8 525,6 695,6 935,6 15,5 265,4 655,4 125,5 165,4 645,4 875,3 965,4 365,2 745,2 5,1 665,0 395,0 904,9 935,0 675,0 275,0 704,9 824,7 714,8 264,7 964,7 44,6 734,6 884,7 784,7 254,5 934,4 904,5 494,4 344,6 784,5 354,4 664,5 464,4 984,6 494,7 134,6 4,7 494,7 844,7 985,0 605,0 514,8 175,1 544,9 175,4 515,6 505,8 396,1 836,2 186,6 106,8 387,3 7,8 498,2 498,6 578,9 319,4 659,5 449,5 309,7 659,8 1010,1 979,9 159,9 189,7 569,7 359,7 969,8 299,6 999,5 99,5 819,6 629,6 599,7 989,8 29,4 | |||||||||||||||||||||||||||||||||||||||||
Tables (Output of Computation) | |||||||||||||||||||||||||||||||||||||||||
| |||||||||||||||||||||||||||||||||||||||||
Figures (Output of Computation) | |||||||||||||||||||||||||||||||||||||||||
Input Parameters & R Code | |||||||||||||||||||||||||||||||||||||||||
| Parameters (Session): | |||||||||||||||||||||||||||||||||||||||||
| par1 = Werkloosheidsgraad VS ; par2 = http://www.economagic.com/em-cgi/data.exe/fedstl/unrate ; par3 = Geeft de werkloosheidsgraad weer in de VS over de periode van 2003 - 2010 per maand. ; par4 = 12 ; | |||||||||||||||||||||||||||||||||||||||||
| Parameters (R input): | |||||||||||||||||||||||||||||||||||||||||
| par1 = Werkloosheidsgraad VS ; par2 = http://www.economagic.com/em-cgi/data.exe/fedstl/unrate ; par3 = Geeft de werkloosheidsgraad weer in de VS over de periode van 2003 - 2010 per maand. ; par4 = 12 ; | |||||||||||||||||||||||||||||||||||||||||
| R code (references can be found in the software module): | |||||||||||||||||||||||||||||||||||||||||
if (par4 != 'No season') { | |||||||||||||||||||||||||||||||||||||||||