Free Statistics

of Irreproducible Research!

Author's title

Author*Unverified author*
R Software Modulerwasp_autocorrelation.wasp
Title produced by software(Partial) Autocorrelation Function
Date of computationWed, 27 Apr 2011 19:58:41 +0000
Cite this page as followsStatistical Computations at FreeStatistics.org, Office for Research Development and Education, URL https://freestatistics.org/blog/index.php?v=date/2011/Apr/27/t13039343097q32p9vby0bfm21.htm/, Retrieved Thu, 09 May 2024 18:41:57 +0000
Statistical Computations at FreeStatistics.org, Office for Research Development and Education, URL https://freestatistics.org/blog/index.php?pk=120684, Retrieved Thu, 09 May 2024 18:41:57 +0000
QR Codes:

Original text written by user:
IsPrivate?No (this computation is public)
User-defined keywordsKDGP2W12
Estimated Impact154
Family? (F = Feedback message, R = changed R code, M = changed R Module, P = changed Parameters, D = changed Data)
-       [(Partial) Autocorrelation Function] [autocorrelatie ve...] [2011-04-27 19:58:41] [cd3c8dd726b701571412eb3280c696e7] [Current]
Feedback Forum

Post a new message
Dataseries X:
814
1150
1225
1691
1759
1754
2100
2062
2012
1897
1964
2186
966
1549
1538
1612
2078
2137
2907
2249
1883
1739
1828
1868
1138
1430
1809
1763
2200
2067
2503
2141
2103
1972
2181
2344
970
1199
1718
1683
2025
2051
2439
2353
2230
1852
2147
2286
1007
1665
1642
1518
1831
2207
2822
2393
2306
1785
2047
2171
1212
1335
2011
1860
1954
2152
2835
2224
2182
1992
2389
2724
891
1247
2017
2257
2255
2255
3057
3330
1896
2096
2374
2535
1041
1728
2201
2455
2204
2660
3670
2665
2639
2226
2586
2684
1185
1749
2459
2618
2585
3310
3923


Summary of computational transaction
Raw Inputview raw input (R code)
Raw Outputview raw output of R engine
Computing time1 seconds
R Server'Herman Ole Andreas Wold' @ www.yougetit.org

\begin{tabular}{lllllllll}
\hline
Summary of computational transaction \tabularnewline
Raw Input & view raw input (R code)  \tabularnewline
Raw Output & view raw output of R engine  \tabularnewline
Computing time & 1 seconds \tabularnewline
R Server & 'Herman Ole Andreas Wold' @ www.yougetit.org \tabularnewline
\hline
\end{tabular}
%Source: https://freestatistics.org/blog/index.php?pk=120684&T=0

[TABLE]
[ROW][C]Summary of computational transaction[/C][/ROW]
[ROW][C]Raw Input[/C][C]view raw input (R code) [/C][/ROW]
[ROW][C]Raw Output[/C][C]view raw output of R engine [/C][/ROW]
[ROW][C]Computing time[/C][C]1 seconds[/C][/ROW]
[ROW][C]R Server[/C][C]'Herman Ole Andreas Wold' @ www.yougetit.org[/C][/ROW]
[/TABLE]
Source: https://freestatistics.org/blog/index.php?pk=120684&T=0

Globally Unique Identifier (entire table): ba.freestatistics.org/blog/index.php?pk=120684&T=0

As an alternative you can also use a QR Code:  

The GUIDs for individual cells are displayed in the table below:

Summary of computational transaction
Raw Inputview raw input (R code)
Raw Outputview raw output of R engine
Computing time1 seconds
R Server'Herman Ole Andreas Wold' @ www.yougetit.org


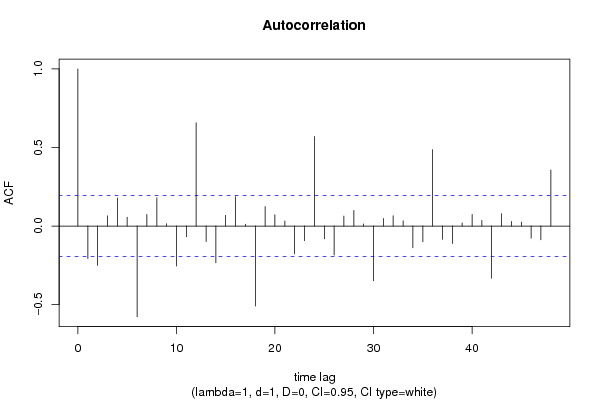
Autocorrelation Function
Time lag kACF(k)T-STATP-value
1-0.207262-2.09320.019404
2-0.250578-2.53070.006455
30.0644280.65070.258355
40.1787171.8050.037016
50.0561010.56660.286118
6-0.577169-5.82910
70.072990.73720.231359
80.1804621.82260.035649
90.0141880.14330.443173
10-0.254376-2.56910.005822
11-0.068058-0.68740.24671
120.6565226.63050
13-0.09859-0.99570.160873
14-0.233777-2.3610.010062
150.0676820.68360.247903
160.1872151.89080.030746
170.0115690.11680.453608
18-0.509154-5.14221e-06
190.1236621.24890.107276
200.0717590.72470.235138
210.0312210.31530.376581
22-0.177318-1.79080.038144
23-0.093229-0.94160.17432
240.5698215.75490
25-0.081781-0.82590.20538
26-0.18505-1.86890.032252
270.062970.6360.26311
280.0983840.99360.161377
290.013160.13290.447263
30-0.348286-3.51750.000326
310.0478780.48350.314873
320.0651330.65780.256071
330.0335540.33890.367699
34-0.138291-1.39670.082772
35-0.10025-1.01250.156852
360.486544.91382e-06
37-0.084926-0.85770.196532
38-0.111987-1.1310.130351
390.0194970.19690.422143
400.0737470.74480.229049
410.0351210.35470.361771
42-0.332614-3.35920.00055
430.0778230.7860.216851
440.029070.29360.384831
450.0248290.25080.401253
46-0.077214-0.77980.218652
47-0.087904-0.88780.188373
480.3569083.60460.000243

\begin{tabular}{lllllllll}
\hline
Autocorrelation Function \tabularnewline
Time lag k & ACF(k) & T-STAT & P-value \tabularnewline
1 & -0.207262 & -2.0932 & 0.019404 \tabularnewline
2 & -0.250578 & -2.5307 & 0.006455 \tabularnewline
3 & 0.064428 & 0.6507 & 0.258355 \tabularnewline
4 & 0.178717 & 1.805 & 0.037016 \tabularnewline
5 & 0.056101 & 0.5666 & 0.286118 \tabularnewline
6 & -0.577169 & -5.8291 & 0 \tabularnewline
7 & 0.07299 & 0.7372 & 0.231359 \tabularnewline
8 & 0.180462 & 1.8226 & 0.035649 \tabularnewline
9 & 0.014188 & 0.1433 & 0.443173 \tabularnewline
10 & -0.254376 & -2.5691 & 0.005822 \tabularnewline
11 & -0.068058 & -0.6874 & 0.24671 \tabularnewline
12 & 0.656522 & 6.6305 & 0 \tabularnewline
13 & -0.09859 & -0.9957 & 0.160873 \tabularnewline
14 & -0.233777 & -2.361 & 0.010062 \tabularnewline
15 & 0.067682 & 0.6836 & 0.247903 \tabularnewline
16 & 0.187215 & 1.8908 & 0.030746 \tabularnewline
17 & 0.011569 & 0.1168 & 0.453608 \tabularnewline
18 & -0.509154 & -5.1422 & 1e-06 \tabularnewline
19 & 0.123662 & 1.2489 & 0.107276 \tabularnewline
20 & 0.071759 & 0.7247 & 0.235138 \tabularnewline
21 & 0.031221 & 0.3153 & 0.376581 \tabularnewline
22 & -0.177318 & -1.7908 & 0.038144 \tabularnewline
23 & -0.093229 & -0.9416 & 0.17432 \tabularnewline
24 & 0.569821 & 5.7549 & 0 \tabularnewline
25 & -0.081781 & -0.8259 & 0.20538 \tabularnewline
26 & -0.18505 & -1.8689 & 0.032252 \tabularnewline
27 & 0.06297 & 0.636 & 0.26311 \tabularnewline
28 & 0.098384 & 0.9936 & 0.161377 \tabularnewline
29 & 0.01316 & 0.1329 & 0.447263 \tabularnewline
30 & -0.348286 & -3.5175 & 0.000326 \tabularnewline
31 & 0.047878 & 0.4835 & 0.314873 \tabularnewline
32 & 0.065133 & 0.6578 & 0.256071 \tabularnewline
33 & 0.033554 & 0.3389 & 0.367699 \tabularnewline
34 & -0.138291 & -1.3967 & 0.082772 \tabularnewline
35 & -0.10025 & -1.0125 & 0.156852 \tabularnewline
36 & 0.48654 & 4.9138 & 2e-06 \tabularnewline
37 & -0.084926 & -0.8577 & 0.196532 \tabularnewline
38 & -0.111987 & -1.131 & 0.130351 \tabularnewline
39 & 0.019497 & 0.1969 & 0.422143 \tabularnewline
40 & 0.073747 & 0.7448 & 0.229049 \tabularnewline
41 & 0.035121 & 0.3547 & 0.361771 \tabularnewline
42 & -0.332614 & -3.3592 & 0.00055 \tabularnewline
43 & 0.077823 & 0.786 & 0.216851 \tabularnewline
44 & 0.02907 & 0.2936 & 0.384831 \tabularnewline
45 & 0.024829 & 0.2508 & 0.401253 \tabularnewline
46 & -0.077214 & -0.7798 & 0.218652 \tabularnewline
47 & -0.087904 & -0.8878 & 0.188373 \tabularnewline
48 & 0.356908 & 3.6046 & 0.000243 \tabularnewline
\hline
\end{tabular}
%Source: https://freestatistics.org/blog/index.php?pk=120684&T=1

[TABLE]
[ROW][C]Autocorrelation Function[/C][/ROW]
[ROW][C]Time lag k[/C][C]ACF(k)[/C][C]T-STAT[/C][C]P-value[/C][/ROW]
[ROW][C]1[/C][C]-0.207262[/C][C]-2.0932[/C][C]0.019404[/C][/ROW]
[ROW][C]2[/C][C]-0.250578[/C][C]-2.5307[/C][C]0.006455[/C][/ROW]
[ROW][C]3[/C][C]0.064428[/C][C]0.6507[/C][C]0.258355[/C][/ROW]
[ROW][C]4[/C][C]0.178717[/C][C]1.805[/C][C]0.037016[/C][/ROW]
[ROW][C]5[/C][C]0.056101[/C][C]0.5666[/C][C]0.286118[/C][/ROW]
[ROW][C]6[/C][C]-0.577169[/C][C]-5.8291[/C][C]0[/C][/ROW]
[ROW][C]7[/C][C]0.07299[/C][C]0.7372[/C][C]0.231359[/C][/ROW]
[ROW][C]8[/C][C]0.180462[/C][C]1.8226[/C][C]0.035649[/C][/ROW]
[ROW][C]9[/C][C]0.014188[/C][C]0.1433[/C][C]0.443173[/C][/ROW]
[ROW][C]10[/C][C]-0.254376[/C][C]-2.5691[/C][C]0.005822[/C][/ROW]
[ROW][C]11[/C][C]-0.068058[/C][C]-0.6874[/C][C]0.24671[/C][/ROW]
[ROW][C]12[/C][C]0.656522[/C][C]6.6305[/C][C]0[/C][/ROW]
[ROW][C]13[/C][C]-0.09859[/C][C]-0.9957[/C][C]0.160873[/C][/ROW]
[ROW][C]14[/C][C]-0.233777[/C][C]-2.361[/C][C]0.010062[/C][/ROW]
[ROW][C]15[/C][C]0.067682[/C][C]0.6836[/C][C]0.247903[/C][/ROW]
[ROW][C]16[/C][C]0.187215[/C][C]1.8908[/C][C]0.030746[/C][/ROW]
[ROW][C]17[/C][C]0.011569[/C][C]0.1168[/C][C]0.453608[/C][/ROW]
[ROW][C]18[/C][C]-0.509154[/C][C]-5.1422[/C][C]1e-06[/C][/ROW]
[ROW][C]19[/C][C]0.123662[/C][C]1.2489[/C][C]0.107276[/C][/ROW]
[ROW][C]20[/C][C]0.071759[/C][C]0.7247[/C][C]0.235138[/C][/ROW]
[ROW][C]21[/C][C]0.031221[/C][C]0.3153[/C][C]0.376581[/C][/ROW]
[ROW][C]22[/C][C]-0.177318[/C][C]-1.7908[/C][C]0.038144[/C][/ROW]
[ROW][C]23[/C][C]-0.093229[/C][C]-0.9416[/C][C]0.17432[/C][/ROW]
[ROW][C]24[/C][C]0.569821[/C][C]5.7549[/C][C]0[/C][/ROW]
[ROW][C]25[/C][C]-0.081781[/C][C]-0.8259[/C][C]0.20538[/C][/ROW]
[ROW][C]26[/C][C]-0.18505[/C][C]-1.8689[/C][C]0.032252[/C][/ROW]
[ROW][C]27[/C][C]0.06297[/C][C]0.636[/C][C]0.26311[/C][/ROW]
[ROW][C]28[/C][C]0.098384[/C][C]0.9936[/C][C]0.161377[/C][/ROW]
[ROW][C]29[/C][C]0.01316[/C][C]0.1329[/C][C]0.447263[/C][/ROW]
[ROW][C]30[/C][C]-0.348286[/C][C]-3.5175[/C][C]0.000326[/C][/ROW]
[ROW][C]31[/C][C]0.047878[/C][C]0.4835[/C][C]0.314873[/C][/ROW]
[ROW][C]32[/C][C]0.065133[/C][C]0.6578[/C][C]0.256071[/C][/ROW]
[ROW][C]33[/C][C]0.033554[/C][C]0.3389[/C][C]0.367699[/C][/ROW]
[ROW][C]34[/C][C]-0.138291[/C][C]-1.3967[/C][C]0.082772[/C][/ROW]
[ROW][C]35[/C][C]-0.10025[/C][C]-1.0125[/C][C]0.156852[/C][/ROW]
[ROW][C]36[/C][C]0.48654[/C][C]4.9138[/C][C]2e-06[/C][/ROW]
[ROW][C]37[/C][C]-0.084926[/C][C]-0.8577[/C][C]0.196532[/C][/ROW]
[ROW][C]38[/C][C]-0.111987[/C][C]-1.131[/C][C]0.130351[/C][/ROW]
[ROW][C]39[/C][C]0.019497[/C][C]0.1969[/C][C]0.422143[/C][/ROW]
[ROW][C]40[/C][C]0.073747[/C][C]0.7448[/C][C]0.229049[/C][/ROW]
[ROW][C]41[/C][C]0.035121[/C][C]0.3547[/C][C]0.361771[/C][/ROW]
[ROW][C]42[/C][C]-0.332614[/C][C]-3.3592[/C][C]0.00055[/C][/ROW]
[ROW][C]43[/C][C]0.077823[/C][C]0.786[/C][C]0.216851[/C][/ROW]
[ROW][C]44[/C][C]0.02907[/C][C]0.2936[/C][C]0.384831[/C][/ROW]
[ROW][C]45[/C][C]0.024829[/C][C]0.2508[/C][C]0.401253[/C][/ROW]
[ROW][C]46[/C][C]-0.077214[/C][C]-0.7798[/C][C]0.218652[/C][/ROW]
[ROW][C]47[/C][C]-0.087904[/C][C]-0.8878[/C][C]0.188373[/C][/ROW]
[ROW][C]48[/C][C]0.356908[/C][C]3.6046[/C][C]0.000243[/C][/ROW]
[/TABLE]
Source: https://freestatistics.org/blog/index.php?pk=120684&T=1

Globally Unique Identifier (entire table): ba.freestatistics.org/blog/index.php?pk=120684&T=1

As an alternative you can also use a QR Code:  

The GUIDs for individual cells are displayed in the table below:

Autocorrelation Function
Time lag kACF(k)T-STATP-value
1-0.207262-2.09320.019404
2-0.250578-2.53070.006455
30.0644280.65070.258355
40.1787171.8050.037016
50.0561010.56660.286118
6-0.577169-5.82910
70.072990.73720.231359
80.1804621.82260.035649
90.0141880.14330.443173
10-0.254376-2.56910.005822
11-0.068058-0.68740.24671
120.6565226.63050
13-0.09859-0.99570.160873
14-0.233777-2.3610.010062
150.0676820.68360.247903
160.1872151.89080.030746
170.0115690.11680.453608
18-0.509154-5.14221e-06
190.1236621.24890.107276
200.0717590.72470.235138
210.0312210.31530.376581
22-0.177318-1.79080.038144
23-0.093229-0.94160.17432
240.5698215.75490
25-0.081781-0.82590.20538
26-0.18505-1.86890.032252
270.062970.6360.26311
280.0983840.99360.161377
290.013160.13290.447263
30-0.348286-3.51750.000326
310.0478780.48350.314873
320.0651330.65780.256071
330.0335540.33890.367699
34-0.138291-1.39670.082772
35-0.10025-1.01250.156852
360.486544.91382e-06
37-0.084926-0.85770.196532
38-0.111987-1.1310.130351
390.0194970.19690.422143
400.0737470.74480.229049
410.0351210.35470.361771
42-0.332614-3.35920.00055
430.0778230.7860.216851
440.029070.29360.384831
450.0248290.25080.401253
46-0.077214-0.77980.218652
47-0.087904-0.88780.188373
480.3569083.60460.000243


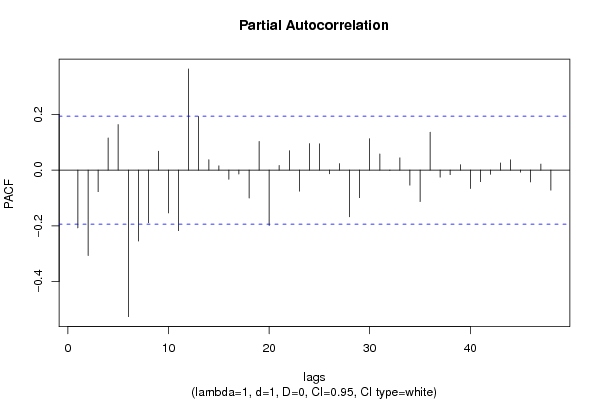
Partial Autocorrelation Function
Time lag kPACF(k)T-STATP-value
1-0.207262-2.09320.019404
2-0.306711-3.09760.00126
3-0.077284-0.78050.218443
40.1155391.16690.122989
50.1633751.650.051009
6-0.525982-5.31220
7-0.25435-2.56880.005826
8-0.189204-1.91090.029415
90.0677240.6840.247769
10-0.153522-1.55050.06206
11-0.217172-2.19330.015277
120.3630573.66670.000196
130.1926151.94530.027245
140.0374110.37780.353169
150.0152360.15390.439005
16-0.032727-0.33050.370841
17-0.013929-0.14070.444202
18-0.099874-1.00870.157758
190.1029811.04010.150387
20-0.198659-2.00640.023732
210.0168130.16980.432752
220.0693210.70010.242728
23-0.075488-0.76240.223794
240.094980.95920.169852
250.0942150.95150.171795
26-0.012914-0.13040.448243
270.0231520.23380.407794
28-0.167579-1.69250.046805
29-0.098929-0.99910.160046
300.1123321.13450.129623
310.0575930.58170.281038
32-0.001048-0.01060.495789
330.0440470.44480.328686
34-0.053971-0.54510.293446
35-0.113062-1.14190.128091
360.1359441.3730.086387
37-0.025293-0.25540.399446
38-0.016368-0.16530.434512
390.0194560.19650.422307
40-0.065766-0.66420.254029
41-0.04133-0.41740.338626
42-0.015164-0.15310.439293
430.0254690.25720.398763
440.0368850.37250.355139
45-0.007255-0.07330.470867
46-0.042339-0.42760.334919
470.0214850.2170.414324
48-0.071819-0.72530.234952

\begin{tabular}{lllllllll}
\hline
Partial Autocorrelation Function \tabularnewline
Time lag k & PACF(k) & T-STAT & P-value \tabularnewline
1 & -0.207262 & -2.0932 & 0.019404 \tabularnewline
2 & -0.306711 & -3.0976 & 0.00126 \tabularnewline
3 & -0.077284 & -0.7805 & 0.218443 \tabularnewline
4 & 0.115539 & 1.1669 & 0.122989 \tabularnewline
5 & 0.163375 & 1.65 & 0.051009 \tabularnewline
6 & -0.525982 & -5.3122 & 0 \tabularnewline
7 & -0.25435 & -2.5688 & 0.005826 \tabularnewline
8 & -0.189204 & -1.9109 & 0.029415 \tabularnewline
9 & 0.067724 & 0.684 & 0.247769 \tabularnewline
10 & -0.153522 & -1.5505 & 0.06206 \tabularnewline
11 & -0.217172 & -2.1933 & 0.015277 \tabularnewline
12 & 0.363057 & 3.6667 & 0.000196 \tabularnewline
13 & 0.192615 & 1.9453 & 0.027245 \tabularnewline
14 & 0.037411 & 0.3778 & 0.353169 \tabularnewline
15 & 0.015236 & 0.1539 & 0.439005 \tabularnewline
16 & -0.032727 & -0.3305 & 0.370841 \tabularnewline
17 & -0.013929 & -0.1407 & 0.444202 \tabularnewline
18 & -0.099874 & -1.0087 & 0.157758 \tabularnewline
19 & 0.102981 & 1.0401 & 0.150387 \tabularnewline
20 & -0.198659 & -2.0064 & 0.023732 \tabularnewline
21 & 0.016813 & 0.1698 & 0.432752 \tabularnewline
22 & 0.069321 & 0.7001 & 0.242728 \tabularnewline
23 & -0.075488 & -0.7624 & 0.223794 \tabularnewline
24 & 0.09498 & 0.9592 & 0.169852 \tabularnewline
25 & 0.094215 & 0.9515 & 0.171795 \tabularnewline
26 & -0.012914 & -0.1304 & 0.448243 \tabularnewline
27 & 0.023152 & 0.2338 & 0.407794 \tabularnewline
28 & -0.167579 & -1.6925 & 0.046805 \tabularnewline
29 & -0.098929 & -0.9991 & 0.160046 \tabularnewline
30 & 0.112332 & 1.1345 & 0.129623 \tabularnewline
31 & 0.057593 & 0.5817 & 0.281038 \tabularnewline
32 & -0.001048 & -0.0106 & 0.495789 \tabularnewline
33 & 0.044047 & 0.4448 & 0.328686 \tabularnewline
34 & -0.053971 & -0.5451 & 0.293446 \tabularnewline
35 & -0.113062 & -1.1419 & 0.128091 \tabularnewline
36 & 0.135944 & 1.373 & 0.086387 \tabularnewline
37 & -0.025293 & -0.2554 & 0.399446 \tabularnewline
38 & -0.016368 & -0.1653 & 0.434512 \tabularnewline
39 & 0.019456 & 0.1965 & 0.422307 \tabularnewline
40 & -0.065766 & -0.6642 & 0.254029 \tabularnewline
41 & -0.04133 & -0.4174 & 0.338626 \tabularnewline
42 & -0.015164 & -0.1531 & 0.439293 \tabularnewline
43 & 0.025469 & 0.2572 & 0.398763 \tabularnewline
44 & 0.036885 & 0.3725 & 0.355139 \tabularnewline
45 & -0.007255 & -0.0733 & 0.470867 \tabularnewline
46 & -0.042339 & -0.4276 & 0.334919 \tabularnewline
47 & 0.021485 & 0.217 & 0.414324 \tabularnewline
48 & -0.071819 & -0.7253 & 0.234952 \tabularnewline
\hline
\end{tabular}
%Source: https://freestatistics.org/blog/index.php?pk=120684&T=2

[TABLE]
[ROW][C]Partial Autocorrelation Function[/C][/ROW]
[ROW][C]Time lag k[/C][C]PACF(k)[/C][C]T-STAT[/C][C]P-value[/C][/ROW]
[ROW][C]1[/C][C]-0.207262[/C][C]-2.0932[/C][C]0.019404[/C][/ROW]
[ROW][C]2[/C][C]-0.306711[/C][C]-3.0976[/C][C]0.00126[/C][/ROW]
[ROW][C]3[/C][C]-0.077284[/C][C]-0.7805[/C][C]0.218443[/C][/ROW]
[ROW][C]4[/C][C]0.115539[/C][C]1.1669[/C][C]0.122989[/C][/ROW]
[ROW][C]5[/C][C]0.163375[/C][C]1.65[/C][C]0.051009[/C][/ROW]
[ROW][C]6[/C][C]-0.525982[/C][C]-5.3122[/C][C]0[/C][/ROW]
[ROW][C]7[/C][C]-0.25435[/C][C]-2.5688[/C][C]0.005826[/C][/ROW]
[ROW][C]8[/C][C]-0.189204[/C][C]-1.9109[/C][C]0.029415[/C][/ROW]
[ROW][C]9[/C][C]0.067724[/C][C]0.684[/C][C]0.247769[/C][/ROW]
[ROW][C]10[/C][C]-0.153522[/C][C]-1.5505[/C][C]0.06206[/C][/ROW]
[ROW][C]11[/C][C]-0.217172[/C][C]-2.1933[/C][C]0.015277[/C][/ROW]
[ROW][C]12[/C][C]0.363057[/C][C]3.6667[/C][C]0.000196[/C][/ROW]
[ROW][C]13[/C][C]0.192615[/C][C]1.9453[/C][C]0.027245[/C][/ROW]
[ROW][C]14[/C][C]0.037411[/C][C]0.3778[/C][C]0.353169[/C][/ROW]
[ROW][C]15[/C][C]0.015236[/C][C]0.1539[/C][C]0.439005[/C][/ROW]
[ROW][C]16[/C][C]-0.032727[/C][C]-0.3305[/C][C]0.370841[/C][/ROW]
[ROW][C]17[/C][C]-0.013929[/C][C]-0.1407[/C][C]0.444202[/C][/ROW]
[ROW][C]18[/C][C]-0.099874[/C][C]-1.0087[/C][C]0.157758[/C][/ROW]
[ROW][C]19[/C][C]0.102981[/C][C]1.0401[/C][C]0.150387[/C][/ROW]
[ROW][C]20[/C][C]-0.198659[/C][C]-2.0064[/C][C]0.023732[/C][/ROW]
[ROW][C]21[/C][C]0.016813[/C][C]0.1698[/C][C]0.432752[/C][/ROW]
[ROW][C]22[/C][C]0.069321[/C][C]0.7001[/C][C]0.242728[/C][/ROW]
[ROW][C]23[/C][C]-0.075488[/C][C]-0.7624[/C][C]0.223794[/C][/ROW]
[ROW][C]24[/C][C]0.09498[/C][C]0.9592[/C][C]0.169852[/C][/ROW]
[ROW][C]25[/C][C]0.094215[/C][C]0.9515[/C][C]0.171795[/C][/ROW]
[ROW][C]26[/C][C]-0.012914[/C][C]-0.1304[/C][C]0.448243[/C][/ROW]
[ROW][C]27[/C][C]0.023152[/C][C]0.2338[/C][C]0.407794[/C][/ROW]
[ROW][C]28[/C][C]-0.167579[/C][C]-1.6925[/C][C]0.046805[/C][/ROW]
[ROW][C]29[/C][C]-0.098929[/C][C]-0.9991[/C][C]0.160046[/C][/ROW]
[ROW][C]30[/C][C]0.112332[/C][C]1.1345[/C][C]0.129623[/C][/ROW]
[ROW][C]31[/C][C]0.057593[/C][C]0.5817[/C][C]0.281038[/C][/ROW]
[ROW][C]32[/C][C]-0.001048[/C][C]-0.0106[/C][C]0.495789[/C][/ROW]
[ROW][C]33[/C][C]0.044047[/C][C]0.4448[/C][C]0.328686[/C][/ROW]
[ROW][C]34[/C][C]-0.053971[/C][C]-0.5451[/C][C]0.293446[/C][/ROW]
[ROW][C]35[/C][C]-0.113062[/C][C]-1.1419[/C][C]0.128091[/C][/ROW]
[ROW][C]36[/C][C]0.135944[/C][C]1.373[/C][C]0.086387[/C][/ROW]
[ROW][C]37[/C][C]-0.025293[/C][C]-0.2554[/C][C]0.399446[/C][/ROW]
[ROW][C]38[/C][C]-0.016368[/C][C]-0.1653[/C][C]0.434512[/C][/ROW]
[ROW][C]39[/C][C]0.019456[/C][C]0.1965[/C][C]0.422307[/C][/ROW]
[ROW][C]40[/C][C]-0.065766[/C][C]-0.6642[/C][C]0.254029[/C][/ROW]
[ROW][C]41[/C][C]-0.04133[/C][C]-0.4174[/C][C]0.338626[/C][/ROW]
[ROW][C]42[/C][C]-0.015164[/C][C]-0.1531[/C][C]0.439293[/C][/ROW]
[ROW][C]43[/C][C]0.025469[/C][C]0.2572[/C][C]0.398763[/C][/ROW]
[ROW][C]44[/C][C]0.036885[/C][C]0.3725[/C][C]0.355139[/C][/ROW]
[ROW][C]45[/C][C]-0.007255[/C][C]-0.0733[/C][C]0.470867[/C][/ROW]
[ROW][C]46[/C][C]-0.042339[/C][C]-0.4276[/C][C]0.334919[/C][/ROW]
[ROW][C]47[/C][C]0.021485[/C][C]0.217[/C][C]0.414324[/C][/ROW]
[ROW][C]48[/C][C]-0.071819[/C][C]-0.7253[/C][C]0.234952[/C][/ROW]
[/TABLE]
Source: https://freestatistics.org/blog/index.php?pk=120684&T=2

Globally Unique Identifier (entire table): ba.freestatistics.org/blog/index.php?pk=120684&T=2

As an alternative you can also use a QR Code:  

The GUIDs for individual cells are displayed in the table below:

Partial Autocorrelation Function
Time lag kPACF(k)T-STATP-value
1-0.207262-2.09320.019404
2-0.306711-3.09760.00126
3-0.077284-0.78050.218443
40.1155391.16690.122989
50.1633751.650.051009
6-0.525982-5.31220
7-0.25435-2.56880.005826
8-0.189204-1.91090.029415
90.0677240.6840.247769
10-0.153522-1.55050.06206
11-0.217172-2.19330.015277
120.3630573.66670.000196
130.1926151.94530.027245
140.0374110.37780.353169
150.0152360.15390.439005
16-0.032727-0.33050.370841
17-0.013929-0.14070.444202
18-0.099874-1.00870.157758
190.1029811.04010.150387
20-0.198659-2.00640.023732
210.0168130.16980.432752
220.0693210.70010.242728
23-0.075488-0.76240.223794
240.094980.95920.169852
250.0942150.95150.171795
26-0.012914-0.13040.448243
270.0231520.23380.407794
28-0.167579-1.69250.046805
29-0.098929-0.99910.160046
300.1123321.13450.129623
310.0575930.58170.281038
32-0.001048-0.01060.495789
330.0440470.44480.328686
34-0.053971-0.54510.293446
35-0.113062-1.14190.128091
360.1359441.3730.086387
37-0.025293-0.25540.399446
38-0.016368-0.16530.434512
390.0194560.19650.422307
40-0.065766-0.66420.254029
41-0.04133-0.41740.338626
42-0.015164-0.15310.439293
430.0254690.25720.398763
440.0368850.37250.355139
45-0.007255-0.07330.470867
46-0.042339-0.42760.334919
470.0214850.2170.414324
48-0.071819-0.72530.234952


Parameters (Session):
par1 = 48 ; par2 = 1 ; par3 = 1 ; par4 = 0 ; par5 = 12 ; par6 = White Noise ; par7 = 0.95 ;
Parameters (R input):
par1 = 48 ; par2 = 1 ; par3 = 1 ; par4 = 0 ; par5 = 12 ; par6 = White Noise ; par7 = 0.95 ; par8 = ;
R code (references can be found in the software module):
if (par1 == 'Default') {
par1 = 10*log10(length(x))
} else {
par1 <- as.numeric(par1)
}
par2 <- as.numeric(par2)
par3 <- as.numeric(par3)
par4 <- as.numeric(par4)
par5 <- as.numeric(par5)
if (par6 == 'White Noise') par6 <- 'white' else par6 <- 'ma'
par7 <- as.numeric(par7)
if (par8 != '') par8 <- as.numeric(par8)
ox <- x
if (par8 == '') {
if (par2 == 0) {
x <- log(x)
} else {
x <- (x ^ par2 - 1) / par2
}
} else {
x <- log(x,base=par8)
}
if (par3 > 0) x <- diff(x,lag=1,difference=par3)
if (par4 > 0) x <- diff(x,lag=par5,difference=par4)
bitmap(file='picts.png')
op <- par(mfrow=c(2,1))
plot(ox,type='l',main='Original Time Series',xlab='time',ylab='value')
if (par8=='') {
mytitle <- paste('Working Time Series (lambda=',par2,', d=',par3,', D=',par4,')',sep='')
mysub <- paste('(lambda=',par2,', d=',par3,', D=',par4,', CI=', par7, ', CI type=',par6,')',sep='')
} else {
mytitle <- paste('Working Time Series (base=',par8,', d=',par3,', D=',par4,')',sep='')
mysub <- paste('(base=',par8,', d=',par3,', D=',par4,', CI=', par7, ', CI type=',par6,')',sep='')
}
plot(x,type='l', main=mytitle,xlab='time',ylab='value')
par(op)
dev.off()
bitmap(file='pic1.png')
racf <- acf(x, par1, main='Autocorrelation', xlab='time lag', ylab='ACF', ci.type=par6, ci=par7, sub=mysub)
dev.off()
bitmap(file='pic2.png')
rpacf <- pacf(x,par1,main='Partial Autocorrelation',xlab='lags',ylab='PACF',sub=mysub)
dev.off()
(myacf <- c(racf$acf))
(mypacf <- c(rpacf$acf))
lengthx <- length(x)
sqrtn <- sqrt(lengthx)
load(file='createtable')
a<-table.start()
a<-table.row.start(a)
a<-table.element(a,'Autocorrelation Function',4,TRUE)
a<-table.row.end(a)
a<-table.row.start(a)
a<-table.element(a,'Time lag k',header=TRUE)
a<-table.element(a,hyperlink('basics.htm','ACF(k)','click here for more information about the Autocorrelation Function'),header=TRUE)
a<-table.element(a,'T-STAT',header=TRUE)
a<-table.element(a,'P-value',header=TRUE)
a<-table.row.end(a)
for (i in 2:(par1+1)) {
a<-table.row.start(a)
a<-table.element(a,i-1,header=TRUE)
a<-table.element(a,round(myacf[i],6))
mytstat <- myacf[i]*sqrtn
a<-table.element(a,round(mytstat,4))
a<-table.element(a,round(1-pt(abs(mytstat),lengthx),6))
a<-table.row.end(a)
}
a<-table.end(a)
table.save(a,file='mytable.tab')
a<-table.start()
a<-table.row.start(a)
a<-table.element(a,'Partial Autocorrelation Function',4,TRUE)
a<-table.row.end(a)
a<-table.row.start(a)
a<-table.element(a,'Time lag k',header=TRUE)
a<-table.element(a,hyperlink('basics.htm','PACF(k)','click here for more information about the Partial Autocorrelation Function'),header=TRUE)
a<-table.element(a,'T-STAT',header=TRUE)
a<-table.element(a,'P-value',header=TRUE)
a<-table.row.end(a)
for (i in 1:par1) {
a<-table.row.start(a)
a<-table.element(a,i,header=TRUE)
a<-table.element(a,round(mypacf[i],6))
mytstat <- mypacf[i]*sqrtn
a<-table.element(a,round(mytstat,4))
a<-table.element(a,round(1-pt(abs(mytstat),lengthx),6))
a<-table.row.end(a)
}
a<-table.end(a)
table.save(a,file='mytable1.tab')