Free Statistics

of Irreproducible Research!

Author's title

Author*Unverified author*
R Software Modulerwasp_autocorrelation.wasp
Title produced by software(Partial) Autocorrelation Function
Date of computationWed, 27 Apr 2011 19:54:31 +0000
Cite this page as followsStatistical Computations at FreeStatistics.org, Office for Research Development and Education, URL https://freestatistics.org/blog/index.php?v=date/2011/Apr/27/t1303933931s4vn5rk465wmf3h.htm/, Retrieved Thu, 09 May 2024 07:27:09 +0000
Statistical Computations at FreeStatistics.org, Office for Research Development and Education, URL https://freestatistics.org/blog/index.php?pk=120683, Retrieved Thu, 09 May 2024 07:27:09 +0000
QR Codes:

Original text written by user:
IsPrivate?No (this computation is public)
User-defined keywordsKDGP2W12
Estimated Impact157
Family? (F = Feedback message, R = changed R code, M = changed R Module, P = changed Parameters, D = changed Data)
-       [(Partial) Autocorrelation Function] [autocorrelatie ve...] [2011-04-27 19:54:31] [cd3c8dd726b701571412eb3280c696e7] [Current]
Feedback Forum

Post a new message
Dataseries X:
814
1150
1225
1691
1759
1754
2100
2062
2012
1897
1964
2186
966
1549
1538
1612
2078
2137
2907
2249
1883
1739
1828
1868
1138
1430
1809
1763
2200
2067
2503
2141
2103
1972
2181
2344
970
1199
1718
1683
2025
2051
2439
2353
2230
1852
2147
2286
1007
1665
1642
1518
1831
2207
2822
2393
2306
1785
2047
2171
1212
1335
2011
1860
1954
2152
2835
2224
2182
1992
2389
2724
891
1247
2017
2257
2255
2255
3057
3330
1896
2096
2374
2535
1041
1728
2201
2455
2204
2660
3670
2665
2639
2226
2586
2684
1185
1749
2459
2618
2585
3310
3923


Summary of computational transaction
Raw Inputview raw input (R code)
Raw Outputview raw output of R engine
Computing time2 seconds
R Server'Gwilym Jenkins' @ www.wessa.org

\begin{tabular}{lllllllll}
\hline
Summary of computational transaction \tabularnewline
Raw Input & view raw input (R code)  \tabularnewline
Raw Output & view raw output of R engine  \tabularnewline
Computing time & 2 seconds \tabularnewline
R Server & 'Gwilym Jenkins' @ www.wessa.org \tabularnewline
\hline
\end{tabular}
%Source: https://freestatistics.org/blog/index.php?pk=120683&T=0

[TABLE]
[ROW][C]Summary of computational transaction[/C][/ROW]
[ROW][C]Raw Input[/C][C]view raw input (R code) [/C][/ROW]
[ROW][C]Raw Output[/C][C]view raw output of R engine [/C][/ROW]
[ROW][C]Computing time[/C][C]2 seconds[/C][/ROW]
[ROW][C]R Server[/C][C]'Gwilym Jenkins' @ www.wessa.org[/C][/ROW]
[/TABLE]
Source: https://freestatistics.org/blog/index.php?pk=120683&T=0

Globally Unique Identifier (entire table): ba.freestatistics.org/blog/index.php?pk=120683&T=0

As an alternative you can also use a QR Code:  

The GUIDs for individual cells are displayed in the table below:

Summary of computational transaction
Raw Inputview raw input (R code)
Raw Outputview raw output of R engine
Computing time2 seconds
R Server'Gwilym Jenkins' @ www.wessa.org


Autocorrelation Function
Time lag kACF(k)T-STATP-value
10.4660354.72974e-06
20.1664611.68940.047085
30.13821.40260.081875
40.0655730.66550.253612
5-0.159509-1.61880.05427
6-0.395995-4.01895.6e-05
7-0.059992-0.60890.271981
80.122411.24230.108469
90.1429441.45070.074948
100.1660631.68540.047474
110.3997184.05674.8e-05
120.7015397.11980
130.2989223.03370.001529
140.0636850.64630.259752
150.0663190.67310.251208
16-0.005502-0.05580.47779
17-0.217219-2.20450.014856
18-0.410667-4.16783.2e-05
19-0.070532-0.71580.237859
200.0470.4770.317187
210.0935260.94920.172373
220.1210081.22810.111105
230.3243563.29190.000682
240.531255.39160
250.2037032.06740.020603
260.0055630.05650.477544
27-0.01067-0.10830.456988
28-0.087438-0.88740.188467
29-0.224899-2.28250.012258
30-0.335825-3.40820.000467
31-0.091746-0.93110.176984
32-0.009868-0.10010.46021
330.0289050.29340.384919
340.0536890.54490.293506
350.2008162.03810.022053
360.4422954.48889e-06
370.1512421.53490.063932
38-0.017051-0.1730.431478
39-0.053917-0.54720.292714
40-0.105824-1.0740.142667
41-0.222049-2.25360.013171
42-0.331647-3.36590.000537
43-0.116198-1.17930.120502
44-0.030275-0.30730.379633
450.0304890.30940.378809
460.0681860.6920.245243
470.1564371.58770.057713
480.3237863.28610.000695

\begin{tabular}{lllllllll}
\hline
Autocorrelation Function \tabularnewline
Time lag k & ACF(k) & T-STAT & P-value \tabularnewline
1 & 0.466035 & 4.7297 & 4e-06 \tabularnewline
2 & 0.166461 & 1.6894 & 0.047085 \tabularnewline
3 & 0.1382 & 1.4026 & 0.081875 \tabularnewline
4 & 0.065573 & 0.6655 & 0.253612 \tabularnewline
5 & -0.159509 & -1.6188 & 0.05427 \tabularnewline
6 & -0.395995 & -4.0189 & 5.6e-05 \tabularnewline
7 & -0.059992 & -0.6089 & 0.271981 \tabularnewline
8 & 0.12241 & 1.2423 & 0.108469 \tabularnewline
9 & 0.142944 & 1.4507 & 0.074948 \tabularnewline
10 & 0.166063 & 1.6854 & 0.047474 \tabularnewline
11 & 0.399718 & 4.0567 & 4.8e-05 \tabularnewline
12 & 0.701539 & 7.1198 & 0 \tabularnewline
13 & 0.298922 & 3.0337 & 0.001529 \tabularnewline
14 & 0.063685 & 0.6463 & 0.259752 \tabularnewline
15 & 0.066319 & 0.6731 & 0.251208 \tabularnewline
16 & -0.005502 & -0.0558 & 0.47779 \tabularnewline
17 & -0.217219 & -2.2045 & 0.014856 \tabularnewline
18 & -0.410667 & -4.1678 & 3.2e-05 \tabularnewline
19 & -0.070532 & -0.7158 & 0.237859 \tabularnewline
20 & 0.047 & 0.477 & 0.317187 \tabularnewline
21 & 0.093526 & 0.9492 & 0.172373 \tabularnewline
22 & 0.121008 & 1.2281 & 0.111105 \tabularnewline
23 & 0.324356 & 3.2919 & 0.000682 \tabularnewline
24 & 0.53125 & 5.3916 & 0 \tabularnewline
25 & 0.203703 & 2.0674 & 0.020603 \tabularnewline
26 & 0.005563 & 0.0565 & 0.477544 \tabularnewline
27 & -0.01067 & -0.1083 & 0.456988 \tabularnewline
28 & -0.087438 & -0.8874 & 0.188467 \tabularnewline
29 & -0.224899 & -2.2825 & 0.012258 \tabularnewline
30 & -0.335825 & -3.4082 & 0.000467 \tabularnewline
31 & -0.091746 & -0.9311 & 0.176984 \tabularnewline
32 & -0.009868 & -0.1001 & 0.46021 \tabularnewline
33 & 0.028905 & 0.2934 & 0.384919 \tabularnewline
34 & 0.053689 & 0.5449 & 0.293506 \tabularnewline
35 & 0.200816 & 2.0381 & 0.022053 \tabularnewline
36 & 0.442295 & 4.4888 & 9e-06 \tabularnewline
37 & 0.151242 & 1.5349 & 0.063932 \tabularnewline
38 & -0.017051 & -0.173 & 0.431478 \tabularnewline
39 & -0.053917 & -0.5472 & 0.292714 \tabularnewline
40 & -0.105824 & -1.074 & 0.142667 \tabularnewline
41 & -0.222049 & -2.2536 & 0.013171 \tabularnewline
42 & -0.331647 & -3.3659 & 0.000537 \tabularnewline
43 & -0.116198 & -1.1793 & 0.120502 \tabularnewline
44 & -0.030275 & -0.3073 & 0.379633 \tabularnewline
45 & 0.030489 & 0.3094 & 0.378809 \tabularnewline
46 & 0.068186 & 0.692 & 0.245243 \tabularnewline
47 & 0.156437 & 1.5877 & 0.057713 \tabularnewline
48 & 0.323786 & 3.2861 & 0.000695 \tabularnewline
\hline
\end{tabular}
%Source: https://freestatistics.org/blog/index.php?pk=120683&T=1

[TABLE]
[ROW][C]Autocorrelation Function[/C][/ROW]
[ROW][C]Time lag k[/C][C]ACF(k)[/C][C]T-STAT[/C][C]P-value[/C][/ROW]
[ROW][C]1[/C][C]0.466035[/C][C]4.7297[/C][C]4e-06[/C][/ROW]
[ROW][C]2[/C][C]0.166461[/C][C]1.6894[/C][C]0.047085[/C][/ROW]
[ROW][C]3[/C][C]0.1382[/C][C]1.4026[/C][C]0.081875[/C][/ROW]
[ROW][C]4[/C][C]0.065573[/C][C]0.6655[/C][C]0.253612[/C][/ROW]
[ROW][C]5[/C][C]-0.159509[/C][C]-1.6188[/C][C]0.05427[/C][/ROW]
[ROW][C]6[/C][C]-0.395995[/C][C]-4.0189[/C][C]5.6e-05[/C][/ROW]
[ROW][C]7[/C][C]-0.059992[/C][C]-0.6089[/C][C]0.271981[/C][/ROW]
[ROW][C]8[/C][C]0.12241[/C][C]1.2423[/C][C]0.108469[/C][/ROW]
[ROW][C]9[/C][C]0.142944[/C][C]1.4507[/C][C]0.074948[/C][/ROW]
[ROW][C]10[/C][C]0.166063[/C][C]1.6854[/C][C]0.047474[/C][/ROW]
[ROW][C]11[/C][C]0.399718[/C][C]4.0567[/C][C]4.8e-05[/C][/ROW]
[ROW][C]12[/C][C]0.701539[/C][C]7.1198[/C][C]0[/C][/ROW]
[ROW][C]13[/C][C]0.298922[/C][C]3.0337[/C][C]0.001529[/C][/ROW]
[ROW][C]14[/C][C]0.063685[/C][C]0.6463[/C][C]0.259752[/C][/ROW]
[ROW][C]15[/C][C]0.066319[/C][C]0.6731[/C][C]0.251208[/C][/ROW]
[ROW][C]16[/C][C]-0.005502[/C][C]-0.0558[/C][C]0.47779[/C][/ROW]
[ROW][C]17[/C][C]-0.217219[/C][C]-2.2045[/C][C]0.014856[/C][/ROW]
[ROW][C]18[/C][C]-0.410667[/C][C]-4.1678[/C][C]3.2e-05[/C][/ROW]
[ROW][C]19[/C][C]-0.070532[/C][C]-0.7158[/C][C]0.237859[/C][/ROW]
[ROW][C]20[/C][C]0.047[/C][C]0.477[/C][C]0.317187[/C][/ROW]
[ROW][C]21[/C][C]0.093526[/C][C]0.9492[/C][C]0.172373[/C][/ROW]
[ROW][C]22[/C][C]0.121008[/C][C]1.2281[/C][C]0.111105[/C][/ROW]
[ROW][C]23[/C][C]0.324356[/C][C]3.2919[/C][C]0.000682[/C][/ROW]
[ROW][C]24[/C][C]0.53125[/C][C]5.3916[/C][C]0[/C][/ROW]
[ROW][C]25[/C][C]0.203703[/C][C]2.0674[/C][C]0.020603[/C][/ROW]
[ROW][C]26[/C][C]0.005563[/C][C]0.0565[/C][C]0.477544[/C][/ROW]
[ROW][C]27[/C][C]-0.01067[/C][C]-0.1083[/C][C]0.456988[/C][/ROW]
[ROW][C]28[/C][C]-0.087438[/C][C]-0.8874[/C][C]0.188467[/C][/ROW]
[ROW][C]29[/C][C]-0.224899[/C][C]-2.2825[/C][C]0.012258[/C][/ROW]
[ROW][C]30[/C][C]-0.335825[/C][C]-3.4082[/C][C]0.000467[/C][/ROW]
[ROW][C]31[/C][C]-0.091746[/C][C]-0.9311[/C][C]0.176984[/C][/ROW]
[ROW][C]32[/C][C]-0.009868[/C][C]-0.1001[/C][C]0.46021[/C][/ROW]
[ROW][C]33[/C][C]0.028905[/C][C]0.2934[/C][C]0.384919[/C][/ROW]
[ROW][C]34[/C][C]0.053689[/C][C]0.5449[/C][C]0.293506[/C][/ROW]
[ROW][C]35[/C][C]0.200816[/C][C]2.0381[/C][C]0.022053[/C][/ROW]
[ROW][C]36[/C][C]0.442295[/C][C]4.4888[/C][C]9e-06[/C][/ROW]
[ROW][C]37[/C][C]0.151242[/C][C]1.5349[/C][C]0.063932[/C][/ROW]
[ROW][C]38[/C][C]-0.017051[/C][C]-0.173[/C][C]0.431478[/C][/ROW]
[ROW][C]39[/C][C]-0.053917[/C][C]-0.5472[/C][C]0.292714[/C][/ROW]
[ROW][C]40[/C][C]-0.105824[/C][C]-1.074[/C][C]0.142667[/C][/ROW]
[ROW][C]41[/C][C]-0.222049[/C][C]-2.2536[/C][C]0.013171[/C][/ROW]
[ROW][C]42[/C][C]-0.331647[/C][C]-3.3659[/C][C]0.000537[/C][/ROW]
[ROW][C]43[/C][C]-0.116198[/C][C]-1.1793[/C][C]0.120502[/C][/ROW]
[ROW][C]44[/C][C]-0.030275[/C][C]-0.3073[/C][C]0.379633[/C][/ROW]
[ROW][C]45[/C][C]0.030489[/C][C]0.3094[/C][C]0.378809[/C][/ROW]
[ROW][C]46[/C][C]0.068186[/C][C]0.692[/C][C]0.245243[/C][/ROW]
[ROW][C]47[/C][C]0.156437[/C][C]1.5877[/C][C]0.057713[/C][/ROW]
[ROW][C]48[/C][C]0.323786[/C][C]3.2861[/C][C]0.000695[/C][/ROW]
[/TABLE]
Source: https://freestatistics.org/blog/index.php?pk=120683&T=1

Globally Unique Identifier (entire table): ba.freestatistics.org/blog/index.php?pk=120683&T=1

As an alternative you can also use a QR Code:  

The GUIDs for individual cells are displayed in the table below:

Autocorrelation Function
Time lag kACF(k)T-STATP-value
10.4660354.72974e-06
20.1664611.68940.047085
30.13821.40260.081875
40.0655730.66550.253612
5-0.159509-1.61880.05427
6-0.395995-4.01895.6e-05
7-0.059992-0.60890.271981
80.122411.24230.108469
90.1429441.45070.074948
100.1660631.68540.047474
110.3997184.05674.8e-05
120.7015397.11980
130.2989223.03370.001529
140.0636850.64630.259752
150.0663190.67310.251208
16-0.005502-0.05580.47779
17-0.217219-2.20450.014856
18-0.410667-4.16783.2e-05
19-0.070532-0.71580.237859
200.0470.4770.317187
210.0935260.94920.172373
220.1210081.22810.111105
230.3243563.29190.000682
240.531255.39160
250.2037032.06740.020603
260.0055630.05650.477544
27-0.01067-0.10830.456988
28-0.087438-0.88740.188467
29-0.224899-2.28250.012258
30-0.335825-3.40820.000467
31-0.091746-0.93110.176984
32-0.009868-0.10010.46021
330.0289050.29340.384919
340.0536890.54490.293506
350.2008162.03810.022053
360.4422954.48889e-06
370.1512421.53490.063932
38-0.017051-0.1730.431478
39-0.053917-0.54720.292714
40-0.105824-1.0740.142667
41-0.222049-2.25360.013171
42-0.331647-3.36590.000537
43-0.116198-1.17930.120502
44-0.030275-0.30730.379633
450.0304890.30940.378809
460.0681860.6920.245243
470.1564371.58770.057713
480.3237863.28610.000695


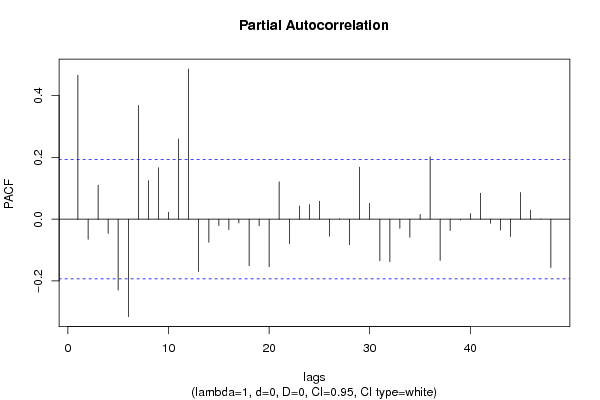
Partial Autocorrelation Function
Time lag kPACF(k)T-STATP-value
10.4660354.72974e-06
2-0.064803-0.65770.256107
30.1100631.1170.133294
4-0.045978-0.46660.320876
5-0.229463-2.32880.010911
6-0.315484-3.20180.000908
70.3682643.73750.000153
80.1242721.26120.105039
90.1665181.690.047029
100.0226620.230.409276
110.2594552.63320.004881
120.4864844.93732e-06
13-0.169306-1.71830.044376
14-0.074478-0.75590.225728
15-0.020587-0.20890.417454
16-0.033539-0.34040.367131
17-0.01189-0.12070.452095
18-0.150978-1.53230.064262
19-0.021191-0.21510.415071
20-0.153621-1.55910.061022
210.1209081.22710.111294
22-0.079367-0.80550.211196
230.0423830.43010.333997
240.0466910.47390.318299
250.0581490.59020.27819
26-0.054999-0.55820.288967
270.0006170.00630.497508
28-0.082248-0.83470.202901
290.1685461.71060.045087
300.0514230.52190.301435
31-0.134456-1.36460.08768
32-0.137448-1.39490.083016
33-0.029306-0.29740.38337
34-0.058433-0.5930.27723
350.015240.15470.438693
360.2022212.05230.021337
37-0.13341-1.3540.089355
38-0.036498-0.37040.355918
39-0.00211-0.02140.491478
400.0180040.18270.427689
410.0839390.85190.198126
42-0.013116-0.13310.447183
43-0.034935-0.35460.361823
44-0.056074-0.56910.285266
450.0864910.87780.19105
460.02890.29330.384941
476.4e-056e-040.499742
48-0.156186-1.58510.058003

\begin{tabular}{lllllllll}
\hline
Partial Autocorrelation Function \tabularnewline
Time lag k & PACF(k) & T-STAT & P-value \tabularnewline
1 & 0.466035 & 4.7297 & 4e-06 \tabularnewline
2 & -0.064803 & -0.6577 & 0.256107 \tabularnewline
3 & 0.110063 & 1.117 & 0.133294 \tabularnewline
4 & -0.045978 & -0.4666 & 0.320876 \tabularnewline
5 & -0.229463 & -2.3288 & 0.010911 \tabularnewline
6 & -0.315484 & -3.2018 & 0.000908 \tabularnewline
7 & 0.368264 & 3.7375 & 0.000153 \tabularnewline
8 & 0.124272 & 1.2612 & 0.105039 \tabularnewline
9 & 0.166518 & 1.69 & 0.047029 \tabularnewline
10 & 0.022662 & 0.23 & 0.409276 \tabularnewline
11 & 0.259455 & 2.6332 & 0.004881 \tabularnewline
12 & 0.486484 & 4.9373 & 2e-06 \tabularnewline
13 & -0.169306 & -1.7183 & 0.044376 \tabularnewline
14 & -0.074478 & -0.7559 & 0.225728 \tabularnewline
15 & -0.020587 & -0.2089 & 0.417454 \tabularnewline
16 & -0.033539 & -0.3404 & 0.367131 \tabularnewline
17 & -0.01189 & -0.1207 & 0.452095 \tabularnewline
18 & -0.150978 & -1.5323 & 0.064262 \tabularnewline
19 & -0.021191 & -0.2151 & 0.415071 \tabularnewline
20 & -0.153621 & -1.5591 & 0.061022 \tabularnewline
21 & 0.120908 & 1.2271 & 0.111294 \tabularnewline
22 & -0.079367 & -0.8055 & 0.211196 \tabularnewline
23 & 0.042383 & 0.4301 & 0.333997 \tabularnewline
24 & 0.046691 & 0.4739 & 0.318299 \tabularnewline
25 & 0.058149 & 0.5902 & 0.27819 \tabularnewline
26 & -0.054999 & -0.5582 & 0.288967 \tabularnewline
27 & 0.000617 & 0.0063 & 0.497508 \tabularnewline
28 & -0.082248 & -0.8347 & 0.202901 \tabularnewline
29 & 0.168546 & 1.7106 & 0.045087 \tabularnewline
30 & 0.051423 & 0.5219 & 0.301435 \tabularnewline
31 & -0.134456 & -1.3646 & 0.08768 \tabularnewline
32 & -0.137448 & -1.3949 & 0.083016 \tabularnewline
33 & -0.029306 & -0.2974 & 0.38337 \tabularnewline
34 & -0.058433 & -0.593 & 0.27723 \tabularnewline
35 & 0.01524 & 0.1547 & 0.438693 \tabularnewline
36 & 0.202221 & 2.0523 & 0.021337 \tabularnewline
37 & -0.13341 & -1.354 & 0.089355 \tabularnewline
38 & -0.036498 & -0.3704 & 0.355918 \tabularnewline
39 & -0.00211 & -0.0214 & 0.491478 \tabularnewline
40 & 0.018004 & 0.1827 & 0.427689 \tabularnewline
41 & 0.083939 & 0.8519 & 0.198126 \tabularnewline
42 & -0.013116 & -0.1331 & 0.447183 \tabularnewline
43 & -0.034935 & -0.3546 & 0.361823 \tabularnewline
44 & -0.056074 & -0.5691 & 0.285266 \tabularnewline
45 & 0.086491 & 0.8778 & 0.19105 \tabularnewline
46 & 0.0289 & 0.2933 & 0.384941 \tabularnewline
47 & 6.4e-05 & 6e-04 & 0.499742 \tabularnewline
48 & -0.156186 & -1.5851 & 0.058003 \tabularnewline
\hline
\end{tabular}
%Source: https://freestatistics.org/blog/index.php?pk=120683&T=2

[TABLE]
[ROW][C]Partial Autocorrelation Function[/C][/ROW]
[ROW][C]Time lag k[/C][C]PACF(k)[/C][C]T-STAT[/C][C]P-value[/C][/ROW]
[ROW][C]1[/C][C]0.466035[/C][C]4.7297[/C][C]4e-06[/C][/ROW]
[ROW][C]2[/C][C]-0.064803[/C][C]-0.6577[/C][C]0.256107[/C][/ROW]
[ROW][C]3[/C][C]0.110063[/C][C]1.117[/C][C]0.133294[/C][/ROW]
[ROW][C]4[/C][C]-0.045978[/C][C]-0.4666[/C][C]0.320876[/C][/ROW]
[ROW][C]5[/C][C]-0.229463[/C][C]-2.3288[/C][C]0.010911[/C][/ROW]
[ROW][C]6[/C][C]-0.315484[/C][C]-3.2018[/C][C]0.000908[/C][/ROW]
[ROW][C]7[/C][C]0.368264[/C][C]3.7375[/C][C]0.000153[/C][/ROW]
[ROW][C]8[/C][C]0.124272[/C][C]1.2612[/C][C]0.105039[/C][/ROW]
[ROW][C]9[/C][C]0.166518[/C][C]1.69[/C][C]0.047029[/C][/ROW]
[ROW][C]10[/C][C]0.022662[/C][C]0.23[/C][C]0.409276[/C][/ROW]
[ROW][C]11[/C][C]0.259455[/C][C]2.6332[/C][C]0.004881[/C][/ROW]
[ROW][C]12[/C][C]0.486484[/C][C]4.9373[/C][C]2e-06[/C][/ROW]
[ROW][C]13[/C][C]-0.169306[/C][C]-1.7183[/C][C]0.044376[/C][/ROW]
[ROW][C]14[/C][C]-0.074478[/C][C]-0.7559[/C][C]0.225728[/C][/ROW]
[ROW][C]15[/C][C]-0.020587[/C][C]-0.2089[/C][C]0.417454[/C][/ROW]
[ROW][C]16[/C][C]-0.033539[/C][C]-0.3404[/C][C]0.367131[/C][/ROW]
[ROW][C]17[/C][C]-0.01189[/C][C]-0.1207[/C][C]0.452095[/C][/ROW]
[ROW][C]18[/C][C]-0.150978[/C][C]-1.5323[/C][C]0.064262[/C][/ROW]
[ROW][C]19[/C][C]-0.021191[/C][C]-0.2151[/C][C]0.415071[/C][/ROW]
[ROW][C]20[/C][C]-0.153621[/C][C]-1.5591[/C][C]0.061022[/C][/ROW]
[ROW][C]21[/C][C]0.120908[/C][C]1.2271[/C][C]0.111294[/C][/ROW]
[ROW][C]22[/C][C]-0.079367[/C][C]-0.8055[/C][C]0.211196[/C][/ROW]
[ROW][C]23[/C][C]0.042383[/C][C]0.4301[/C][C]0.333997[/C][/ROW]
[ROW][C]24[/C][C]0.046691[/C][C]0.4739[/C][C]0.318299[/C][/ROW]
[ROW][C]25[/C][C]0.058149[/C][C]0.5902[/C][C]0.27819[/C][/ROW]
[ROW][C]26[/C][C]-0.054999[/C][C]-0.5582[/C][C]0.288967[/C][/ROW]
[ROW][C]27[/C][C]0.000617[/C][C]0.0063[/C][C]0.497508[/C][/ROW]
[ROW][C]28[/C][C]-0.082248[/C][C]-0.8347[/C][C]0.202901[/C][/ROW]
[ROW][C]29[/C][C]0.168546[/C][C]1.7106[/C][C]0.045087[/C][/ROW]
[ROW][C]30[/C][C]0.051423[/C][C]0.5219[/C][C]0.301435[/C][/ROW]
[ROW][C]31[/C][C]-0.134456[/C][C]-1.3646[/C][C]0.08768[/C][/ROW]
[ROW][C]32[/C][C]-0.137448[/C][C]-1.3949[/C][C]0.083016[/C][/ROW]
[ROW][C]33[/C][C]-0.029306[/C][C]-0.2974[/C][C]0.38337[/C][/ROW]
[ROW][C]34[/C][C]-0.058433[/C][C]-0.593[/C][C]0.27723[/C][/ROW]
[ROW][C]35[/C][C]0.01524[/C][C]0.1547[/C][C]0.438693[/C][/ROW]
[ROW][C]36[/C][C]0.202221[/C][C]2.0523[/C][C]0.021337[/C][/ROW]
[ROW][C]37[/C][C]-0.13341[/C][C]-1.354[/C][C]0.089355[/C][/ROW]
[ROW][C]38[/C][C]-0.036498[/C][C]-0.3704[/C][C]0.355918[/C][/ROW]
[ROW][C]39[/C][C]-0.00211[/C][C]-0.0214[/C][C]0.491478[/C][/ROW]
[ROW][C]40[/C][C]0.018004[/C][C]0.1827[/C][C]0.427689[/C][/ROW]
[ROW][C]41[/C][C]0.083939[/C][C]0.8519[/C][C]0.198126[/C][/ROW]
[ROW][C]42[/C][C]-0.013116[/C][C]-0.1331[/C][C]0.447183[/C][/ROW]
[ROW][C]43[/C][C]-0.034935[/C][C]-0.3546[/C][C]0.361823[/C][/ROW]
[ROW][C]44[/C][C]-0.056074[/C][C]-0.5691[/C][C]0.285266[/C][/ROW]
[ROW][C]45[/C][C]0.086491[/C][C]0.8778[/C][C]0.19105[/C][/ROW]
[ROW][C]46[/C][C]0.0289[/C][C]0.2933[/C][C]0.384941[/C][/ROW]
[ROW][C]47[/C][C]6.4e-05[/C][C]6e-04[/C][C]0.499742[/C][/ROW]
[ROW][C]48[/C][C]-0.156186[/C][C]-1.5851[/C][C]0.058003[/C][/ROW]
[/TABLE]
Source: https://freestatistics.org/blog/index.php?pk=120683&T=2

Globally Unique Identifier (entire table): ba.freestatistics.org/blog/index.php?pk=120683&T=2

As an alternative you can also use a QR Code:  

The GUIDs for individual cells are displayed in the table below:

Partial Autocorrelation Function
Time lag kPACF(k)T-STATP-value
10.4660354.72974e-06
2-0.064803-0.65770.256107
30.1100631.1170.133294
4-0.045978-0.46660.320876
5-0.229463-2.32880.010911
6-0.315484-3.20180.000908
70.3682643.73750.000153
80.1242721.26120.105039
90.1665181.690.047029
100.0226620.230.409276
110.2594552.63320.004881
120.4864844.93732e-06
13-0.169306-1.71830.044376
14-0.074478-0.75590.225728
15-0.020587-0.20890.417454
16-0.033539-0.34040.367131
17-0.01189-0.12070.452095
18-0.150978-1.53230.064262
19-0.021191-0.21510.415071
20-0.153621-1.55910.061022
210.1209081.22710.111294
22-0.079367-0.80550.211196
230.0423830.43010.333997
240.0466910.47390.318299
250.0581490.59020.27819
26-0.054999-0.55820.288967
270.0006170.00630.497508
28-0.082248-0.83470.202901
290.1685461.71060.045087
300.0514230.52190.301435
31-0.134456-1.36460.08768
32-0.137448-1.39490.083016
33-0.029306-0.29740.38337
34-0.058433-0.5930.27723
350.015240.15470.438693
360.2022212.05230.021337
37-0.13341-1.3540.089355
38-0.036498-0.37040.355918
39-0.00211-0.02140.491478
400.0180040.18270.427689
410.0839390.85190.198126
42-0.013116-0.13310.447183
43-0.034935-0.35460.361823
44-0.056074-0.56910.285266
450.0864910.87780.19105
460.02890.29330.384941
476.4e-056e-040.499742
48-0.156186-1.58510.058003


Parameters (Session):
par1 = 48 ; par2 = 1 ; par3 = 0 ; par4 = 0 ; par5 = 12 ; par6 = White Noise ; par7 = 0.95 ;
Parameters (R input):
par1 = 48 ; par2 = 1 ; par3 = 0 ; par4 = 0 ; par5 = 12 ; par6 = White Noise ; par7 = 0.95 ; par8 = ;
R code (references can be found in the software module):
if (par1 == 'Default') {
par1 = 10*log10(length(x))
} else {
par1 <- as.numeric(par1)
}
par2 <- as.numeric(par2)
par3 <- as.numeric(par3)
par4 <- as.numeric(par4)
par5 <- as.numeric(par5)
if (par6 == 'White Noise') par6 <- 'white' else par6 <- 'ma'
par7 <- as.numeric(par7)
if (par8 != '') par8 <- as.numeric(par8)
ox <- x
if (par8 == '') {
if (par2 == 0) {
x <- log(x)
} else {
x <- (x ^ par2 - 1) / par2
}
} else {
x <- log(x,base=par8)
}
if (par3 > 0) x <- diff(x,lag=1,difference=par3)
if (par4 > 0) x <- diff(x,lag=par5,difference=par4)
bitmap(file='picts.png')
op <- par(mfrow=c(2,1))
plot(ox,type='l',main='Original Time Series',xlab='time',ylab='value')
if (par8=='') {
mytitle <- paste('Working Time Series (lambda=',par2,', d=',par3,', D=',par4,')',sep='')
mysub <- paste('(lambda=',par2,', d=',par3,', D=',par4,', CI=', par7, ', CI type=',par6,')',sep='')
} else {
mytitle <- paste('Working Time Series (base=',par8,', d=',par3,', D=',par4,')',sep='')
mysub <- paste('(base=',par8,', d=',par3,', D=',par4,', CI=', par7, ', CI type=',par6,')',sep='')
}
plot(x,type='l', main=mytitle,xlab='time',ylab='value')
par(op)
dev.off()
bitmap(file='pic1.png')
racf <- acf(x, par1, main='Autocorrelation', xlab='time lag', ylab='ACF', ci.type=par6, ci=par7, sub=mysub)
dev.off()
bitmap(file='pic2.png')
rpacf <- pacf(x,par1,main='Partial Autocorrelation',xlab='lags',ylab='PACF',sub=mysub)
dev.off()
(myacf <- c(racf$acf))
(mypacf <- c(rpacf$acf))
lengthx <- length(x)
sqrtn <- sqrt(lengthx)
load(file='createtable')
a<-table.start()
a<-table.row.start(a)
a<-table.element(a,'Autocorrelation Function',4,TRUE)
a<-table.row.end(a)
a<-table.row.start(a)
a<-table.element(a,'Time lag k',header=TRUE)
a<-table.element(a,hyperlink('basics.htm','ACF(k)','click here for more information about the Autocorrelation Function'),header=TRUE)
a<-table.element(a,'T-STAT',header=TRUE)
a<-table.element(a,'P-value',header=TRUE)
a<-table.row.end(a)
for (i in 2:(par1+1)) {
a<-table.row.start(a)
a<-table.element(a,i-1,header=TRUE)
a<-table.element(a,round(myacf[i],6))
mytstat <- myacf[i]*sqrtn
a<-table.element(a,round(mytstat,4))
a<-table.element(a,round(1-pt(abs(mytstat),lengthx),6))
a<-table.row.end(a)
}
a<-table.end(a)
table.save(a,file='mytable.tab')
a<-table.start()
a<-table.row.start(a)
a<-table.element(a,'Partial Autocorrelation Function',4,TRUE)
a<-table.row.end(a)
a<-table.row.start(a)
a<-table.element(a,'Time lag k',header=TRUE)
a<-table.element(a,hyperlink('basics.htm','PACF(k)','click here for more information about the Partial Autocorrelation Function'),header=TRUE)
a<-table.element(a,'T-STAT',header=TRUE)
a<-table.element(a,'P-value',header=TRUE)
a<-table.row.end(a)
for (i in 1:par1) {
a<-table.row.start(a)
a<-table.element(a,i,header=TRUE)
a<-table.element(a,round(mypacf[i],6))
mytstat <- mypacf[i]*sqrtn
a<-table.element(a,round(mytstat,4))
a<-table.element(a,round(1-pt(abs(mytstat),lengthx),6))
a<-table.row.end(a)
}
a<-table.end(a)
table.save(a,file='mytable1.tab')