Free Statistics

of Irreproducible Research!

Author's title

Author*Unverified author*
R Software Modulerwasp_autocorrelation.wasp
Title produced by software(Partial) Autocorrelation Function
Date of computationWed, 27 Apr 2011 15:28:04 +0000
Cite this page as followsStatistical Computations at FreeStatistics.org, Office for Research Development and Education, URL https://freestatistics.org/blog/index.php?v=date/2011/Apr/27/t1303917891yyxcvbgby54xzyb.htm/, Retrieved Thu, 09 May 2024 12:46:42 +0000
Statistical Computations at FreeStatistics.org, Office for Research Development and Education, URL https://freestatistics.org/blog/index.php?pk=120669, Retrieved Thu, 09 May 2024 12:46:42 +0000
QR Codes:

Original text written by user:
IsPrivate?No (this computation is public)
User-defined keywordsKDGP2W12
Estimated Impact146
Family? (F = Feedback message, R = changed R code, M = changed R Module, P = changed Parameters, D = changed Data)
-       [(Partial) Autocorrelation Function] [Alexander De Raey...] [2011-04-27 15:28:04] [67591050a6cb6cfbed77a59a4d2c72eb] [Current]
Feedback Forum

Post a new message
Dataseries X:
2435
1379
1511
2021
1614
1680
1630
870
1877
2428
1711
127
3192
1934
2075
1700
1198
1582
1705
911
1817
1168
920
84
2254
1485
1886
1358
1167
1781
1218
779
1418
1641
1196
132
2926
1777
2094
1648
1646
1537
1917
977
1475
2124
1209
135
2917
1981
1398
1171
903
1390
1280
781
1828
1631
1063
186
2275
1342
1070
950
1121
1305
1586
548
1225
1419
880
124
2044
1143
897
1264
1326
1529
1373
587
1137
1426
1016
176
2614


Summary of computational transaction
Raw Inputview raw input (R code)
Raw Outputview raw output of R engine
Computing time2 seconds
R Server'Herman Ole Andreas Wold' @ www.yougetit.org

\begin{tabular}{lllllllll}
\hline
Summary of computational transaction \tabularnewline
Raw Input & view raw input (R code)  \tabularnewline
Raw Output & view raw output of R engine  \tabularnewline
Computing time & 2 seconds \tabularnewline
R Server & 'Herman Ole Andreas Wold' @ www.yougetit.org \tabularnewline
\hline
\end{tabular}
%Source: https://freestatistics.org/blog/index.php?pk=120669&T=0

[TABLE]
[ROW][C]Summary of computational transaction[/C][/ROW]
[ROW][C]Raw Input[/C][C]view raw input (R code) [/C][/ROW]
[ROW][C]Raw Output[/C][C]view raw output of R engine [/C][/ROW]
[ROW][C]Computing time[/C][C]2 seconds[/C][/ROW]
[ROW][C]R Server[/C][C]'Herman Ole Andreas Wold' @ www.yougetit.org[/C][/ROW]
[/TABLE]
Source: https://freestatistics.org/blog/index.php?pk=120669&T=0

Globally Unique Identifier (entire table): ba.freestatistics.org/blog/index.php?pk=120669&T=0

As an alternative you can also use a QR Code:  

The GUIDs for individual cells are displayed in the table below:

Summary of computational transaction
Raw Inputview raw input (R code)
Raw Outputview raw output of R engine
Computing time2 seconds
R Server'Herman Ole Andreas Wold' @ www.yougetit.org


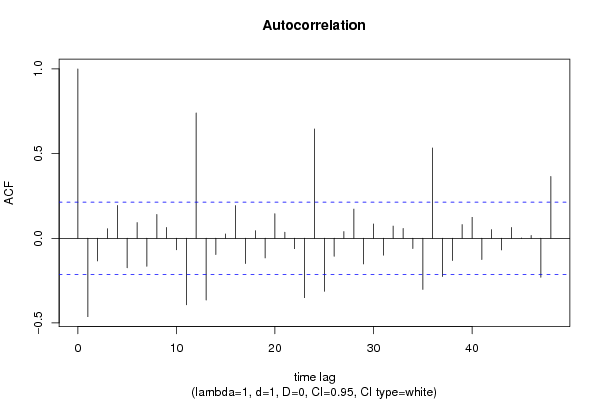
Autocorrelation Function
Time lag kACF(k)T-STATP-value
1-0.463017-4.24362.8e-05
2-0.133623-1.22470.112061
30.0558430.51180.305062
40.1933531.77210.040001
5-0.174395-1.59840.05686
60.0925660.84840.199318
7-0.165161-1.51370.066925
80.1399841.2830.101514
90.0632260.57950.281908
10-0.067565-0.61920.268717
11-0.392885-3.60090.000268
120.73946.77670
13-0.365043-3.34570.000614
14-0.096309-0.88270.189963
150.0254260.2330.408152
160.1928741.76770.04037
17-0.148969-1.36530.087898
180.0442280.40540.343124
19-0.115988-1.0630.145404
200.144721.32640.094154
210.0356790.3270.372241
22-0.06133-0.56210.287774
23-0.350789-3.2150.000926
240.6451295.91270
25-0.313196-2.87050.002592
26-0.105961-0.97120.16713
270.0393870.3610.359508
280.1720661.5770.059276
29-0.151569-1.38920.084229
300.0844320.77380.220601
31-0.099799-0.91470.18149
320.0717680.65780.256243
330.0576610.52850.299284
34-0.060135-0.55110.291497
35-0.301997-2.76780.00347
360.5331084.8862e-06
37-0.226406-2.0750.020521
38-0.131874-1.20860.115096
390.0807050.73970.230779
400.1233951.13090.130651
41-0.125879-1.15370.125947
420.0510910.46830.320409
43-0.068863-0.63110.264832
440.06320.57920.28199
450.0015270.0140.494434
460.0161590.14810.441309
47-0.230191-2.10970.018928
480.3643993.33980.000626

\begin{tabular}{lllllllll}
\hline
Autocorrelation Function \tabularnewline
Time lag k & ACF(k) & T-STAT & P-value \tabularnewline
1 & -0.463017 & -4.2436 & 2.8e-05 \tabularnewline
2 & -0.133623 & -1.2247 & 0.112061 \tabularnewline
3 & 0.055843 & 0.5118 & 0.305062 \tabularnewline
4 & 0.193353 & 1.7721 & 0.040001 \tabularnewline
5 & -0.174395 & -1.5984 & 0.05686 \tabularnewline
6 & 0.092566 & 0.8484 & 0.199318 \tabularnewline
7 & -0.165161 & -1.5137 & 0.066925 \tabularnewline
8 & 0.139984 & 1.283 & 0.101514 \tabularnewline
9 & 0.063226 & 0.5795 & 0.281908 \tabularnewline
10 & -0.067565 & -0.6192 & 0.268717 \tabularnewline
11 & -0.392885 & -3.6009 & 0.000268 \tabularnewline
12 & 0.7394 & 6.7767 & 0 \tabularnewline
13 & -0.365043 & -3.3457 & 0.000614 \tabularnewline
14 & -0.096309 & -0.8827 & 0.189963 \tabularnewline
15 & 0.025426 & 0.233 & 0.408152 \tabularnewline
16 & 0.192874 & 1.7677 & 0.04037 \tabularnewline
17 & -0.148969 & -1.3653 & 0.087898 \tabularnewline
18 & 0.044228 & 0.4054 & 0.343124 \tabularnewline
19 & -0.115988 & -1.063 & 0.145404 \tabularnewline
20 & 0.14472 & 1.3264 & 0.094154 \tabularnewline
21 & 0.035679 & 0.327 & 0.372241 \tabularnewline
22 & -0.06133 & -0.5621 & 0.287774 \tabularnewline
23 & -0.350789 & -3.215 & 0.000926 \tabularnewline
24 & 0.645129 & 5.9127 & 0 \tabularnewline
25 & -0.313196 & -2.8705 & 0.002592 \tabularnewline
26 & -0.105961 & -0.9712 & 0.16713 \tabularnewline
27 & 0.039387 & 0.361 & 0.359508 \tabularnewline
28 & 0.172066 & 1.577 & 0.059276 \tabularnewline
29 & -0.151569 & -1.3892 & 0.084229 \tabularnewline
30 & 0.084432 & 0.7738 & 0.220601 \tabularnewline
31 & -0.099799 & -0.9147 & 0.18149 \tabularnewline
32 & 0.071768 & 0.6578 & 0.256243 \tabularnewline
33 & 0.057661 & 0.5285 & 0.299284 \tabularnewline
34 & -0.060135 & -0.5511 & 0.291497 \tabularnewline
35 & -0.301997 & -2.7678 & 0.00347 \tabularnewline
36 & 0.533108 & 4.886 & 2e-06 \tabularnewline
37 & -0.226406 & -2.075 & 0.020521 \tabularnewline
38 & -0.131874 & -1.2086 & 0.115096 \tabularnewline
39 & 0.080705 & 0.7397 & 0.230779 \tabularnewline
40 & 0.123395 & 1.1309 & 0.130651 \tabularnewline
41 & -0.125879 & -1.1537 & 0.125947 \tabularnewline
42 & 0.051091 & 0.4683 & 0.320409 \tabularnewline
43 & -0.068863 & -0.6311 & 0.264832 \tabularnewline
44 & 0.0632 & 0.5792 & 0.28199 \tabularnewline
45 & 0.001527 & 0.014 & 0.494434 \tabularnewline
46 & 0.016159 & 0.1481 & 0.441309 \tabularnewline
47 & -0.230191 & -2.1097 & 0.018928 \tabularnewline
48 & 0.364399 & 3.3398 & 0.000626 \tabularnewline
\hline
\end{tabular}
%Source: https://freestatistics.org/blog/index.php?pk=120669&T=1

[TABLE]
[ROW][C]Autocorrelation Function[/C][/ROW]
[ROW][C]Time lag k[/C][C]ACF(k)[/C][C]T-STAT[/C][C]P-value[/C][/ROW]
[ROW][C]1[/C][C]-0.463017[/C][C]-4.2436[/C][C]2.8e-05[/C][/ROW]
[ROW][C]2[/C][C]-0.133623[/C][C]-1.2247[/C][C]0.112061[/C][/ROW]
[ROW][C]3[/C][C]0.055843[/C][C]0.5118[/C][C]0.305062[/C][/ROW]
[ROW][C]4[/C][C]0.193353[/C][C]1.7721[/C][C]0.040001[/C][/ROW]
[ROW][C]5[/C][C]-0.174395[/C][C]-1.5984[/C][C]0.05686[/C][/ROW]
[ROW][C]6[/C][C]0.092566[/C][C]0.8484[/C][C]0.199318[/C][/ROW]
[ROW][C]7[/C][C]-0.165161[/C][C]-1.5137[/C][C]0.066925[/C][/ROW]
[ROW][C]8[/C][C]0.139984[/C][C]1.283[/C][C]0.101514[/C][/ROW]
[ROW][C]9[/C][C]0.063226[/C][C]0.5795[/C][C]0.281908[/C][/ROW]
[ROW][C]10[/C][C]-0.067565[/C][C]-0.6192[/C][C]0.268717[/C][/ROW]
[ROW][C]11[/C][C]-0.392885[/C][C]-3.6009[/C][C]0.000268[/C][/ROW]
[ROW][C]12[/C][C]0.7394[/C][C]6.7767[/C][C]0[/C][/ROW]
[ROW][C]13[/C][C]-0.365043[/C][C]-3.3457[/C][C]0.000614[/C][/ROW]
[ROW][C]14[/C][C]-0.096309[/C][C]-0.8827[/C][C]0.189963[/C][/ROW]
[ROW][C]15[/C][C]0.025426[/C][C]0.233[/C][C]0.408152[/C][/ROW]
[ROW][C]16[/C][C]0.192874[/C][C]1.7677[/C][C]0.04037[/C][/ROW]
[ROW][C]17[/C][C]-0.148969[/C][C]-1.3653[/C][C]0.087898[/C][/ROW]
[ROW][C]18[/C][C]0.044228[/C][C]0.4054[/C][C]0.343124[/C][/ROW]
[ROW][C]19[/C][C]-0.115988[/C][C]-1.063[/C][C]0.145404[/C][/ROW]
[ROW][C]20[/C][C]0.14472[/C][C]1.3264[/C][C]0.094154[/C][/ROW]
[ROW][C]21[/C][C]0.035679[/C][C]0.327[/C][C]0.372241[/C][/ROW]
[ROW][C]22[/C][C]-0.06133[/C][C]-0.5621[/C][C]0.287774[/C][/ROW]
[ROW][C]23[/C][C]-0.350789[/C][C]-3.215[/C][C]0.000926[/C][/ROW]
[ROW][C]24[/C][C]0.645129[/C][C]5.9127[/C][C]0[/C][/ROW]
[ROW][C]25[/C][C]-0.313196[/C][C]-2.8705[/C][C]0.002592[/C][/ROW]
[ROW][C]26[/C][C]-0.105961[/C][C]-0.9712[/C][C]0.16713[/C][/ROW]
[ROW][C]27[/C][C]0.039387[/C][C]0.361[/C][C]0.359508[/C][/ROW]
[ROW][C]28[/C][C]0.172066[/C][C]1.577[/C][C]0.059276[/C][/ROW]
[ROW][C]29[/C][C]-0.151569[/C][C]-1.3892[/C][C]0.084229[/C][/ROW]
[ROW][C]30[/C][C]0.084432[/C][C]0.7738[/C][C]0.220601[/C][/ROW]
[ROW][C]31[/C][C]-0.099799[/C][C]-0.9147[/C][C]0.18149[/C][/ROW]
[ROW][C]32[/C][C]0.071768[/C][C]0.6578[/C][C]0.256243[/C][/ROW]
[ROW][C]33[/C][C]0.057661[/C][C]0.5285[/C][C]0.299284[/C][/ROW]
[ROW][C]34[/C][C]-0.060135[/C][C]-0.5511[/C][C]0.291497[/C][/ROW]
[ROW][C]35[/C][C]-0.301997[/C][C]-2.7678[/C][C]0.00347[/C][/ROW]
[ROW][C]36[/C][C]0.533108[/C][C]4.886[/C][C]2e-06[/C][/ROW]
[ROW][C]37[/C][C]-0.226406[/C][C]-2.075[/C][C]0.020521[/C][/ROW]
[ROW][C]38[/C][C]-0.131874[/C][C]-1.2086[/C][C]0.115096[/C][/ROW]
[ROW][C]39[/C][C]0.080705[/C][C]0.7397[/C][C]0.230779[/C][/ROW]
[ROW][C]40[/C][C]0.123395[/C][C]1.1309[/C][C]0.130651[/C][/ROW]
[ROW][C]41[/C][C]-0.125879[/C][C]-1.1537[/C][C]0.125947[/C][/ROW]
[ROW][C]42[/C][C]0.051091[/C][C]0.4683[/C][C]0.320409[/C][/ROW]
[ROW][C]43[/C][C]-0.068863[/C][C]-0.6311[/C][C]0.264832[/C][/ROW]
[ROW][C]44[/C][C]0.0632[/C][C]0.5792[/C][C]0.28199[/C][/ROW]
[ROW][C]45[/C][C]0.001527[/C][C]0.014[/C][C]0.494434[/C][/ROW]
[ROW][C]46[/C][C]0.016159[/C][C]0.1481[/C][C]0.441309[/C][/ROW]
[ROW][C]47[/C][C]-0.230191[/C][C]-2.1097[/C][C]0.018928[/C][/ROW]
[ROW][C]48[/C][C]0.364399[/C][C]3.3398[/C][C]0.000626[/C][/ROW]
[/TABLE]
Source: https://freestatistics.org/blog/index.php?pk=120669&T=1

Globally Unique Identifier (entire table): ba.freestatistics.org/blog/index.php?pk=120669&T=1

As an alternative you can also use a QR Code:  

The GUIDs for individual cells are displayed in the table below:

Autocorrelation Function
Time lag kACF(k)T-STATP-value
1-0.463017-4.24362.8e-05
2-0.133623-1.22470.112061
30.0558430.51180.305062
40.1933531.77210.040001
5-0.174395-1.59840.05686
60.0925660.84840.199318
7-0.165161-1.51370.066925
80.1399841.2830.101514
90.0632260.57950.281908
10-0.067565-0.61920.268717
11-0.392885-3.60090.000268
120.73946.77670
13-0.365043-3.34570.000614
14-0.096309-0.88270.189963
150.0254260.2330.408152
160.1928741.76770.04037
17-0.148969-1.36530.087898
180.0442280.40540.343124
19-0.115988-1.0630.145404
200.144721.32640.094154
210.0356790.3270.372241
22-0.06133-0.56210.287774
23-0.350789-3.2150.000926
240.6451295.91270
25-0.313196-2.87050.002592
26-0.105961-0.97120.16713
270.0393870.3610.359508
280.1720661.5770.059276
29-0.151569-1.38920.084229
300.0844320.77380.220601
31-0.099799-0.91470.18149
320.0717680.65780.256243
330.0576610.52850.299284
34-0.060135-0.55110.291497
35-0.301997-2.76780.00347
360.5331084.8862e-06
37-0.226406-2.0750.020521
38-0.131874-1.20860.115096
390.0807050.73970.230779
400.1233951.13090.130651
41-0.125879-1.15370.125947
420.0510910.46830.320409
43-0.068863-0.63110.264832
440.06320.57920.28199
450.0015270.0140.494434
460.0161590.14810.441309
47-0.230191-2.10970.018928
480.3643993.33980.000626


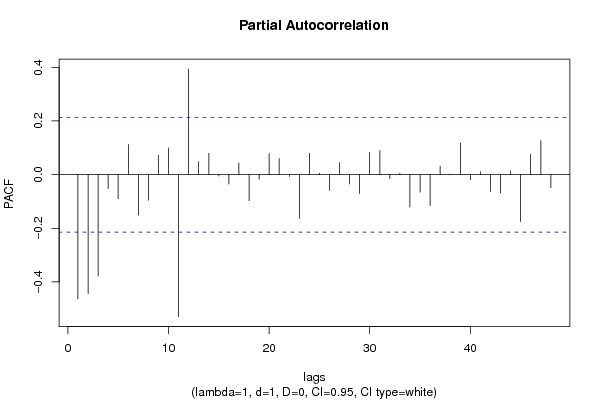
Partial Autocorrelation Function
Time lag kPACF(k)T-STATP-value
1-0.463017-4.24362.8e-05
2-0.442974-4.05995.5e-05
3-0.377757-3.46220.000423
4-0.051384-0.47090.319452
5-0.089424-0.81960.207386
60.1119681.02620.15387
7-0.150411-1.37850.085849
8-0.095439-0.87470.192112
90.072050.66040.255417
100.0993440.91050.182581
11-0.529189-4.85013e-06
120.3938583.60980.00026
130.0478640.43870.33101
140.0798340.73170.233198
15-0.005156-0.04730.481211
16-0.03493-0.32010.374827
170.0435760.39940.345314
18-0.096777-0.8870.188813
19-0.016665-0.15270.439487
200.0786940.72120.236383
210.059960.54950.292044
22-0.00637-0.05840.476793
23-0.162917-1.49320.069571
240.079320.7270.234631
250.0049140.0450.482092
26-0.058927-0.54010.295288
270.0447490.41010.341377
28-0.035005-0.32080.37457
29-0.070228-0.64360.260778
300.0827840.75870.225071
310.089520.82050.207136
32-0.014182-0.130.448448
330.0054230.04970.48024
34-0.120955-1.10860.13539
35-0.065231-0.59790.275774
36-0.115067-1.05460.147316
370.0313590.28740.387253
380.0016410.0150.494017
390.1179881.08140.141311
40-0.019281-0.17670.430079
410.0113270.10380.458782
42-0.06292-0.57670.282851
43-0.068369-0.62660.266308
440.0138220.12670.449749
45-0.174891-1.60290.056355
460.0761920.69830.243455
470.1266611.16090.124493
48-0.048939-0.44850.327461

\begin{tabular}{lllllllll}
\hline
Partial Autocorrelation Function \tabularnewline
Time lag k & PACF(k) & T-STAT & P-value \tabularnewline
1 & -0.463017 & -4.2436 & 2.8e-05 \tabularnewline
2 & -0.442974 & -4.0599 & 5.5e-05 \tabularnewline
3 & -0.377757 & -3.4622 & 0.000423 \tabularnewline
4 & -0.051384 & -0.4709 & 0.319452 \tabularnewline
5 & -0.089424 & -0.8196 & 0.207386 \tabularnewline
6 & 0.111968 & 1.0262 & 0.15387 \tabularnewline
7 & -0.150411 & -1.3785 & 0.085849 \tabularnewline
8 & -0.095439 & -0.8747 & 0.192112 \tabularnewline
9 & 0.07205 & 0.6604 & 0.255417 \tabularnewline
10 & 0.099344 & 0.9105 & 0.182581 \tabularnewline
11 & -0.529189 & -4.8501 & 3e-06 \tabularnewline
12 & 0.393858 & 3.6098 & 0.00026 \tabularnewline
13 & 0.047864 & 0.4387 & 0.33101 \tabularnewline
14 & 0.079834 & 0.7317 & 0.233198 \tabularnewline
15 & -0.005156 & -0.0473 & 0.481211 \tabularnewline
16 & -0.03493 & -0.3201 & 0.374827 \tabularnewline
17 & 0.043576 & 0.3994 & 0.345314 \tabularnewline
18 & -0.096777 & -0.887 & 0.188813 \tabularnewline
19 & -0.016665 & -0.1527 & 0.439487 \tabularnewline
20 & 0.078694 & 0.7212 & 0.236383 \tabularnewline
21 & 0.05996 & 0.5495 & 0.292044 \tabularnewline
22 & -0.00637 & -0.0584 & 0.476793 \tabularnewline
23 & -0.162917 & -1.4932 & 0.069571 \tabularnewline
24 & 0.07932 & 0.727 & 0.234631 \tabularnewline
25 & 0.004914 & 0.045 & 0.482092 \tabularnewline
26 & -0.058927 & -0.5401 & 0.295288 \tabularnewline
27 & 0.044749 & 0.4101 & 0.341377 \tabularnewline
28 & -0.035005 & -0.3208 & 0.37457 \tabularnewline
29 & -0.070228 & -0.6436 & 0.260778 \tabularnewline
30 & 0.082784 & 0.7587 & 0.225071 \tabularnewline
31 & 0.08952 & 0.8205 & 0.207136 \tabularnewline
32 & -0.014182 & -0.13 & 0.448448 \tabularnewline
33 & 0.005423 & 0.0497 & 0.48024 \tabularnewline
34 & -0.120955 & -1.1086 & 0.13539 \tabularnewline
35 & -0.065231 & -0.5979 & 0.275774 \tabularnewline
36 & -0.115067 & -1.0546 & 0.147316 \tabularnewline
37 & 0.031359 & 0.2874 & 0.387253 \tabularnewline
38 & 0.001641 & 0.015 & 0.494017 \tabularnewline
39 & 0.117988 & 1.0814 & 0.141311 \tabularnewline
40 & -0.019281 & -0.1767 & 0.430079 \tabularnewline
41 & 0.011327 & 0.1038 & 0.458782 \tabularnewline
42 & -0.06292 & -0.5767 & 0.282851 \tabularnewline
43 & -0.068369 & -0.6266 & 0.266308 \tabularnewline
44 & 0.013822 & 0.1267 & 0.449749 \tabularnewline
45 & -0.174891 & -1.6029 & 0.056355 \tabularnewline
46 & 0.076192 & 0.6983 & 0.243455 \tabularnewline
47 & 0.126661 & 1.1609 & 0.124493 \tabularnewline
48 & -0.048939 & -0.4485 & 0.327461 \tabularnewline
\hline
\end{tabular}
%Source: https://freestatistics.org/blog/index.php?pk=120669&T=2

[TABLE]
[ROW][C]Partial Autocorrelation Function[/C][/ROW]
[ROW][C]Time lag k[/C][C]PACF(k)[/C][C]T-STAT[/C][C]P-value[/C][/ROW]
[ROW][C]1[/C][C]-0.463017[/C][C]-4.2436[/C][C]2.8e-05[/C][/ROW]
[ROW][C]2[/C][C]-0.442974[/C][C]-4.0599[/C][C]5.5e-05[/C][/ROW]
[ROW][C]3[/C][C]-0.377757[/C][C]-3.4622[/C][C]0.000423[/C][/ROW]
[ROW][C]4[/C][C]-0.051384[/C][C]-0.4709[/C][C]0.319452[/C][/ROW]
[ROW][C]5[/C][C]-0.089424[/C][C]-0.8196[/C][C]0.207386[/C][/ROW]
[ROW][C]6[/C][C]0.111968[/C][C]1.0262[/C][C]0.15387[/C][/ROW]
[ROW][C]7[/C][C]-0.150411[/C][C]-1.3785[/C][C]0.085849[/C][/ROW]
[ROW][C]8[/C][C]-0.095439[/C][C]-0.8747[/C][C]0.192112[/C][/ROW]
[ROW][C]9[/C][C]0.07205[/C][C]0.6604[/C][C]0.255417[/C][/ROW]
[ROW][C]10[/C][C]0.099344[/C][C]0.9105[/C][C]0.182581[/C][/ROW]
[ROW][C]11[/C][C]-0.529189[/C][C]-4.8501[/C][C]3e-06[/C][/ROW]
[ROW][C]12[/C][C]0.393858[/C][C]3.6098[/C][C]0.00026[/C][/ROW]
[ROW][C]13[/C][C]0.047864[/C][C]0.4387[/C][C]0.33101[/C][/ROW]
[ROW][C]14[/C][C]0.079834[/C][C]0.7317[/C][C]0.233198[/C][/ROW]
[ROW][C]15[/C][C]-0.005156[/C][C]-0.0473[/C][C]0.481211[/C][/ROW]
[ROW][C]16[/C][C]-0.03493[/C][C]-0.3201[/C][C]0.374827[/C][/ROW]
[ROW][C]17[/C][C]0.043576[/C][C]0.3994[/C][C]0.345314[/C][/ROW]
[ROW][C]18[/C][C]-0.096777[/C][C]-0.887[/C][C]0.188813[/C][/ROW]
[ROW][C]19[/C][C]-0.016665[/C][C]-0.1527[/C][C]0.439487[/C][/ROW]
[ROW][C]20[/C][C]0.078694[/C][C]0.7212[/C][C]0.236383[/C][/ROW]
[ROW][C]21[/C][C]0.05996[/C][C]0.5495[/C][C]0.292044[/C][/ROW]
[ROW][C]22[/C][C]-0.00637[/C][C]-0.0584[/C][C]0.476793[/C][/ROW]
[ROW][C]23[/C][C]-0.162917[/C][C]-1.4932[/C][C]0.069571[/C][/ROW]
[ROW][C]24[/C][C]0.07932[/C][C]0.727[/C][C]0.234631[/C][/ROW]
[ROW][C]25[/C][C]0.004914[/C][C]0.045[/C][C]0.482092[/C][/ROW]
[ROW][C]26[/C][C]-0.058927[/C][C]-0.5401[/C][C]0.295288[/C][/ROW]
[ROW][C]27[/C][C]0.044749[/C][C]0.4101[/C][C]0.341377[/C][/ROW]
[ROW][C]28[/C][C]-0.035005[/C][C]-0.3208[/C][C]0.37457[/C][/ROW]
[ROW][C]29[/C][C]-0.070228[/C][C]-0.6436[/C][C]0.260778[/C][/ROW]
[ROW][C]30[/C][C]0.082784[/C][C]0.7587[/C][C]0.225071[/C][/ROW]
[ROW][C]31[/C][C]0.08952[/C][C]0.8205[/C][C]0.207136[/C][/ROW]
[ROW][C]32[/C][C]-0.014182[/C][C]-0.13[/C][C]0.448448[/C][/ROW]
[ROW][C]33[/C][C]0.005423[/C][C]0.0497[/C][C]0.48024[/C][/ROW]
[ROW][C]34[/C][C]-0.120955[/C][C]-1.1086[/C][C]0.13539[/C][/ROW]
[ROW][C]35[/C][C]-0.065231[/C][C]-0.5979[/C][C]0.275774[/C][/ROW]
[ROW][C]36[/C][C]-0.115067[/C][C]-1.0546[/C][C]0.147316[/C][/ROW]
[ROW][C]37[/C][C]0.031359[/C][C]0.2874[/C][C]0.387253[/C][/ROW]
[ROW][C]38[/C][C]0.001641[/C][C]0.015[/C][C]0.494017[/C][/ROW]
[ROW][C]39[/C][C]0.117988[/C][C]1.0814[/C][C]0.141311[/C][/ROW]
[ROW][C]40[/C][C]-0.019281[/C][C]-0.1767[/C][C]0.430079[/C][/ROW]
[ROW][C]41[/C][C]0.011327[/C][C]0.1038[/C][C]0.458782[/C][/ROW]
[ROW][C]42[/C][C]-0.06292[/C][C]-0.5767[/C][C]0.282851[/C][/ROW]
[ROW][C]43[/C][C]-0.068369[/C][C]-0.6266[/C][C]0.266308[/C][/ROW]
[ROW][C]44[/C][C]0.013822[/C][C]0.1267[/C][C]0.449749[/C][/ROW]
[ROW][C]45[/C][C]-0.174891[/C][C]-1.6029[/C][C]0.056355[/C][/ROW]
[ROW][C]46[/C][C]0.076192[/C][C]0.6983[/C][C]0.243455[/C][/ROW]
[ROW][C]47[/C][C]0.126661[/C][C]1.1609[/C][C]0.124493[/C][/ROW]
[ROW][C]48[/C][C]-0.048939[/C][C]-0.4485[/C][C]0.327461[/C][/ROW]
[/TABLE]
Source: https://freestatistics.org/blog/index.php?pk=120669&T=2

Globally Unique Identifier (entire table): ba.freestatistics.org/blog/index.php?pk=120669&T=2

As an alternative you can also use a QR Code:  

The GUIDs for individual cells are displayed in the table below:

Partial Autocorrelation Function
Time lag kPACF(k)T-STATP-value
1-0.463017-4.24362.8e-05
2-0.442974-4.05995.5e-05
3-0.377757-3.46220.000423
4-0.051384-0.47090.319452
5-0.089424-0.81960.207386
60.1119681.02620.15387
7-0.150411-1.37850.085849
8-0.095439-0.87470.192112
90.072050.66040.255417
100.0993440.91050.182581
11-0.529189-4.85013e-06
120.3938583.60980.00026
130.0478640.43870.33101
140.0798340.73170.233198
15-0.005156-0.04730.481211
16-0.03493-0.32010.374827
170.0435760.39940.345314
18-0.096777-0.8870.188813
19-0.016665-0.15270.439487
200.0786940.72120.236383
210.059960.54950.292044
22-0.00637-0.05840.476793
23-0.162917-1.49320.069571
240.079320.7270.234631
250.0049140.0450.482092
26-0.058927-0.54010.295288
270.0447490.41010.341377
28-0.035005-0.32080.37457
29-0.070228-0.64360.260778
300.0827840.75870.225071
310.089520.82050.207136
32-0.014182-0.130.448448
330.0054230.04970.48024
34-0.120955-1.10860.13539
35-0.065231-0.59790.275774
36-0.115067-1.05460.147316
370.0313590.28740.387253
380.0016410.0150.494017
390.1179881.08140.141311
40-0.019281-0.17670.430079
410.0113270.10380.458782
42-0.06292-0.57670.282851
43-0.068369-0.62660.266308
440.0138220.12670.449749
45-0.174891-1.60290.056355
460.0761920.69830.243455
470.1266611.16090.124493
48-0.048939-0.44850.327461


Parameters (Session):
par1 = 48 ; par2 = 1 ; par3 = 1 ; par4 = 0 ; par5 = 12 ; par6 = White Noise ; par7 = 0.95 ;
Parameters (R input):
par1 = 48 ; par2 = 1 ; par3 = 1 ; par4 = 0 ; par5 = 12 ; par6 = White Noise ; par7 = 0.95 ; par8 = ;
R code (references can be found in the software module):
if (par1 == 'Default') {
par1 = 10*log10(length(x))
} else {
par1 <- as.numeric(par1)
}
par2 <- as.numeric(par2)
par3 <- as.numeric(par3)
par4 <- as.numeric(par4)
par5 <- as.numeric(par5)
if (par6 == 'White Noise') par6 <- 'white' else par6 <- 'ma'
par7 <- as.numeric(par7)
if (par8 != '') par8 <- as.numeric(par8)
ox <- x
if (par8 == '') {
if (par2 == 0) {
x <- log(x)
} else {
x <- (x ^ par2 - 1) / par2
}
} else {
x <- log(x,base=par8)
}
if (par3 > 0) x <- diff(x,lag=1,difference=par3)
if (par4 > 0) x <- diff(x,lag=par5,difference=par4)
bitmap(file='picts.png')
op <- par(mfrow=c(2,1))
plot(ox,type='l',main='Original Time Series',xlab='time',ylab='value')
if (par8=='') {
mytitle <- paste('Working Time Series (lambda=',par2,', d=',par3,', D=',par4,')',sep='')
mysub <- paste('(lambda=',par2,', d=',par3,', D=',par4,', CI=', par7, ', CI type=',par6,')',sep='')
} else {
mytitle <- paste('Working Time Series (base=',par8,', d=',par3,', D=',par4,')',sep='')
mysub <- paste('(base=',par8,', d=',par3,', D=',par4,', CI=', par7, ', CI type=',par6,')',sep='')
}
plot(x,type='l', main=mytitle,xlab='time',ylab='value')
par(op)
dev.off()
bitmap(file='pic1.png')
racf <- acf(x, par1, main='Autocorrelation', xlab='time lag', ylab='ACF', ci.type=par6, ci=par7, sub=mysub)
dev.off()
bitmap(file='pic2.png')
rpacf <- pacf(x,par1,main='Partial Autocorrelation',xlab='lags',ylab='PACF',sub=mysub)
dev.off()
(myacf <- c(racf$acf))
(mypacf <- c(rpacf$acf))
lengthx <- length(x)
sqrtn <- sqrt(lengthx)
load(file='createtable')
a<-table.start()
a<-table.row.start(a)
a<-table.element(a,'Autocorrelation Function',4,TRUE)
a<-table.row.end(a)
a<-table.row.start(a)
a<-table.element(a,'Time lag k',header=TRUE)
a<-table.element(a,hyperlink('basics.htm','ACF(k)','click here for more information about the Autocorrelation Function'),header=TRUE)
a<-table.element(a,'T-STAT',header=TRUE)
a<-table.element(a,'P-value',header=TRUE)
a<-table.row.end(a)
for (i in 2:(par1+1)) {
a<-table.row.start(a)
a<-table.element(a,i-1,header=TRUE)
a<-table.element(a,round(myacf[i],6))
mytstat <- myacf[i]*sqrtn
a<-table.element(a,round(mytstat,4))
a<-table.element(a,round(1-pt(abs(mytstat),lengthx),6))
a<-table.row.end(a)
}
a<-table.end(a)
table.save(a,file='mytable.tab')
a<-table.start()
a<-table.row.start(a)
a<-table.element(a,'Partial Autocorrelation Function',4,TRUE)
a<-table.row.end(a)
a<-table.row.start(a)
a<-table.element(a,'Time lag k',header=TRUE)
a<-table.element(a,hyperlink('basics.htm','PACF(k)','click here for more information about the Partial Autocorrelation Function'),header=TRUE)
a<-table.element(a,'T-STAT',header=TRUE)
a<-table.element(a,'P-value',header=TRUE)
a<-table.row.end(a)
for (i in 1:par1) {
a<-table.row.start(a)
a<-table.element(a,i,header=TRUE)
a<-table.element(a,round(mypacf[i],6))
mytstat <- mypacf[i]*sqrtn
a<-table.element(a,round(mytstat,4))
a<-table.element(a,round(1-pt(abs(mytstat),lengthx),6))
a<-table.row.end(a)
}
a<-table.end(a)
table.save(a,file='mytable1.tab')