Free Statistics

of Irreproducible Research!

Author's title

Author*Unverified author*
R Software Modulerwasp_autocorrelation.wasp
Title produced by software(Partial) Autocorrelation Function
Date of computationWed, 27 Apr 2011 14:22:12 +0000
Cite this page as followsStatistical Computations at FreeStatistics.org, Office for Research Development and Education, URL https://freestatistics.org/blog/index.php?v=date/2011/Apr/27/t1303913919padkd46ajaa32pi.htm/, Retrieved Thu, 09 May 2024 02:53:58 +0000
Statistical Computations at FreeStatistics.org, Office for Research Development and Education, URL https://freestatistics.org/blog/index.php?pk=120666, Retrieved Thu, 09 May 2024 02:53:58 +0000
QR Codes:

Original text written by user:
IsPrivate?No (this computation is public)
User-defined keywordsKDGP2W11
Estimated Impact167
Family? (F = Feedback message, R = changed R code, M = changed R Module, P = changed Parameters, D = changed Data)
-       [(Partial) Autocorrelation Function] [Alexander De Raey...] [2011-04-27 14:22:12] [67591050a6cb6cfbed77a59a4d2c72eb] [Current]
Feedback Forum

Post a new message
Dataseries X:
41086
39690
43129
37863
35953
29133
24693
22205
21725
27192
21790
13253
37702
30364
32609
30212
29965
28352
25814
22414
20506
28806
22228
13971
36845
35338
35022
34777
26887
23970
22780
17351
21382
24561
17409
11514
31514
27071
29462
26105
22397
23843
21705
18089
20764
25316
17704
15548
28029
29383
36438
32034
22679
24319
18004
17537


Summary of computational transaction
Raw Inputview raw input (R code)
Raw Outputview raw output of R engine
Computing time2 seconds
R Server'George Udny Yule' @ 216.218.223.82

\begin{tabular}{lllllllll}
\hline
Summary of computational transaction \tabularnewline
Raw Input & view raw input (R code)  \tabularnewline
Raw Output & view raw output of R engine  \tabularnewline
Computing time & 2 seconds \tabularnewline
R Server & 'George Udny Yule' @ 216.218.223.82 \tabularnewline
\hline
\end{tabular}
%Source: https://freestatistics.org/blog/index.php?pk=120666&T=0

[TABLE]
[ROW][C]Summary of computational transaction[/C][/ROW]
[ROW][C]Raw Input[/C][C]view raw input (R code) [/C][/ROW]
[ROW][C]Raw Output[/C][C]view raw output of R engine [/C][/ROW]
[ROW][C]Computing time[/C][C]2 seconds[/C][/ROW]
[ROW][C]R Server[/C][C]'George Udny Yule' @ 216.218.223.82[/C][/ROW]
[/TABLE]
Source: https://freestatistics.org/blog/index.php?pk=120666&T=0

Globally Unique Identifier (entire table): ba.freestatistics.org/blog/index.php?pk=120666&T=0

As an alternative you can also use a QR Code:  

The GUIDs for individual cells are displayed in the table below:

Summary of computational transaction
Raw Inputview raw input (R code)
Raw Outputview raw output of R engine
Computing time2 seconds
R Server'George Udny Yule' @ 216.218.223.82


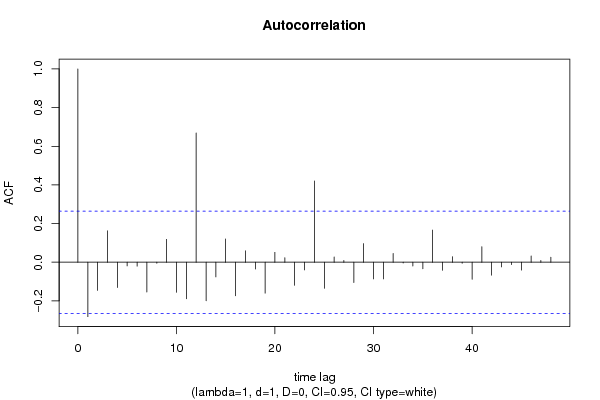
Autocorrelation Function
Time lag kACF(k)T-STATP-value
1-0.281751-2.08950.02065
2-0.14581-1.08140.142129
30.1620081.20150.117356
4-0.130945-0.97110.167871
5-0.018957-0.14060.444356
6-0.020546-0.15240.439724
7-0.154161-1.14330.128935
8-0.005186-0.03850.484729
90.1182080.87670.192243
10-0.155649-1.15430.126679
11-0.189128-1.40260.083177
120.6684494.95744e-06
13-0.19973-1.48120.072125
14-0.076016-0.56380.287607
150.1203040.89220.188086
16-0.17394-1.290.101228
170.0586620.4350.332614
18-0.035051-0.25990.397939
19-0.160083-1.18720.120124
200.0508740.37730.353705
210.0230160.17070.432547
22-0.11899-0.88250.190687
23-0.039705-0.29450.384758
240.4200233.1150.00146
25-0.134911-1.00050.160719
260.0268290.1990.42151
270.0087810.06510.474158
28-0.104924-0.77810.219911
290.0960050.7120.23974
30-0.086269-0.63980.262484
31-0.08651-0.64160.261906
320.0447350.33180.370665
33-0.003923-0.02910.488448
34-0.020122-0.14920.440961
35-0.034296-0.25430.400088
360.1661831.23240.111513
37-0.041723-0.30940.379082
380.0280350.20790.418031
39-0.00545-0.04040.483952
40-0.088358-0.65530.257509
410.0801010.5940.277459
42-0.066987-0.49680.310658
43-0.0244-0.1810.428533
44-0.012426-0.09220.463457
45-0.040858-0.3030.381511
460.0321730.23860.406152
470.0090360.0670.473406
480.0253810.18820.425694

\begin{tabular}{lllllllll}
\hline
Autocorrelation Function \tabularnewline
Time lag k & ACF(k) & T-STAT & P-value \tabularnewline
1 & -0.281751 & -2.0895 & 0.02065 \tabularnewline
2 & -0.14581 & -1.0814 & 0.142129 \tabularnewline
3 & 0.162008 & 1.2015 & 0.117356 \tabularnewline
4 & -0.130945 & -0.9711 & 0.167871 \tabularnewline
5 & -0.018957 & -0.1406 & 0.444356 \tabularnewline
6 & -0.020546 & -0.1524 & 0.439724 \tabularnewline
7 & -0.154161 & -1.1433 & 0.128935 \tabularnewline
8 & -0.005186 & -0.0385 & 0.484729 \tabularnewline
9 & 0.118208 & 0.8767 & 0.192243 \tabularnewline
10 & -0.155649 & -1.1543 & 0.126679 \tabularnewline
11 & -0.189128 & -1.4026 & 0.083177 \tabularnewline
12 & 0.668449 & 4.9574 & 4e-06 \tabularnewline
13 & -0.19973 & -1.4812 & 0.072125 \tabularnewline
14 & -0.076016 & -0.5638 & 0.287607 \tabularnewline
15 & 0.120304 & 0.8922 & 0.188086 \tabularnewline
16 & -0.17394 & -1.29 & 0.101228 \tabularnewline
17 & 0.058662 & 0.435 & 0.332614 \tabularnewline
18 & -0.035051 & -0.2599 & 0.397939 \tabularnewline
19 & -0.160083 & -1.1872 & 0.120124 \tabularnewline
20 & 0.050874 & 0.3773 & 0.353705 \tabularnewline
21 & 0.023016 & 0.1707 & 0.432547 \tabularnewline
22 & -0.11899 & -0.8825 & 0.190687 \tabularnewline
23 & -0.039705 & -0.2945 & 0.384758 \tabularnewline
24 & 0.420023 & 3.115 & 0.00146 \tabularnewline
25 & -0.134911 & -1.0005 & 0.160719 \tabularnewline
26 & 0.026829 & 0.199 & 0.42151 \tabularnewline
27 & 0.008781 & 0.0651 & 0.474158 \tabularnewline
28 & -0.104924 & -0.7781 & 0.219911 \tabularnewline
29 & 0.096005 & 0.712 & 0.23974 \tabularnewline
30 & -0.086269 & -0.6398 & 0.262484 \tabularnewline
31 & -0.08651 & -0.6416 & 0.261906 \tabularnewline
32 & 0.044735 & 0.3318 & 0.370665 \tabularnewline
33 & -0.003923 & -0.0291 & 0.488448 \tabularnewline
34 & -0.020122 & -0.1492 & 0.440961 \tabularnewline
35 & -0.034296 & -0.2543 & 0.400088 \tabularnewline
36 & 0.166183 & 1.2324 & 0.111513 \tabularnewline
37 & -0.041723 & -0.3094 & 0.379082 \tabularnewline
38 & 0.028035 & 0.2079 & 0.418031 \tabularnewline
39 & -0.00545 & -0.0404 & 0.483952 \tabularnewline
40 & -0.088358 & -0.6553 & 0.257509 \tabularnewline
41 & 0.080101 & 0.594 & 0.277459 \tabularnewline
42 & -0.066987 & -0.4968 & 0.310658 \tabularnewline
43 & -0.0244 & -0.181 & 0.428533 \tabularnewline
44 & -0.012426 & -0.0922 & 0.463457 \tabularnewline
45 & -0.040858 & -0.303 & 0.381511 \tabularnewline
46 & 0.032173 & 0.2386 & 0.406152 \tabularnewline
47 & 0.009036 & 0.067 & 0.473406 \tabularnewline
48 & 0.025381 & 0.1882 & 0.425694 \tabularnewline
\hline
\end{tabular}
%Source: https://freestatistics.org/blog/index.php?pk=120666&T=1

[TABLE]
[ROW][C]Autocorrelation Function[/C][/ROW]
[ROW][C]Time lag k[/C][C]ACF(k)[/C][C]T-STAT[/C][C]P-value[/C][/ROW]
[ROW][C]1[/C][C]-0.281751[/C][C]-2.0895[/C][C]0.02065[/C][/ROW]
[ROW][C]2[/C][C]-0.14581[/C][C]-1.0814[/C][C]0.142129[/C][/ROW]
[ROW][C]3[/C][C]0.162008[/C][C]1.2015[/C][C]0.117356[/C][/ROW]
[ROW][C]4[/C][C]-0.130945[/C][C]-0.9711[/C][C]0.167871[/C][/ROW]
[ROW][C]5[/C][C]-0.018957[/C][C]-0.1406[/C][C]0.444356[/C][/ROW]
[ROW][C]6[/C][C]-0.020546[/C][C]-0.1524[/C][C]0.439724[/C][/ROW]
[ROW][C]7[/C][C]-0.154161[/C][C]-1.1433[/C][C]0.128935[/C][/ROW]
[ROW][C]8[/C][C]-0.005186[/C][C]-0.0385[/C][C]0.484729[/C][/ROW]
[ROW][C]9[/C][C]0.118208[/C][C]0.8767[/C][C]0.192243[/C][/ROW]
[ROW][C]10[/C][C]-0.155649[/C][C]-1.1543[/C][C]0.126679[/C][/ROW]
[ROW][C]11[/C][C]-0.189128[/C][C]-1.4026[/C][C]0.083177[/C][/ROW]
[ROW][C]12[/C][C]0.668449[/C][C]4.9574[/C][C]4e-06[/C][/ROW]
[ROW][C]13[/C][C]-0.19973[/C][C]-1.4812[/C][C]0.072125[/C][/ROW]
[ROW][C]14[/C][C]-0.076016[/C][C]-0.5638[/C][C]0.287607[/C][/ROW]
[ROW][C]15[/C][C]0.120304[/C][C]0.8922[/C][C]0.188086[/C][/ROW]
[ROW][C]16[/C][C]-0.17394[/C][C]-1.29[/C][C]0.101228[/C][/ROW]
[ROW][C]17[/C][C]0.058662[/C][C]0.435[/C][C]0.332614[/C][/ROW]
[ROW][C]18[/C][C]-0.035051[/C][C]-0.2599[/C][C]0.397939[/C][/ROW]
[ROW][C]19[/C][C]-0.160083[/C][C]-1.1872[/C][C]0.120124[/C][/ROW]
[ROW][C]20[/C][C]0.050874[/C][C]0.3773[/C][C]0.353705[/C][/ROW]
[ROW][C]21[/C][C]0.023016[/C][C]0.1707[/C][C]0.432547[/C][/ROW]
[ROW][C]22[/C][C]-0.11899[/C][C]-0.8825[/C][C]0.190687[/C][/ROW]
[ROW][C]23[/C][C]-0.039705[/C][C]-0.2945[/C][C]0.384758[/C][/ROW]
[ROW][C]24[/C][C]0.420023[/C][C]3.115[/C][C]0.00146[/C][/ROW]
[ROW][C]25[/C][C]-0.134911[/C][C]-1.0005[/C][C]0.160719[/C][/ROW]
[ROW][C]26[/C][C]0.026829[/C][C]0.199[/C][C]0.42151[/C][/ROW]
[ROW][C]27[/C][C]0.008781[/C][C]0.0651[/C][C]0.474158[/C][/ROW]
[ROW][C]28[/C][C]-0.104924[/C][C]-0.7781[/C][C]0.219911[/C][/ROW]
[ROW][C]29[/C][C]0.096005[/C][C]0.712[/C][C]0.23974[/C][/ROW]
[ROW][C]30[/C][C]-0.086269[/C][C]-0.6398[/C][C]0.262484[/C][/ROW]
[ROW][C]31[/C][C]-0.08651[/C][C]-0.6416[/C][C]0.261906[/C][/ROW]
[ROW][C]32[/C][C]0.044735[/C][C]0.3318[/C][C]0.370665[/C][/ROW]
[ROW][C]33[/C][C]-0.003923[/C][C]-0.0291[/C][C]0.488448[/C][/ROW]
[ROW][C]34[/C][C]-0.020122[/C][C]-0.1492[/C][C]0.440961[/C][/ROW]
[ROW][C]35[/C][C]-0.034296[/C][C]-0.2543[/C][C]0.400088[/C][/ROW]
[ROW][C]36[/C][C]0.166183[/C][C]1.2324[/C][C]0.111513[/C][/ROW]
[ROW][C]37[/C][C]-0.041723[/C][C]-0.3094[/C][C]0.379082[/C][/ROW]
[ROW][C]38[/C][C]0.028035[/C][C]0.2079[/C][C]0.418031[/C][/ROW]
[ROW][C]39[/C][C]-0.00545[/C][C]-0.0404[/C][C]0.483952[/C][/ROW]
[ROW][C]40[/C][C]-0.088358[/C][C]-0.6553[/C][C]0.257509[/C][/ROW]
[ROW][C]41[/C][C]0.080101[/C][C]0.594[/C][C]0.277459[/C][/ROW]
[ROW][C]42[/C][C]-0.066987[/C][C]-0.4968[/C][C]0.310658[/C][/ROW]
[ROW][C]43[/C][C]-0.0244[/C][C]-0.181[/C][C]0.428533[/C][/ROW]
[ROW][C]44[/C][C]-0.012426[/C][C]-0.0922[/C][C]0.463457[/C][/ROW]
[ROW][C]45[/C][C]-0.040858[/C][C]-0.303[/C][C]0.381511[/C][/ROW]
[ROW][C]46[/C][C]0.032173[/C][C]0.2386[/C][C]0.406152[/C][/ROW]
[ROW][C]47[/C][C]0.009036[/C][C]0.067[/C][C]0.473406[/C][/ROW]
[ROW][C]48[/C][C]0.025381[/C][C]0.1882[/C][C]0.425694[/C][/ROW]
[/TABLE]
Source: https://freestatistics.org/blog/index.php?pk=120666&T=1

Globally Unique Identifier (entire table): ba.freestatistics.org/blog/index.php?pk=120666&T=1

As an alternative you can also use a QR Code:  

The GUIDs for individual cells are displayed in the table below:

Autocorrelation Function
Time lag kACF(k)T-STATP-value
1-0.281751-2.08950.02065
2-0.14581-1.08140.142129
30.1620081.20150.117356
4-0.130945-0.97110.167871
5-0.018957-0.14060.444356
6-0.020546-0.15240.439724
7-0.154161-1.14330.128935
8-0.005186-0.03850.484729
90.1182080.87670.192243
10-0.155649-1.15430.126679
11-0.189128-1.40260.083177
120.6684494.95744e-06
13-0.19973-1.48120.072125
14-0.076016-0.56380.287607
150.1203040.89220.188086
16-0.17394-1.290.101228
170.0586620.4350.332614
18-0.035051-0.25990.397939
19-0.160083-1.18720.120124
200.0508740.37730.353705
210.0230160.17070.432547
22-0.11899-0.88250.190687
23-0.039705-0.29450.384758
240.4200233.1150.00146
25-0.134911-1.00050.160719
260.0268290.1990.42151
270.0087810.06510.474158
28-0.104924-0.77810.219911
290.0960050.7120.23974
30-0.086269-0.63980.262484
31-0.08651-0.64160.261906
320.0447350.33180.370665
33-0.003923-0.02910.488448
34-0.020122-0.14920.440961
35-0.034296-0.25430.400088
360.1661831.23240.111513
37-0.041723-0.30940.379082
380.0280350.20790.418031
39-0.00545-0.04040.483952
40-0.088358-0.65530.257509
410.0801010.5940.277459
42-0.066987-0.49680.310658
43-0.0244-0.1810.428533
44-0.012426-0.09220.463457
45-0.040858-0.3030.381511
460.0321730.23860.406152
470.0090360.0670.473406
480.0253810.18820.425694


Partial Autocorrelation Function
Time lag kPACF(k)T-STATP-value
1-0.281751-2.08950.02065
2-0.244612-1.81410.03756
30.0484750.35950.360298
4-0.110695-0.82090.207613
5-0.06009-0.44560.328803
6-0.112163-0.83180.204554
7-0.222994-1.65380.051936
8-0.194465-1.44220.077459
9-0.02469-0.18310.427693
10-0.191548-1.42060.080545
11-0.441865-3.2770.00091
120.486913.6110.00033
130.0880250.65280.258298
140.051850.38450.351034
15-0.058265-0.43210.333678
16-0.062574-0.46410.322218
17-0.064334-0.47710.317586
18-0.092865-0.68870.246952
190.0133980.09940.460606
20-0.042511-0.31530.376876
21-0.153706-1.13990.129631
22-0.112773-0.83630.20329
230.0682470.50610.307394
240.0185860.13780.445436
25-0.02514-0.18640.426393
260.085910.63710.263343
27-0.112636-0.83530.203572
280.0198020.14690.441891
290.0143880.10670.457706
300.0082330.06110.475767
310.0378890.2810.389886
32-0.049035-0.36370.358755
330.0871230.64610.260445
340.1525331.13120.131436
350.0289380.21460.415432
36-0.197443-1.46430.074405
37-0.064937-0.48160.316006
38-0.115267-0.85480.198173
390.0679760.50410.308093
40-0.035335-0.26210.39713
41-0.029356-0.21770.41423
42-0.006121-0.04540.481977
43-0.035009-0.25960.398058
44-0.014833-0.110.456403
45-0.045623-0.33840.368194
46-0.122585-0.90910.183628
47-0.03245-0.24070.405358
48-0.068492-0.5080.30676

\begin{tabular}{lllllllll}
\hline
Partial Autocorrelation Function \tabularnewline
Time lag k & PACF(k) & T-STAT & P-value \tabularnewline
1 & -0.281751 & -2.0895 & 0.02065 \tabularnewline
2 & -0.244612 & -1.8141 & 0.03756 \tabularnewline
3 & 0.048475 & 0.3595 & 0.360298 \tabularnewline
4 & -0.110695 & -0.8209 & 0.207613 \tabularnewline
5 & -0.06009 & -0.4456 & 0.328803 \tabularnewline
6 & -0.112163 & -0.8318 & 0.204554 \tabularnewline
7 & -0.222994 & -1.6538 & 0.051936 \tabularnewline
8 & -0.194465 & -1.4422 & 0.077459 \tabularnewline
9 & -0.02469 & -0.1831 & 0.427693 \tabularnewline
10 & -0.191548 & -1.4206 & 0.080545 \tabularnewline
11 & -0.441865 & -3.277 & 0.00091 \tabularnewline
12 & 0.48691 & 3.611 & 0.00033 \tabularnewline
13 & 0.088025 & 0.6528 & 0.258298 \tabularnewline
14 & 0.05185 & 0.3845 & 0.351034 \tabularnewline
15 & -0.058265 & -0.4321 & 0.333678 \tabularnewline
16 & -0.062574 & -0.4641 & 0.322218 \tabularnewline
17 & -0.064334 & -0.4771 & 0.317586 \tabularnewline
18 & -0.092865 & -0.6887 & 0.246952 \tabularnewline
19 & 0.013398 & 0.0994 & 0.460606 \tabularnewline
20 & -0.042511 & -0.3153 & 0.376876 \tabularnewline
21 & -0.153706 & -1.1399 & 0.129631 \tabularnewline
22 & -0.112773 & -0.8363 & 0.20329 \tabularnewline
23 & 0.068247 & 0.5061 & 0.307394 \tabularnewline
24 & 0.018586 & 0.1378 & 0.445436 \tabularnewline
25 & -0.02514 & -0.1864 & 0.426393 \tabularnewline
26 & 0.08591 & 0.6371 & 0.263343 \tabularnewline
27 & -0.112636 & -0.8353 & 0.203572 \tabularnewline
28 & 0.019802 & 0.1469 & 0.441891 \tabularnewline
29 & 0.014388 & 0.1067 & 0.457706 \tabularnewline
30 & 0.008233 & 0.0611 & 0.475767 \tabularnewline
31 & 0.037889 & 0.281 & 0.389886 \tabularnewline
32 & -0.049035 & -0.3637 & 0.358755 \tabularnewline
33 & 0.087123 & 0.6461 & 0.260445 \tabularnewline
34 & 0.152533 & 1.1312 & 0.131436 \tabularnewline
35 & 0.028938 & 0.2146 & 0.415432 \tabularnewline
36 & -0.197443 & -1.4643 & 0.074405 \tabularnewline
37 & -0.064937 & -0.4816 & 0.316006 \tabularnewline
38 & -0.115267 & -0.8548 & 0.198173 \tabularnewline
39 & 0.067976 & 0.5041 & 0.308093 \tabularnewline
40 & -0.035335 & -0.2621 & 0.39713 \tabularnewline
41 & -0.029356 & -0.2177 & 0.41423 \tabularnewline
42 & -0.006121 & -0.0454 & 0.481977 \tabularnewline
43 & -0.035009 & -0.2596 & 0.398058 \tabularnewline
44 & -0.014833 & -0.11 & 0.456403 \tabularnewline
45 & -0.045623 & -0.3384 & 0.368194 \tabularnewline
46 & -0.122585 & -0.9091 & 0.183628 \tabularnewline
47 & -0.03245 & -0.2407 & 0.405358 \tabularnewline
48 & -0.068492 & -0.508 & 0.30676 \tabularnewline
\hline
\end{tabular}
%Source: https://freestatistics.org/blog/index.php?pk=120666&T=2

[TABLE]
[ROW][C]Partial Autocorrelation Function[/C][/ROW]
[ROW][C]Time lag k[/C][C]PACF(k)[/C][C]T-STAT[/C][C]P-value[/C][/ROW]
[ROW][C]1[/C][C]-0.281751[/C][C]-2.0895[/C][C]0.02065[/C][/ROW]
[ROW][C]2[/C][C]-0.244612[/C][C]-1.8141[/C][C]0.03756[/C][/ROW]
[ROW][C]3[/C][C]0.048475[/C][C]0.3595[/C][C]0.360298[/C][/ROW]
[ROW][C]4[/C][C]-0.110695[/C][C]-0.8209[/C][C]0.207613[/C][/ROW]
[ROW][C]5[/C][C]-0.06009[/C][C]-0.4456[/C][C]0.328803[/C][/ROW]
[ROW][C]6[/C][C]-0.112163[/C][C]-0.8318[/C][C]0.204554[/C][/ROW]
[ROW][C]7[/C][C]-0.222994[/C][C]-1.6538[/C][C]0.051936[/C][/ROW]
[ROW][C]8[/C][C]-0.194465[/C][C]-1.4422[/C][C]0.077459[/C][/ROW]
[ROW][C]9[/C][C]-0.02469[/C][C]-0.1831[/C][C]0.427693[/C][/ROW]
[ROW][C]10[/C][C]-0.191548[/C][C]-1.4206[/C][C]0.080545[/C][/ROW]
[ROW][C]11[/C][C]-0.441865[/C][C]-3.277[/C][C]0.00091[/C][/ROW]
[ROW][C]12[/C][C]0.48691[/C][C]3.611[/C][C]0.00033[/C][/ROW]
[ROW][C]13[/C][C]0.088025[/C][C]0.6528[/C][C]0.258298[/C][/ROW]
[ROW][C]14[/C][C]0.05185[/C][C]0.3845[/C][C]0.351034[/C][/ROW]
[ROW][C]15[/C][C]-0.058265[/C][C]-0.4321[/C][C]0.333678[/C][/ROW]
[ROW][C]16[/C][C]-0.062574[/C][C]-0.4641[/C][C]0.322218[/C][/ROW]
[ROW][C]17[/C][C]-0.064334[/C][C]-0.4771[/C][C]0.317586[/C][/ROW]
[ROW][C]18[/C][C]-0.092865[/C][C]-0.6887[/C][C]0.246952[/C][/ROW]
[ROW][C]19[/C][C]0.013398[/C][C]0.0994[/C][C]0.460606[/C][/ROW]
[ROW][C]20[/C][C]-0.042511[/C][C]-0.3153[/C][C]0.376876[/C][/ROW]
[ROW][C]21[/C][C]-0.153706[/C][C]-1.1399[/C][C]0.129631[/C][/ROW]
[ROW][C]22[/C][C]-0.112773[/C][C]-0.8363[/C][C]0.20329[/C][/ROW]
[ROW][C]23[/C][C]0.068247[/C][C]0.5061[/C][C]0.307394[/C][/ROW]
[ROW][C]24[/C][C]0.018586[/C][C]0.1378[/C][C]0.445436[/C][/ROW]
[ROW][C]25[/C][C]-0.02514[/C][C]-0.1864[/C][C]0.426393[/C][/ROW]
[ROW][C]26[/C][C]0.08591[/C][C]0.6371[/C][C]0.263343[/C][/ROW]
[ROW][C]27[/C][C]-0.112636[/C][C]-0.8353[/C][C]0.203572[/C][/ROW]
[ROW][C]28[/C][C]0.019802[/C][C]0.1469[/C][C]0.441891[/C][/ROW]
[ROW][C]29[/C][C]0.014388[/C][C]0.1067[/C][C]0.457706[/C][/ROW]
[ROW][C]30[/C][C]0.008233[/C][C]0.0611[/C][C]0.475767[/C][/ROW]
[ROW][C]31[/C][C]0.037889[/C][C]0.281[/C][C]0.389886[/C][/ROW]
[ROW][C]32[/C][C]-0.049035[/C][C]-0.3637[/C][C]0.358755[/C][/ROW]
[ROW][C]33[/C][C]0.087123[/C][C]0.6461[/C][C]0.260445[/C][/ROW]
[ROW][C]34[/C][C]0.152533[/C][C]1.1312[/C][C]0.131436[/C][/ROW]
[ROW][C]35[/C][C]0.028938[/C][C]0.2146[/C][C]0.415432[/C][/ROW]
[ROW][C]36[/C][C]-0.197443[/C][C]-1.4643[/C][C]0.074405[/C][/ROW]
[ROW][C]37[/C][C]-0.064937[/C][C]-0.4816[/C][C]0.316006[/C][/ROW]
[ROW][C]38[/C][C]-0.115267[/C][C]-0.8548[/C][C]0.198173[/C][/ROW]
[ROW][C]39[/C][C]0.067976[/C][C]0.5041[/C][C]0.308093[/C][/ROW]
[ROW][C]40[/C][C]-0.035335[/C][C]-0.2621[/C][C]0.39713[/C][/ROW]
[ROW][C]41[/C][C]-0.029356[/C][C]-0.2177[/C][C]0.41423[/C][/ROW]
[ROW][C]42[/C][C]-0.006121[/C][C]-0.0454[/C][C]0.481977[/C][/ROW]
[ROW][C]43[/C][C]-0.035009[/C][C]-0.2596[/C][C]0.398058[/C][/ROW]
[ROW][C]44[/C][C]-0.014833[/C][C]-0.11[/C][C]0.456403[/C][/ROW]
[ROW][C]45[/C][C]-0.045623[/C][C]-0.3384[/C][C]0.368194[/C][/ROW]
[ROW][C]46[/C][C]-0.122585[/C][C]-0.9091[/C][C]0.183628[/C][/ROW]
[ROW][C]47[/C][C]-0.03245[/C][C]-0.2407[/C][C]0.405358[/C][/ROW]
[ROW][C]48[/C][C]-0.068492[/C][C]-0.508[/C][C]0.30676[/C][/ROW]
[/TABLE]
Source: https://freestatistics.org/blog/index.php?pk=120666&T=2

Globally Unique Identifier (entire table): ba.freestatistics.org/blog/index.php?pk=120666&T=2

As an alternative you can also use a QR Code:  

The GUIDs for individual cells are displayed in the table below:

Partial Autocorrelation Function
Time lag kPACF(k)T-STATP-value
1-0.281751-2.08950.02065
2-0.244612-1.81410.03756
30.0484750.35950.360298
4-0.110695-0.82090.207613
5-0.06009-0.44560.328803
6-0.112163-0.83180.204554
7-0.222994-1.65380.051936
8-0.194465-1.44220.077459
9-0.02469-0.18310.427693
10-0.191548-1.42060.080545
11-0.441865-3.2770.00091
120.486913.6110.00033
130.0880250.65280.258298
140.051850.38450.351034
15-0.058265-0.43210.333678
16-0.062574-0.46410.322218
17-0.064334-0.47710.317586
18-0.092865-0.68870.246952
190.0133980.09940.460606
20-0.042511-0.31530.376876
21-0.153706-1.13990.129631
22-0.112773-0.83630.20329
230.0682470.50610.307394
240.0185860.13780.445436
25-0.02514-0.18640.426393
260.085910.63710.263343
27-0.112636-0.83530.203572
280.0198020.14690.441891
290.0143880.10670.457706
300.0082330.06110.475767
310.0378890.2810.389886
32-0.049035-0.36370.358755
330.0871230.64610.260445
340.1525331.13120.131436
350.0289380.21460.415432
36-0.197443-1.46430.074405
37-0.064937-0.48160.316006
38-0.115267-0.85480.198173
390.0679760.50410.308093
40-0.035335-0.26210.39713
41-0.029356-0.21770.41423
42-0.006121-0.04540.481977
43-0.035009-0.25960.398058
44-0.014833-0.110.456403
45-0.045623-0.33840.368194
46-0.122585-0.90910.183628
47-0.03245-0.24070.405358
48-0.068492-0.5080.30676


Parameters (Session):
par1 = 48 ; par2 = 1 ; par3 = 1 ; par4 = 0 ; par5 = 12 ; par6 = White Noise ; par7 = 0.95 ;
Parameters (R input):
par1 = 48 ; par2 = 1 ; par3 = 1 ; par4 = 0 ; par5 = 12 ; par6 = White Noise ; par7 = 0.95 ; par8 = ;
R code (references can be found in the software module):
if (par1 == 'Default') {
par1 = 10*log10(length(x))
} else {
par1 <- as.numeric(par1)
}
par2 <- as.numeric(par2)
par3 <- as.numeric(par3)
par4 <- as.numeric(par4)
par5 <- as.numeric(par5)
if (par6 == 'White Noise') par6 <- 'white' else par6 <- 'ma'
par7 <- as.numeric(par7)
if (par8 != '') par8 <- as.numeric(par8)
ox <- x
if (par8 == '') {
if (par2 == 0) {
x <- log(x)
} else {
x <- (x ^ par2 - 1) / par2
}
} else {
x <- log(x,base=par8)
}
if (par3 > 0) x <- diff(x,lag=1,difference=par3)
if (par4 > 0) x <- diff(x,lag=par5,difference=par4)
bitmap(file='picts.png')
op <- par(mfrow=c(2,1))
plot(ox,type='l',main='Original Time Series',xlab='time',ylab='value')
if (par8=='') {
mytitle <- paste('Working Time Series (lambda=',par2,', d=',par3,', D=',par4,')',sep='')
mysub <- paste('(lambda=',par2,', d=',par3,', D=',par4,', CI=', par7, ', CI type=',par6,')',sep='')
} else {
mytitle <- paste('Working Time Series (base=',par8,', d=',par3,', D=',par4,')',sep='')
mysub <- paste('(base=',par8,', d=',par3,', D=',par4,', CI=', par7, ', CI type=',par6,')',sep='')
}
plot(x,type='l', main=mytitle,xlab='time',ylab='value')
par(op)
dev.off()
bitmap(file='pic1.png')
racf <- acf(x, par1, main='Autocorrelation', xlab='time lag', ylab='ACF', ci.type=par6, ci=par7, sub=mysub)
dev.off()
bitmap(file='pic2.png')
rpacf <- pacf(x,par1,main='Partial Autocorrelation',xlab='lags',ylab='PACF',sub=mysub)
dev.off()
(myacf <- c(racf$acf))
(mypacf <- c(rpacf$acf))
lengthx <- length(x)
sqrtn <- sqrt(lengthx)
load(file='createtable')
a<-table.start()
a<-table.row.start(a)
a<-table.element(a,'Autocorrelation Function',4,TRUE)
a<-table.row.end(a)
a<-table.row.start(a)
a<-table.element(a,'Time lag k',header=TRUE)
a<-table.element(a,hyperlink('basics.htm','ACF(k)','click here for more information about the Autocorrelation Function'),header=TRUE)
a<-table.element(a,'T-STAT',header=TRUE)
a<-table.element(a,'P-value',header=TRUE)
a<-table.row.end(a)
for (i in 2:(par1+1)) {
a<-table.row.start(a)
a<-table.element(a,i-1,header=TRUE)
a<-table.element(a,round(myacf[i],6))
mytstat <- myacf[i]*sqrtn
a<-table.element(a,round(mytstat,4))
a<-table.element(a,round(1-pt(abs(mytstat),lengthx),6))
a<-table.row.end(a)
}
a<-table.end(a)
table.save(a,file='mytable.tab')
a<-table.start()
a<-table.row.start(a)
a<-table.element(a,'Partial Autocorrelation Function',4,TRUE)
a<-table.row.end(a)
a<-table.row.start(a)
a<-table.element(a,'Time lag k',header=TRUE)
a<-table.element(a,hyperlink('basics.htm','PACF(k)','click here for more information about the Partial Autocorrelation Function'),header=TRUE)
a<-table.element(a,'T-STAT',header=TRUE)
a<-table.element(a,'P-value',header=TRUE)
a<-table.row.end(a)
for (i in 1:par1) {
a<-table.row.start(a)
a<-table.element(a,i,header=TRUE)
a<-table.element(a,round(mypacf[i],6))
mytstat <- mypacf[i]*sqrtn
a<-table.element(a,round(mytstat,4))
a<-table.element(a,round(1-pt(abs(mytstat),lengthx),6))
a<-table.row.end(a)
}
a<-table.end(a)
table.save(a,file='mytable1.tab')