Free Statistics

of Irreproducible Research!

Author's title

Author*Unverified author*
R Software Modulerwasp_autocorrelation.wasp
Title produced by software(Partial) Autocorrelation Function
Date of computationWed, 27 Apr 2011 12:54:27 +0000
Cite this page as followsStatistical Computations at FreeStatistics.org, Office for Research Development and Education, URL https://freestatistics.org/blog/index.php?v=date/2011/Apr/27/t130390873043iid51flvuhr1m.htm/, Retrieved Thu, 09 May 2024 06:06:33 +0000
Statistical Computations at FreeStatistics.org, Office for Research Development and Education, URL https://freestatistics.org/blog/index.php?pk=120662, Retrieved Thu, 09 May 2024 06:06:33 +0000
QR Codes:

Original text written by user:
IsPrivate?No (this computation is public)
User-defined keywordsKDGP2W12
Estimated Impact170
Family? (F = Feedback message, R = changed R code, M = changed R Module, P = changed Parameters, D = changed Data)
-       [(Partial) Autocorrelation Function] [Autocorrelatiefun...] [2011-04-27 12:54:27] [8b50cbc1ebd04aa753862408f533fbe8] [Current]
Feedback Forum

Post a new message
Dataseries X:
1.2638
1.2640
1.2261
1.1989
1.2000
1.2146
1.2266
1.2191
1.2224
1.2507
1.2997
1.3406
1.3123
1.3013
1.3185
1.2943
1.2697
1.2155
1.2041
1.2295
1.2234
1.2022
1.1789
1.1861
1.2126
1.1940
1.2028
1.2273
1.2767
1.2661
1.2681
1.2810
1.2722
1.2617
1.2888
1.3205
1.2993
1.3080
1.3246
1.3513
1.3518
1.3421
1.3726
1.3626
1.3910
1.4233
1.4683
1.4559
1.4728
1.4759
1.5520
1.5754
1.5554
1.5562
1.5759
1.4955
1.4342
1.3266
1.2744
1.3511
1.3244
1.2797
1.3050
1.3199
1.3646
1.4014
1.4092
1.4266
1.4575
1.4821
1.4908
1.4579
1.4266
1.3680
1.3570
1.3417
1.2563
1.2223
1.2811
1.2903
1.3103
1.3901
1.3654
1.3221


Summary of computational transaction
Raw Inputview raw input (R code)
Raw Outputview raw output of R engine
Computing time3 seconds
R Server'Gwilym Jenkins' @ www.wessa.org

\begin{tabular}{lllllllll}
\hline
Summary of computational transaction \tabularnewline
Raw Input & view raw input (R code)  \tabularnewline
Raw Output & view raw output of R engine  \tabularnewline
Computing time & 3 seconds \tabularnewline
R Server & 'Gwilym Jenkins' @ www.wessa.org \tabularnewline
\hline
\end{tabular}
%Source: https://freestatistics.org/blog/index.php?pk=120662&T=0

[TABLE]
[ROW][C]Summary of computational transaction[/C][/ROW]
[ROW][C]Raw Input[/C][C]view raw input (R code) [/C][/ROW]
[ROW][C]Raw Output[/C][C]view raw output of R engine [/C][/ROW]
[ROW][C]Computing time[/C][C]3 seconds[/C][/ROW]
[ROW][C]R Server[/C][C]'Gwilym Jenkins' @ www.wessa.org[/C][/ROW]
[/TABLE]
Source: https://freestatistics.org/blog/index.php?pk=120662&T=0

Globally Unique Identifier (entire table): ba.freestatistics.org/blog/index.php?pk=120662&T=0

As an alternative you can also use a QR Code:  

The GUIDs for individual cells are displayed in the table below:

Summary of computational transaction
Raw Inputview raw input (R code)
Raw Outputview raw output of R engine
Computing time3 seconds
R Server'Gwilym Jenkins' @ www.wessa.org


Autocorrelation Function
Time lag kACF(k)T-STATP-value
10.2940322.67880.004454
2-0.039784-0.36240.35897
30.1210111.10250.136724
40.051160.46610.321187
5-0.023507-0.21420.415475
6-0.11348-1.03390.152104
7-0.341757-3.11360.001268
8-0.219098-1.99610.024602
9-0.100184-0.91270.182018
10-0.112326-1.02330.15456
11-0.125533-1.14370.128026
12-0.14794-1.34780.090696
13-0.045492-0.41450.339806
140.0773720.70490.241427
150.1670761.52210.065888
160.1900851.73180.043516
170.0391480.35670.361129
180.0884570.80590.211306
190.213651.94640.027492
200.0873770.7960.214138
21-0.026425-0.24070.405175
22-3.5e-05-3e-040.499872
23-0.173742-1.58290.058628
24-0.069514-0.63330.264139
25-0.041318-0.37640.35378
26-0.106041-0.96610.168406
27-0.039706-0.36170.359233
28-0.011945-0.10880.456804
29-0.127028-1.15730.125239
30-0.024579-0.22390.411683
310.0312470.28470.388303
32-0.059155-0.53890.295691
33-0.095896-0.87370.192413
34-0.025631-0.23350.40797
350.1217121.10880.13535
360.0976480.88960.188121
37-0.043301-0.39450.347114
38-0.056969-0.5190.302567
390.1040680.94810.172915
400.2168651.97570.025754
410.0665540.60630.272974
42-0.056433-0.51410.304264
430.0019130.01740.493068
44-0.005029-0.04580.481784
45-0.050293-0.45820.324007
46-0.098844-0.90050.185228
47-0.174113-1.58620.058243
48-0.145116-1.32210.094889

\begin{tabular}{lllllllll}
\hline
Autocorrelation Function \tabularnewline
Time lag k & ACF(k) & T-STAT & P-value \tabularnewline
1 & 0.294032 & 2.6788 & 0.004454 \tabularnewline
2 & -0.039784 & -0.3624 & 0.35897 \tabularnewline
3 & 0.121011 & 1.1025 & 0.136724 \tabularnewline
4 & 0.05116 & 0.4661 & 0.321187 \tabularnewline
5 & -0.023507 & -0.2142 & 0.415475 \tabularnewline
6 & -0.11348 & -1.0339 & 0.152104 \tabularnewline
7 & -0.341757 & -3.1136 & 0.001268 \tabularnewline
8 & -0.219098 & -1.9961 & 0.024602 \tabularnewline
9 & -0.100184 & -0.9127 & 0.182018 \tabularnewline
10 & -0.112326 & -1.0233 & 0.15456 \tabularnewline
11 & -0.125533 & -1.1437 & 0.128026 \tabularnewline
12 & -0.14794 & -1.3478 & 0.090696 \tabularnewline
13 & -0.045492 & -0.4145 & 0.339806 \tabularnewline
14 & 0.077372 & 0.7049 & 0.241427 \tabularnewline
15 & 0.167076 & 1.5221 & 0.065888 \tabularnewline
16 & 0.190085 & 1.7318 & 0.043516 \tabularnewline
17 & 0.039148 & 0.3567 & 0.361129 \tabularnewline
18 & 0.088457 & 0.8059 & 0.211306 \tabularnewline
19 & 0.21365 & 1.9464 & 0.027492 \tabularnewline
20 & 0.087377 & 0.796 & 0.214138 \tabularnewline
21 & -0.026425 & -0.2407 & 0.405175 \tabularnewline
22 & -3.5e-05 & -3e-04 & 0.499872 \tabularnewline
23 & -0.173742 & -1.5829 & 0.058628 \tabularnewline
24 & -0.069514 & -0.6333 & 0.264139 \tabularnewline
25 & -0.041318 & -0.3764 & 0.35378 \tabularnewline
26 & -0.106041 & -0.9661 & 0.168406 \tabularnewline
27 & -0.039706 & -0.3617 & 0.359233 \tabularnewline
28 & -0.011945 & -0.1088 & 0.456804 \tabularnewline
29 & -0.127028 & -1.1573 & 0.125239 \tabularnewline
30 & -0.024579 & -0.2239 & 0.411683 \tabularnewline
31 & 0.031247 & 0.2847 & 0.388303 \tabularnewline
32 & -0.059155 & -0.5389 & 0.295691 \tabularnewline
33 & -0.095896 & -0.8737 & 0.192413 \tabularnewline
34 & -0.025631 & -0.2335 & 0.40797 \tabularnewline
35 & 0.121712 & 1.1088 & 0.13535 \tabularnewline
36 & 0.097648 & 0.8896 & 0.188121 \tabularnewline
37 & -0.043301 & -0.3945 & 0.347114 \tabularnewline
38 & -0.056969 & -0.519 & 0.302567 \tabularnewline
39 & 0.104068 & 0.9481 & 0.172915 \tabularnewline
40 & 0.216865 & 1.9757 & 0.025754 \tabularnewline
41 & 0.066554 & 0.6063 & 0.272974 \tabularnewline
42 & -0.056433 & -0.5141 & 0.304264 \tabularnewline
43 & 0.001913 & 0.0174 & 0.493068 \tabularnewline
44 & -0.005029 & -0.0458 & 0.481784 \tabularnewline
45 & -0.050293 & -0.4582 & 0.324007 \tabularnewline
46 & -0.098844 & -0.9005 & 0.185228 \tabularnewline
47 & -0.174113 & -1.5862 & 0.058243 \tabularnewline
48 & -0.145116 & -1.3221 & 0.094889 \tabularnewline
\hline
\end{tabular}
%Source: https://freestatistics.org/blog/index.php?pk=120662&T=1

[TABLE]
[ROW][C]Autocorrelation Function[/C][/ROW]
[ROW][C]Time lag k[/C][C]ACF(k)[/C][C]T-STAT[/C][C]P-value[/C][/ROW]
[ROW][C]1[/C][C]0.294032[/C][C]2.6788[/C][C]0.004454[/C][/ROW]
[ROW][C]2[/C][C]-0.039784[/C][C]-0.3624[/C][C]0.35897[/C][/ROW]
[ROW][C]3[/C][C]0.121011[/C][C]1.1025[/C][C]0.136724[/C][/ROW]
[ROW][C]4[/C][C]0.05116[/C][C]0.4661[/C][C]0.321187[/C][/ROW]
[ROW][C]5[/C][C]-0.023507[/C][C]-0.2142[/C][C]0.415475[/C][/ROW]
[ROW][C]6[/C][C]-0.11348[/C][C]-1.0339[/C][C]0.152104[/C][/ROW]
[ROW][C]7[/C][C]-0.341757[/C][C]-3.1136[/C][C]0.001268[/C][/ROW]
[ROW][C]8[/C][C]-0.219098[/C][C]-1.9961[/C][C]0.024602[/C][/ROW]
[ROW][C]9[/C][C]-0.100184[/C][C]-0.9127[/C][C]0.182018[/C][/ROW]
[ROW][C]10[/C][C]-0.112326[/C][C]-1.0233[/C][C]0.15456[/C][/ROW]
[ROW][C]11[/C][C]-0.125533[/C][C]-1.1437[/C][C]0.128026[/C][/ROW]
[ROW][C]12[/C][C]-0.14794[/C][C]-1.3478[/C][C]0.090696[/C][/ROW]
[ROW][C]13[/C][C]-0.045492[/C][C]-0.4145[/C][C]0.339806[/C][/ROW]
[ROW][C]14[/C][C]0.077372[/C][C]0.7049[/C][C]0.241427[/C][/ROW]
[ROW][C]15[/C][C]0.167076[/C][C]1.5221[/C][C]0.065888[/C][/ROW]
[ROW][C]16[/C][C]0.190085[/C][C]1.7318[/C][C]0.043516[/C][/ROW]
[ROW][C]17[/C][C]0.039148[/C][C]0.3567[/C][C]0.361129[/C][/ROW]
[ROW][C]18[/C][C]0.088457[/C][C]0.8059[/C][C]0.211306[/C][/ROW]
[ROW][C]19[/C][C]0.21365[/C][C]1.9464[/C][C]0.027492[/C][/ROW]
[ROW][C]20[/C][C]0.087377[/C][C]0.796[/C][C]0.214138[/C][/ROW]
[ROW][C]21[/C][C]-0.026425[/C][C]-0.2407[/C][C]0.405175[/C][/ROW]
[ROW][C]22[/C][C]-3.5e-05[/C][C]-3e-04[/C][C]0.499872[/C][/ROW]
[ROW][C]23[/C][C]-0.173742[/C][C]-1.5829[/C][C]0.058628[/C][/ROW]
[ROW][C]24[/C][C]-0.069514[/C][C]-0.6333[/C][C]0.264139[/C][/ROW]
[ROW][C]25[/C][C]-0.041318[/C][C]-0.3764[/C][C]0.35378[/C][/ROW]
[ROW][C]26[/C][C]-0.106041[/C][C]-0.9661[/C][C]0.168406[/C][/ROW]
[ROW][C]27[/C][C]-0.039706[/C][C]-0.3617[/C][C]0.359233[/C][/ROW]
[ROW][C]28[/C][C]-0.011945[/C][C]-0.1088[/C][C]0.456804[/C][/ROW]
[ROW][C]29[/C][C]-0.127028[/C][C]-1.1573[/C][C]0.125239[/C][/ROW]
[ROW][C]30[/C][C]-0.024579[/C][C]-0.2239[/C][C]0.411683[/C][/ROW]
[ROW][C]31[/C][C]0.031247[/C][C]0.2847[/C][C]0.388303[/C][/ROW]
[ROW][C]32[/C][C]-0.059155[/C][C]-0.5389[/C][C]0.295691[/C][/ROW]
[ROW][C]33[/C][C]-0.095896[/C][C]-0.8737[/C][C]0.192413[/C][/ROW]
[ROW][C]34[/C][C]-0.025631[/C][C]-0.2335[/C][C]0.40797[/C][/ROW]
[ROW][C]35[/C][C]0.121712[/C][C]1.1088[/C][C]0.13535[/C][/ROW]
[ROW][C]36[/C][C]0.097648[/C][C]0.8896[/C][C]0.188121[/C][/ROW]
[ROW][C]37[/C][C]-0.043301[/C][C]-0.3945[/C][C]0.347114[/C][/ROW]
[ROW][C]38[/C][C]-0.056969[/C][C]-0.519[/C][C]0.302567[/C][/ROW]
[ROW][C]39[/C][C]0.104068[/C][C]0.9481[/C][C]0.172915[/C][/ROW]
[ROW][C]40[/C][C]0.216865[/C][C]1.9757[/C][C]0.025754[/C][/ROW]
[ROW][C]41[/C][C]0.066554[/C][C]0.6063[/C][C]0.272974[/C][/ROW]
[ROW][C]42[/C][C]-0.056433[/C][C]-0.5141[/C][C]0.304264[/C][/ROW]
[ROW][C]43[/C][C]0.001913[/C][C]0.0174[/C][C]0.493068[/C][/ROW]
[ROW][C]44[/C][C]-0.005029[/C][C]-0.0458[/C][C]0.481784[/C][/ROW]
[ROW][C]45[/C][C]-0.050293[/C][C]-0.4582[/C][C]0.324007[/C][/ROW]
[ROW][C]46[/C][C]-0.098844[/C][C]-0.9005[/C][C]0.185228[/C][/ROW]
[ROW][C]47[/C][C]-0.174113[/C][C]-1.5862[/C][C]0.058243[/C][/ROW]
[ROW][C]48[/C][C]-0.145116[/C][C]-1.3221[/C][C]0.094889[/C][/ROW]
[/TABLE]
Source: https://freestatistics.org/blog/index.php?pk=120662&T=1

Globally Unique Identifier (entire table): ba.freestatistics.org/blog/index.php?pk=120662&T=1

As an alternative you can also use a QR Code:  

The GUIDs for individual cells are displayed in the table below:

Autocorrelation Function
Time lag kACF(k)T-STATP-value
10.2940322.67880.004454
2-0.039784-0.36240.35897
30.1210111.10250.136724
40.051160.46610.321187
5-0.023507-0.21420.415475
6-0.11348-1.03390.152104
7-0.341757-3.11360.001268
8-0.219098-1.99610.024602
9-0.100184-0.91270.182018
10-0.112326-1.02330.15456
11-0.125533-1.14370.128026
12-0.14794-1.34780.090696
13-0.045492-0.41450.339806
140.0773720.70490.241427
150.1670761.52210.065888
160.1900851.73180.043516
170.0391480.35670.361129
180.0884570.80590.211306
190.213651.94640.027492
200.0873770.7960.214138
21-0.026425-0.24070.405175
22-3.5e-05-3e-040.499872
23-0.173742-1.58290.058628
24-0.069514-0.63330.264139
25-0.041318-0.37640.35378
26-0.106041-0.96610.168406
27-0.039706-0.36170.359233
28-0.011945-0.10880.456804
29-0.127028-1.15730.125239
30-0.024579-0.22390.411683
310.0312470.28470.388303
32-0.059155-0.53890.295691
33-0.095896-0.87370.192413
34-0.025631-0.23350.40797
350.1217121.10880.13535
360.0976480.88960.188121
37-0.043301-0.39450.347114
38-0.056969-0.5190.302567
390.1040680.94810.172915
400.2168651.97570.025754
410.0665540.60630.272974
42-0.056433-0.51410.304264
430.0019130.01740.493068
44-0.005029-0.04580.481784
45-0.050293-0.45820.324007
46-0.098844-0.90050.185228
47-0.174113-1.58620.058243
48-0.145116-1.32210.094889


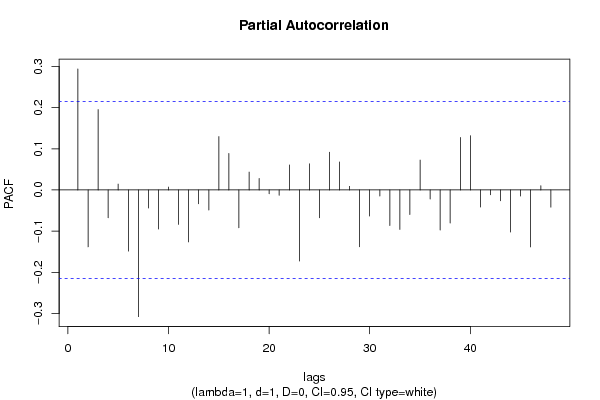
Partial Autocorrelation Function
Time lag kPACF(k)T-STATP-value
10.2940322.67880.004454
2-0.138185-1.25890.105793
30.1952411.77870.039472
4-0.067414-0.61420.27039
50.014180.12920.448761
6-0.148494-1.35280.089889
7-0.307757-2.80380.003143
8-0.043977-0.40060.344854
9-0.094957-0.86510.194738
100.0068870.06270.475059
11-0.083692-0.76250.223971
12-0.126108-1.14890.126948
13-0.033477-0.3050.380569
14-0.048836-0.44490.328769
150.1296831.18150.120395
160.0885980.80720.21094
17-0.09186-0.83690.20253
180.043380.39520.34685
190.0279580.25470.39979
20-0.009257-0.08430.466498
21-0.013045-0.11880.452843
220.0606990.5530.290876
23-0.172664-1.5730.059756
240.0634560.57810.282377
25-0.067703-0.61680.269527
260.0916310.83480.203114
270.0681470.62090.268199
280.0088160.08030.468089
29-0.137951-1.25680.106176
30-0.063188-0.57570.283198
31-0.01481-0.13490.446497
32-0.086402-0.78720.216715
33-0.095755-0.87240.192761
34-0.059467-0.54180.294714
350.0725510.6610.255229
36-0.021843-0.1990.421377
37-0.09723-0.88580.18914
38-0.080438-0.73280.232866
390.1273981.16070.124556
400.1317041.19990.116799
41-0.041382-0.3770.353564
42-0.011814-0.10760.457276
43-0.026155-0.23830.406123
44-0.102048-0.92970.177612
45-0.014816-0.1350.446478
46-0.138281-1.25980.105636
470.0102260.09320.462999
48-0.041757-0.38040.352303

\begin{tabular}{lllllllll}
\hline
Partial Autocorrelation Function \tabularnewline
Time lag k & PACF(k) & T-STAT & P-value \tabularnewline
1 & 0.294032 & 2.6788 & 0.004454 \tabularnewline
2 & -0.138185 & -1.2589 & 0.105793 \tabularnewline
3 & 0.195241 & 1.7787 & 0.039472 \tabularnewline
4 & -0.067414 & -0.6142 & 0.27039 \tabularnewline
5 & 0.01418 & 0.1292 & 0.448761 \tabularnewline
6 & -0.148494 & -1.3528 & 0.089889 \tabularnewline
7 & -0.307757 & -2.8038 & 0.003143 \tabularnewline
8 & -0.043977 & -0.4006 & 0.344854 \tabularnewline
9 & -0.094957 & -0.8651 & 0.194738 \tabularnewline
10 & 0.006887 & 0.0627 & 0.475059 \tabularnewline
11 & -0.083692 & -0.7625 & 0.223971 \tabularnewline
12 & -0.126108 & -1.1489 & 0.126948 \tabularnewline
13 & -0.033477 & -0.305 & 0.380569 \tabularnewline
14 & -0.048836 & -0.4449 & 0.328769 \tabularnewline
15 & 0.129683 & 1.1815 & 0.120395 \tabularnewline
16 & 0.088598 & 0.8072 & 0.21094 \tabularnewline
17 & -0.09186 & -0.8369 & 0.20253 \tabularnewline
18 & 0.04338 & 0.3952 & 0.34685 \tabularnewline
19 & 0.027958 & 0.2547 & 0.39979 \tabularnewline
20 & -0.009257 & -0.0843 & 0.466498 \tabularnewline
21 & -0.013045 & -0.1188 & 0.452843 \tabularnewline
22 & 0.060699 & 0.553 & 0.290876 \tabularnewline
23 & -0.172664 & -1.573 & 0.059756 \tabularnewline
24 & 0.063456 & 0.5781 & 0.282377 \tabularnewline
25 & -0.067703 & -0.6168 & 0.269527 \tabularnewline
26 & 0.091631 & 0.8348 & 0.203114 \tabularnewline
27 & 0.068147 & 0.6209 & 0.268199 \tabularnewline
28 & 0.008816 & 0.0803 & 0.468089 \tabularnewline
29 & -0.137951 & -1.2568 & 0.106176 \tabularnewline
30 & -0.063188 & -0.5757 & 0.283198 \tabularnewline
31 & -0.01481 & -0.1349 & 0.446497 \tabularnewline
32 & -0.086402 & -0.7872 & 0.216715 \tabularnewline
33 & -0.095755 & -0.8724 & 0.192761 \tabularnewline
34 & -0.059467 & -0.5418 & 0.294714 \tabularnewline
35 & 0.072551 & 0.661 & 0.255229 \tabularnewline
36 & -0.021843 & -0.199 & 0.421377 \tabularnewline
37 & -0.09723 & -0.8858 & 0.18914 \tabularnewline
38 & -0.080438 & -0.7328 & 0.232866 \tabularnewline
39 & 0.127398 & 1.1607 & 0.124556 \tabularnewline
40 & 0.131704 & 1.1999 & 0.116799 \tabularnewline
41 & -0.041382 & -0.377 & 0.353564 \tabularnewline
42 & -0.011814 & -0.1076 & 0.457276 \tabularnewline
43 & -0.026155 & -0.2383 & 0.406123 \tabularnewline
44 & -0.102048 & -0.9297 & 0.177612 \tabularnewline
45 & -0.014816 & -0.135 & 0.446478 \tabularnewline
46 & -0.138281 & -1.2598 & 0.105636 \tabularnewline
47 & 0.010226 & 0.0932 & 0.462999 \tabularnewline
48 & -0.041757 & -0.3804 & 0.352303 \tabularnewline
\hline
\end{tabular}
%Source: https://freestatistics.org/blog/index.php?pk=120662&T=2

[TABLE]
[ROW][C]Partial Autocorrelation Function[/C][/ROW]
[ROW][C]Time lag k[/C][C]PACF(k)[/C][C]T-STAT[/C][C]P-value[/C][/ROW]
[ROW][C]1[/C][C]0.294032[/C][C]2.6788[/C][C]0.004454[/C][/ROW]
[ROW][C]2[/C][C]-0.138185[/C][C]-1.2589[/C][C]0.105793[/C][/ROW]
[ROW][C]3[/C][C]0.195241[/C][C]1.7787[/C][C]0.039472[/C][/ROW]
[ROW][C]4[/C][C]-0.067414[/C][C]-0.6142[/C][C]0.27039[/C][/ROW]
[ROW][C]5[/C][C]0.01418[/C][C]0.1292[/C][C]0.448761[/C][/ROW]
[ROW][C]6[/C][C]-0.148494[/C][C]-1.3528[/C][C]0.089889[/C][/ROW]
[ROW][C]7[/C][C]-0.307757[/C][C]-2.8038[/C][C]0.003143[/C][/ROW]
[ROW][C]8[/C][C]-0.043977[/C][C]-0.4006[/C][C]0.344854[/C][/ROW]
[ROW][C]9[/C][C]-0.094957[/C][C]-0.8651[/C][C]0.194738[/C][/ROW]
[ROW][C]10[/C][C]0.006887[/C][C]0.0627[/C][C]0.475059[/C][/ROW]
[ROW][C]11[/C][C]-0.083692[/C][C]-0.7625[/C][C]0.223971[/C][/ROW]
[ROW][C]12[/C][C]-0.126108[/C][C]-1.1489[/C][C]0.126948[/C][/ROW]
[ROW][C]13[/C][C]-0.033477[/C][C]-0.305[/C][C]0.380569[/C][/ROW]
[ROW][C]14[/C][C]-0.048836[/C][C]-0.4449[/C][C]0.328769[/C][/ROW]
[ROW][C]15[/C][C]0.129683[/C][C]1.1815[/C][C]0.120395[/C][/ROW]
[ROW][C]16[/C][C]0.088598[/C][C]0.8072[/C][C]0.21094[/C][/ROW]
[ROW][C]17[/C][C]-0.09186[/C][C]-0.8369[/C][C]0.20253[/C][/ROW]
[ROW][C]18[/C][C]0.04338[/C][C]0.3952[/C][C]0.34685[/C][/ROW]
[ROW][C]19[/C][C]0.027958[/C][C]0.2547[/C][C]0.39979[/C][/ROW]
[ROW][C]20[/C][C]-0.009257[/C][C]-0.0843[/C][C]0.466498[/C][/ROW]
[ROW][C]21[/C][C]-0.013045[/C][C]-0.1188[/C][C]0.452843[/C][/ROW]
[ROW][C]22[/C][C]0.060699[/C][C]0.553[/C][C]0.290876[/C][/ROW]
[ROW][C]23[/C][C]-0.172664[/C][C]-1.573[/C][C]0.059756[/C][/ROW]
[ROW][C]24[/C][C]0.063456[/C][C]0.5781[/C][C]0.282377[/C][/ROW]
[ROW][C]25[/C][C]-0.067703[/C][C]-0.6168[/C][C]0.269527[/C][/ROW]
[ROW][C]26[/C][C]0.091631[/C][C]0.8348[/C][C]0.203114[/C][/ROW]
[ROW][C]27[/C][C]0.068147[/C][C]0.6209[/C][C]0.268199[/C][/ROW]
[ROW][C]28[/C][C]0.008816[/C][C]0.0803[/C][C]0.468089[/C][/ROW]
[ROW][C]29[/C][C]-0.137951[/C][C]-1.2568[/C][C]0.106176[/C][/ROW]
[ROW][C]30[/C][C]-0.063188[/C][C]-0.5757[/C][C]0.283198[/C][/ROW]
[ROW][C]31[/C][C]-0.01481[/C][C]-0.1349[/C][C]0.446497[/C][/ROW]
[ROW][C]32[/C][C]-0.086402[/C][C]-0.7872[/C][C]0.216715[/C][/ROW]
[ROW][C]33[/C][C]-0.095755[/C][C]-0.8724[/C][C]0.192761[/C][/ROW]
[ROW][C]34[/C][C]-0.059467[/C][C]-0.5418[/C][C]0.294714[/C][/ROW]
[ROW][C]35[/C][C]0.072551[/C][C]0.661[/C][C]0.255229[/C][/ROW]
[ROW][C]36[/C][C]-0.021843[/C][C]-0.199[/C][C]0.421377[/C][/ROW]
[ROW][C]37[/C][C]-0.09723[/C][C]-0.8858[/C][C]0.18914[/C][/ROW]
[ROW][C]38[/C][C]-0.080438[/C][C]-0.7328[/C][C]0.232866[/C][/ROW]
[ROW][C]39[/C][C]0.127398[/C][C]1.1607[/C][C]0.124556[/C][/ROW]
[ROW][C]40[/C][C]0.131704[/C][C]1.1999[/C][C]0.116799[/C][/ROW]
[ROW][C]41[/C][C]-0.041382[/C][C]-0.377[/C][C]0.353564[/C][/ROW]
[ROW][C]42[/C][C]-0.011814[/C][C]-0.1076[/C][C]0.457276[/C][/ROW]
[ROW][C]43[/C][C]-0.026155[/C][C]-0.2383[/C][C]0.406123[/C][/ROW]
[ROW][C]44[/C][C]-0.102048[/C][C]-0.9297[/C][C]0.177612[/C][/ROW]
[ROW][C]45[/C][C]-0.014816[/C][C]-0.135[/C][C]0.446478[/C][/ROW]
[ROW][C]46[/C][C]-0.138281[/C][C]-1.2598[/C][C]0.105636[/C][/ROW]
[ROW][C]47[/C][C]0.010226[/C][C]0.0932[/C][C]0.462999[/C][/ROW]
[ROW][C]48[/C][C]-0.041757[/C][C]-0.3804[/C][C]0.352303[/C][/ROW]
[/TABLE]
Source: https://freestatistics.org/blog/index.php?pk=120662&T=2

Globally Unique Identifier (entire table): ba.freestatistics.org/blog/index.php?pk=120662&T=2

As an alternative you can also use a QR Code:  

The GUIDs for individual cells are displayed in the table below:

Partial Autocorrelation Function
Time lag kPACF(k)T-STATP-value
10.2940322.67880.004454
2-0.138185-1.25890.105793
30.1952411.77870.039472
4-0.067414-0.61420.27039
50.014180.12920.448761
6-0.148494-1.35280.089889
7-0.307757-2.80380.003143
8-0.043977-0.40060.344854
9-0.094957-0.86510.194738
100.0068870.06270.475059
11-0.083692-0.76250.223971
12-0.126108-1.14890.126948
13-0.033477-0.3050.380569
14-0.048836-0.44490.328769
150.1296831.18150.120395
160.0885980.80720.21094
17-0.09186-0.83690.20253
180.043380.39520.34685
190.0279580.25470.39979
20-0.009257-0.08430.466498
21-0.013045-0.11880.452843
220.0606990.5530.290876
23-0.172664-1.5730.059756
240.0634560.57810.282377
25-0.067703-0.61680.269527
260.0916310.83480.203114
270.0681470.62090.268199
280.0088160.08030.468089
29-0.137951-1.25680.106176
30-0.063188-0.57570.283198
31-0.01481-0.13490.446497
32-0.086402-0.78720.216715
33-0.095755-0.87240.192761
34-0.059467-0.54180.294714
350.0725510.6610.255229
36-0.021843-0.1990.421377
37-0.09723-0.88580.18914
38-0.080438-0.73280.232866
390.1273981.16070.124556
400.1317041.19990.116799
41-0.041382-0.3770.353564
42-0.011814-0.10760.457276
43-0.026155-0.23830.406123
44-0.102048-0.92970.177612
45-0.014816-0.1350.446478
46-0.138281-1.25980.105636
470.0102260.09320.462999
48-0.041757-0.38040.352303


Parameters (Session):
par1 = 48 ; par2 = 1 ; par3 = 1 ; par4 = 0 ; par5 = 12 ; par6 = White Noise ; par7 = 0.95 ;
Parameters (R input):
par1 = 48 ; par2 = 1 ; par3 = 1 ; par4 = 0 ; par5 = 12 ; par6 = White Noise ; par7 = 0.95 ; par8 = ;
R code (references can be found in the software module):
if (par1 == 'Default') {
par1 = 10*log10(length(x))
} else {
par1 <- as.numeric(par1)
}
par2 <- as.numeric(par2)
par3 <- as.numeric(par3)
par4 <- as.numeric(par4)
par5 <- as.numeric(par5)
if (par6 == 'White Noise') par6 <- 'white' else par6 <- 'ma'
par7 <- as.numeric(par7)
if (par8 != '') par8 <- as.numeric(par8)
ox <- x
if (par8 == '') {
if (par2 == 0) {
x <- log(x)
} else {
x <- (x ^ par2 - 1) / par2
}
} else {
x <- log(x,base=par8)
}
if (par3 > 0) x <- diff(x,lag=1,difference=par3)
if (par4 > 0) x <- diff(x,lag=par5,difference=par4)
bitmap(file='picts.png')
op <- par(mfrow=c(2,1))
plot(ox,type='l',main='Original Time Series',xlab='time',ylab='value')
if (par8=='') {
mytitle <- paste('Working Time Series (lambda=',par2,', d=',par3,', D=',par4,')',sep='')
mysub <- paste('(lambda=',par2,', d=',par3,', D=',par4,', CI=', par7, ', CI type=',par6,')',sep='')
} else {
mytitle <- paste('Working Time Series (base=',par8,', d=',par3,', D=',par4,')',sep='')
mysub <- paste('(base=',par8,', d=',par3,', D=',par4,', CI=', par7, ', CI type=',par6,')',sep='')
}
plot(x,type='l', main=mytitle,xlab='time',ylab='value')
par(op)
dev.off()
bitmap(file='pic1.png')
racf <- acf(x, par1, main='Autocorrelation', xlab='time lag', ylab='ACF', ci.type=par6, ci=par7, sub=mysub)
dev.off()
bitmap(file='pic2.png')
rpacf <- pacf(x,par1,main='Partial Autocorrelation',xlab='lags',ylab='PACF',sub=mysub)
dev.off()
(myacf <- c(racf$acf))
(mypacf <- c(rpacf$acf))
lengthx <- length(x)
sqrtn <- sqrt(lengthx)
load(file='createtable')
a<-table.start()
a<-table.row.start(a)
a<-table.element(a,'Autocorrelation Function',4,TRUE)
a<-table.row.end(a)
a<-table.row.start(a)
a<-table.element(a,'Time lag k',header=TRUE)
a<-table.element(a,hyperlink('basics.htm','ACF(k)','click here for more information about the Autocorrelation Function'),header=TRUE)
a<-table.element(a,'T-STAT',header=TRUE)
a<-table.element(a,'P-value',header=TRUE)
a<-table.row.end(a)
for (i in 2:(par1+1)) {
a<-table.row.start(a)
a<-table.element(a,i-1,header=TRUE)
a<-table.element(a,round(myacf[i],6))
mytstat <- myacf[i]*sqrtn
a<-table.element(a,round(mytstat,4))
a<-table.element(a,round(1-pt(abs(mytstat),lengthx),6))
a<-table.row.end(a)
}
a<-table.end(a)
table.save(a,file='mytable.tab')
a<-table.start()
a<-table.row.start(a)
a<-table.element(a,'Partial Autocorrelation Function',4,TRUE)
a<-table.row.end(a)
a<-table.row.start(a)
a<-table.element(a,'Time lag k',header=TRUE)
a<-table.element(a,hyperlink('basics.htm','PACF(k)','click here for more information about the Partial Autocorrelation Function'),header=TRUE)
a<-table.element(a,'T-STAT',header=TRUE)
a<-table.element(a,'P-value',header=TRUE)
a<-table.row.end(a)
for (i in 1:par1) {
a<-table.row.start(a)
a<-table.element(a,i,header=TRUE)
a<-table.element(a,round(mypacf[i],6))
mytstat <- mypacf[i]*sqrtn
a<-table.element(a,round(mytstat,4))
a<-table.element(a,round(1-pt(abs(mytstat),lengthx),6))
a<-table.row.end(a)
}
a<-table.end(a)
table.save(a,file='mytable1.tab')