Free Statistics

of Irreproducible Research!

Author's title

Author*Unverified author*
R Software Modulerwasp_autocorrelation.wasp
Title produced by software(Partial) Autocorrelation Function
Date of computationWed, 27 Apr 2011 12:48:38 +0000
Cite this page as followsStatistical Computations at FreeStatistics.org, Office for Research Development and Education, URL https://freestatistics.org/blog/index.php?v=date/2011/Apr/27/t1303908415s762phv8xzzbmws.htm/, Retrieved Thu, 09 May 2024 07:01:14 +0000
Statistical Computations at FreeStatistics.org, Office for Research Development and Education, URL https://freestatistics.org/blog/index.php?pk=120661, Retrieved Thu, 09 May 2024 07:01:14 +0000
QR Codes:

Original text written by user:
IsPrivate?No (this computation is public)
User-defined keywordsKDGP2W12
Estimated Impact162
Family? (F = Feedback message, R = changed R code, M = changed R Module, P = changed Parameters, D = changed Data)
-       [(Partial) Autocorrelation Function] [Autocorrelatiefun...] [2011-04-27 12:48:38] [8b50cbc1ebd04aa753862408f533fbe8] [Current]
Feedback Forum

Post a new message
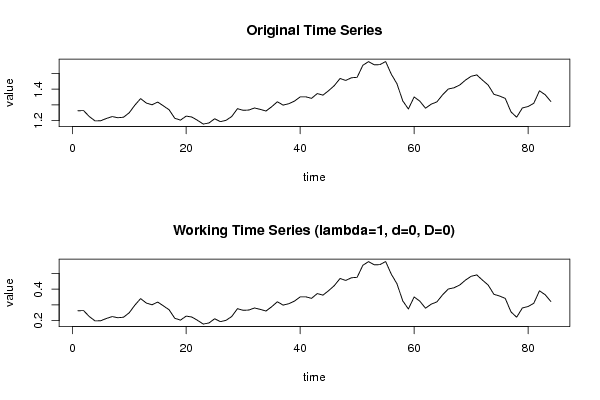
Dataseries X:
1,2638
1,2640
1,2261
1,1989
1,2000
1,2146
1,2266
1,2191
1,2224
1,2507
1,2997
1,3406
1,3123
1,3013
1,3185
1,2943
1,2697
1,2155
1,2041
1,2295
1,2234
1,2022
1,1789
1,1861
1,2126
1,1940
1,2028
1,2273
1,2767
1,2661
1,2681
1,2810
1,2722
1,2617
1,2888
1,3205
1,2993
1,3080
1,3246
1,3513
1,3518
1,3421
1,3726
1,3626
1,3910
1,4233
1,4683
1,4559
1,4728
1,4759
1,5520
1,5754
1,5554
1,5562
1,5759
1,4955
1,4342
1,3266
1,2744
1,3511
1,3244
1,2797
1,3050
1,3199
1,3646
1,4014
1,4092
1,4266
1,4575
1,4821
1,4908
1,4579
1,4266
1,3680
1,3570
1,3417
1,2563
1,2223
1,2811
1,2903
1,3103
1,3901
1,3654
1,3221


Summary of computational transaction
Raw Inputview raw input (R code)
Raw Outputview raw output of R engine
Computing time2 seconds
R Server'Gwilym Jenkins' @ www.wessa.org

\begin{tabular}{lllllllll}
\hline
Summary of computational transaction \tabularnewline
Raw Input & view raw input (R code)  \tabularnewline
Raw Output & view raw output of R engine  \tabularnewline
Computing time & 2 seconds \tabularnewline
R Server & 'Gwilym Jenkins' @ www.wessa.org \tabularnewline
\hline
\end{tabular}
%Source: https://freestatistics.org/blog/index.php?pk=120661&T=0

[TABLE]
[ROW][C]Summary of computational transaction[/C][/ROW]
[ROW][C]Raw Input[/C][C]view raw input (R code) [/C][/ROW]
[ROW][C]Raw Output[/C][C]view raw output of R engine [/C][/ROW]
[ROW][C]Computing time[/C][C]2 seconds[/C][/ROW]
[ROW][C]R Server[/C][C]'Gwilym Jenkins' @ www.wessa.org[/C][/ROW]
[/TABLE]
Source: https://freestatistics.org/blog/index.php?pk=120661&T=0

Globally Unique Identifier (entire table): ba.freestatistics.org/blog/index.php?pk=120661&T=0

As an alternative you can also use a QR Code:  

The GUIDs for individual cells are displayed in the table below:

Summary of computational transaction
Raw Inputview raw input (R code)
Raw Outputview raw output of R engine
Computing time2 seconds
R Server'Gwilym Jenkins' @ www.wessa.org


Autocorrelation Function
Time lag kACF(k)T-STATP-value
10.9384188.60070
20.8424377.72110
30.7483356.85860
40.6370895.8390
50.519644.76264e-06
60.4059443.72050.000179
70.3060522.8050.003125
80.2461832.25630.013324
90.2130621.95270.02709
100.1939691.77780.039532
110.1919111.75890.041119
120.2082251.90840.029877
130.2399822.19950.015296
140.2763892.53320.006581
150.3047632.79320.003231
160.3112132.85230.002731
170.2929432.68490.00437
180.2655932.43420.008522
190.2266922.07770.020397
200.1640761.50380.068194
210.0902050.82670.205363
220.0176080.16140.436092
23-0.057079-0.52310.301127
24-0.110449-1.01230.157154
25-0.153486-1.40670.081599
26-0.19381-1.77630.039653
27-0.22061-2.02190.023183
28-0.240107-2.20060.015254
29-0.254084-2.32870.011138
30-0.253454-2.32290.0113
31-0.250192-2.2930.012172
32-0.249881-2.29020.012258
33-0.243354-2.23040.014194
34-0.226768-2.07840.020364
35-0.205916-1.88730.03129
36-0.197179-1.80720.037157
37-0.201882-1.85030.033895
38-0.200854-1.84090.034587
39-0.192324-1.76270.040796
40-0.194372-1.78140.039227
41-0.222254-2.0370.0224
42-0.258696-2.3710.010015
43-0.286408-2.6250.005147
44-0.315043-2.88740.002469
45-0.340911-3.12450.001222
46-0.358551-3.28620.000742
47-0.361125-3.30980.000689
48-0.34407-3.15340.001119

\begin{tabular}{lllllllll}
\hline
Autocorrelation Function \tabularnewline
Time lag k & ACF(k) & T-STAT & P-value \tabularnewline
1 & 0.938418 & 8.6007 & 0 \tabularnewline
2 & 0.842437 & 7.7211 & 0 \tabularnewline
3 & 0.748335 & 6.8586 & 0 \tabularnewline
4 & 0.637089 & 5.839 & 0 \tabularnewline
5 & 0.51964 & 4.7626 & 4e-06 \tabularnewline
6 & 0.405944 & 3.7205 & 0.000179 \tabularnewline
7 & 0.306052 & 2.805 & 0.003125 \tabularnewline
8 & 0.246183 & 2.2563 & 0.013324 \tabularnewline
9 & 0.213062 & 1.9527 & 0.02709 \tabularnewline
10 & 0.193969 & 1.7778 & 0.039532 \tabularnewline
11 & 0.191911 & 1.7589 & 0.041119 \tabularnewline
12 & 0.208225 & 1.9084 & 0.029877 \tabularnewline
13 & 0.239982 & 2.1995 & 0.015296 \tabularnewline
14 & 0.276389 & 2.5332 & 0.006581 \tabularnewline
15 & 0.304763 & 2.7932 & 0.003231 \tabularnewline
16 & 0.311213 & 2.8523 & 0.002731 \tabularnewline
17 & 0.292943 & 2.6849 & 0.00437 \tabularnewline
18 & 0.265593 & 2.4342 & 0.008522 \tabularnewline
19 & 0.226692 & 2.0777 & 0.020397 \tabularnewline
20 & 0.164076 & 1.5038 & 0.068194 \tabularnewline
21 & 0.090205 & 0.8267 & 0.205363 \tabularnewline
22 & 0.017608 & 0.1614 & 0.436092 \tabularnewline
23 & -0.057079 & -0.5231 & 0.301127 \tabularnewline
24 & -0.110449 & -1.0123 & 0.157154 \tabularnewline
25 & -0.153486 & -1.4067 & 0.081599 \tabularnewline
26 & -0.19381 & -1.7763 & 0.039653 \tabularnewline
27 & -0.22061 & -2.0219 & 0.023183 \tabularnewline
28 & -0.240107 & -2.2006 & 0.015254 \tabularnewline
29 & -0.254084 & -2.3287 & 0.011138 \tabularnewline
30 & -0.253454 & -2.3229 & 0.0113 \tabularnewline
31 & -0.250192 & -2.293 & 0.012172 \tabularnewline
32 & -0.249881 & -2.2902 & 0.012258 \tabularnewline
33 & -0.243354 & -2.2304 & 0.014194 \tabularnewline
34 & -0.226768 & -2.0784 & 0.020364 \tabularnewline
35 & -0.205916 & -1.8873 & 0.03129 \tabularnewline
36 & -0.197179 & -1.8072 & 0.037157 \tabularnewline
37 & -0.201882 & -1.8503 & 0.033895 \tabularnewline
38 & -0.200854 & -1.8409 & 0.034587 \tabularnewline
39 & -0.192324 & -1.7627 & 0.040796 \tabularnewline
40 & -0.194372 & -1.7814 & 0.039227 \tabularnewline
41 & -0.222254 & -2.037 & 0.0224 \tabularnewline
42 & -0.258696 & -2.371 & 0.010015 \tabularnewline
43 & -0.286408 & -2.625 & 0.005147 \tabularnewline
44 & -0.315043 & -2.8874 & 0.002469 \tabularnewline
45 & -0.340911 & -3.1245 & 0.001222 \tabularnewline
46 & -0.358551 & -3.2862 & 0.000742 \tabularnewline
47 & -0.361125 & -3.3098 & 0.000689 \tabularnewline
48 & -0.34407 & -3.1534 & 0.001119 \tabularnewline
\hline
\end{tabular}
%Source: https://freestatistics.org/blog/index.php?pk=120661&T=1

[TABLE]
[ROW][C]Autocorrelation Function[/C][/ROW]
[ROW][C]Time lag k[/C][C]ACF(k)[/C][C]T-STAT[/C][C]P-value[/C][/ROW]
[ROW][C]1[/C][C]0.938418[/C][C]8.6007[/C][C]0[/C][/ROW]
[ROW][C]2[/C][C]0.842437[/C][C]7.7211[/C][C]0[/C][/ROW]
[ROW][C]3[/C][C]0.748335[/C][C]6.8586[/C][C]0[/C][/ROW]
[ROW][C]4[/C][C]0.637089[/C][C]5.839[/C][C]0[/C][/ROW]
[ROW][C]5[/C][C]0.51964[/C][C]4.7626[/C][C]4e-06[/C][/ROW]
[ROW][C]6[/C][C]0.405944[/C][C]3.7205[/C][C]0.000179[/C][/ROW]
[ROW][C]7[/C][C]0.306052[/C][C]2.805[/C][C]0.003125[/C][/ROW]
[ROW][C]8[/C][C]0.246183[/C][C]2.2563[/C][C]0.013324[/C][/ROW]
[ROW][C]9[/C][C]0.213062[/C][C]1.9527[/C][C]0.02709[/C][/ROW]
[ROW][C]10[/C][C]0.193969[/C][C]1.7778[/C][C]0.039532[/C][/ROW]
[ROW][C]11[/C][C]0.191911[/C][C]1.7589[/C][C]0.041119[/C][/ROW]
[ROW][C]12[/C][C]0.208225[/C][C]1.9084[/C][C]0.029877[/C][/ROW]
[ROW][C]13[/C][C]0.239982[/C][C]2.1995[/C][C]0.015296[/C][/ROW]
[ROW][C]14[/C][C]0.276389[/C][C]2.5332[/C][C]0.006581[/C][/ROW]
[ROW][C]15[/C][C]0.304763[/C][C]2.7932[/C][C]0.003231[/C][/ROW]
[ROW][C]16[/C][C]0.311213[/C][C]2.8523[/C][C]0.002731[/C][/ROW]
[ROW][C]17[/C][C]0.292943[/C][C]2.6849[/C][C]0.00437[/C][/ROW]
[ROW][C]18[/C][C]0.265593[/C][C]2.4342[/C][C]0.008522[/C][/ROW]
[ROW][C]19[/C][C]0.226692[/C][C]2.0777[/C][C]0.020397[/C][/ROW]
[ROW][C]20[/C][C]0.164076[/C][C]1.5038[/C][C]0.068194[/C][/ROW]
[ROW][C]21[/C][C]0.090205[/C][C]0.8267[/C][C]0.205363[/C][/ROW]
[ROW][C]22[/C][C]0.017608[/C][C]0.1614[/C][C]0.436092[/C][/ROW]
[ROW][C]23[/C][C]-0.057079[/C][C]-0.5231[/C][C]0.301127[/C][/ROW]
[ROW][C]24[/C][C]-0.110449[/C][C]-1.0123[/C][C]0.157154[/C][/ROW]
[ROW][C]25[/C][C]-0.153486[/C][C]-1.4067[/C][C]0.081599[/C][/ROW]
[ROW][C]26[/C][C]-0.19381[/C][C]-1.7763[/C][C]0.039653[/C][/ROW]
[ROW][C]27[/C][C]-0.22061[/C][C]-2.0219[/C][C]0.023183[/C][/ROW]
[ROW][C]28[/C][C]-0.240107[/C][C]-2.2006[/C][C]0.015254[/C][/ROW]
[ROW][C]29[/C][C]-0.254084[/C][C]-2.3287[/C][C]0.011138[/C][/ROW]
[ROW][C]30[/C][C]-0.253454[/C][C]-2.3229[/C][C]0.0113[/C][/ROW]
[ROW][C]31[/C][C]-0.250192[/C][C]-2.293[/C][C]0.012172[/C][/ROW]
[ROW][C]32[/C][C]-0.249881[/C][C]-2.2902[/C][C]0.012258[/C][/ROW]
[ROW][C]33[/C][C]-0.243354[/C][C]-2.2304[/C][C]0.014194[/C][/ROW]
[ROW][C]34[/C][C]-0.226768[/C][C]-2.0784[/C][C]0.020364[/C][/ROW]
[ROW][C]35[/C][C]-0.205916[/C][C]-1.8873[/C][C]0.03129[/C][/ROW]
[ROW][C]36[/C][C]-0.197179[/C][C]-1.8072[/C][C]0.037157[/C][/ROW]
[ROW][C]37[/C][C]-0.201882[/C][C]-1.8503[/C][C]0.033895[/C][/ROW]
[ROW][C]38[/C][C]-0.200854[/C][C]-1.8409[/C][C]0.034587[/C][/ROW]
[ROW][C]39[/C][C]-0.192324[/C][C]-1.7627[/C][C]0.040796[/C][/ROW]
[ROW][C]40[/C][C]-0.194372[/C][C]-1.7814[/C][C]0.039227[/C][/ROW]
[ROW][C]41[/C][C]-0.222254[/C][C]-2.037[/C][C]0.0224[/C][/ROW]
[ROW][C]42[/C][C]-0.258696[/C][C]-2.371[/C][C]0.010015[/C][/ROW]
[ROW][C]43[/C][C]-0.286408[/C][C]-2.625[/C][C]0.005147[/C][/ROW]
[ROW][C]44[/C][C]-0.315043[/C][C]-2.8874[/C][C]0.002469[/C][/ROW]
[ROW][C]45[/C][C]-0.340911[/C][C]-3.1245[/C][C]0.001222[/C][/ROW]
[ROW][C]46[/C][C]-0.358551[/C][C]-3.2862[/C][C]0.000742[/C][/ROW]
[ROW][C]47[/C][C]-0.361125[/C][C]-3.3098[/C][C]0.000689[/C][/ROW]
[ROW][C]48[/C][C]-0.34407[/C][C]-3.1534[/C][C]0.001119[/C][/ROW]
[/TABLE]
Source: https://freestatistics.org/blog/index.php?pk=120661&T=1

Globally Unique Identifier (entire table): ba.freestatistics.org/blog/index.php?pk=120661&T=1

As an alternative you can also use a QR Code:  

The GUIDs for individual cells are displayed in the table below:

Autocorrelation Function
Time lag kACF(k)T-STATP-value
10.9384188.60070
20.8424377.72110
30.7483356.85860
40.6370895.8390
50.519644.76264e-06
60.4059443.72050.000179
70.3060522.8050.003125
80.2461832.25630.013324
90.2130621.95270.02709
100.1939691.77780.039532
110.1919111.75890.041119
120.2082251.90840.029877
130.2399822.19950.015296
140.2763892.53320.006581
150.3047632.79320.003231
160.3112132.85230.002731
170.2929432.68490.00437
180.2655932.43420.008522
190.2266922.07770.020397
200.1640761.50380.068194
210.0902050.82670.205363
220.0176080.16140.436092
23-0.057079-0.52310.301127
24-0.110449-1.01230.157154
25-0.153486-1.40670.081599
26-0.19381-1.77630.039653
27-0.22061-2.02190.023183
28-0.240107-2.20060.015254
29-0.254084-2.32870.011138
30-0.253454-2.32290.0113
31-0.250192-2.2930.012172
32-0.249881-2.29020.012258
33-0.243354-2.23040.014194
34-0.226768-2.07840.020364
35-0.205916-1.88730.03129
36-0.197179-1.80720.037157
37-0.201882-1.85030.033895
38-0.200854-1.84090.034587
39-0.192324-1.76270.040796
40-0.194372-1.78140.039227
41-0.222254-2.0370.0224
42-0.258696-2.3710.010015
43-0.286408-2.6250.005147
44-0.315043-2.88740.002469
45-0.340911-3.12450.001222
46-0.358551-3.28620.000742
47-0.361125-3.30980.000689
48-0.34407-3.15340.001119


Partial Autocorrelation Function
Time lag kPACF(k)T-STATP-value
10.9384188.60070
2-0.319933-2.93220.002168
30.0474230.43460.332471
4-0.249578-2.28740.012343
5-0.019556-0.17920.429093
6-0.072031-0.66020.255474
70.0662170.60690.27278
80.247862.27170.012831
90.0266990.24470.403644
100.0498860.45720.324348
11-0.007279-0.06670.473485
120.0602780.55250.29105
130.0694250.63630.263159
140.0206760.18950.425081
150.0058380.05350.478729
16-0.153691-1.40860.081322
17-0.127415-1.16780.1231
180.0236770.2170.414365
19-0.023634-0.21660.414518
20-0.076283-0.69910.243195
21-0.024645-0.22590.410923
22-0.030315-0.27780.390908
23-0.124738-1.14320.128093
240.1352881.23990.109226
25-0.093359-0.85560.197314
26-0.01683-0.15430.43889
27-0.098993-0.90730.183424
28-0.129833-1.18990.118711
29-0.023533-0.21570.41488
300.0280240.25680.398965
310.0374880.34360.366008
32-0.031732-0.29080.385948
330.0195310.1790.429183
340.0632310.57950.281894
350.0502470.46050.323165
36-0.06655-0.60990.271774
37-0.061093-0.55990.288509
380.0837290.76740.222502
390.0220680.20230.420102
40-0.098558-0.90330.184475
41-0.19174-1.75730.041253
420.0003520.00320.498718
430.006590.06040.475989
44-0.056339-0.51640.303481
450.1216721.11510.133986
46-0.028986-0.26570.395574
470.1356881.24360.108553
48-0.040241-0.36880.356598

\begin{tabular}{lllllllll}
\hline
Partial Autocorrelation Function \tabularnewline
Time lag k & PACF(k) & T-STAT & P-value \tabularnewline
1 & 0.938418 & 8.6007 & 0 \tabularnewline
2 & -0.319933 & -2.9322 & 0.002168 \tabularnewline
3 & 0.047423 & 0.4346 & 0.332471 \tabularnewline
4 & -0.249578 & -2.2874 & 0.012343 \tabularnewline
5 & -0.019556 & -0.1792 & 0.429093 \tabularnewline
6 & -0.072031 & -0.6602 & 0.255474 \tabularnewline
7 & 0.066217 & 0.6069 & 0.27278 \tabularnewline
8 & 0.24786 & 2.2717 & 0.012831 \tabularnewline
9 & 0.026699 & 0.2447 & 0.403644 \tabularnewline
10 & 0.049886 & 0.4572 & 0.324348 \tabularnewline
11 & -0.007279 & -0.0667 & 0.473485 \tabularnewline
12 & 0.060278 & 0.5525 & 0.29105 \tabularnewline
13 & 0.069425 & 0.6363 & 0.263159 \tabularnewline
14 & 0.020676 & 0.1895 & 0.425081 \tabularnewline
15 & 0.005838 & 0.0535 & 0.478729 \tabularnewline
16 & -0.153691 & -1.4086 & 0.081322 \tabularnewline
17 & -0.127415 & -1.1678 & 0.1231 \tabularnewline
18 & 0.023677 & 0.217 & 0.414365 \tabularnewline
19 & -0.023634 & -0.2166 & 0.414518 \tabularnewline
20 & -0.076283 & -0.6991 & 0.243195 \tabularnewline
21 & -0.024645 & -0.2259 & 0.410923 \tabularnewline
22 & -0.030315 & -0.2778 & 0.390908 \tabularnewline
23 & -0.124738 & -1.1432 & 0.128093 \tabularnewline
24 & 0.135288 & 1.2399 & 0.109226 \tabularnewline
25 & -0.093359 & -0.8556 & 0.197314 \tabularnewline
26 & -0.01683 & -0.1543 & 0.43889 \tabularnewline
27 & -0.098993 & -0.9073 & 0.183424 \tabularnewline
28 & -0.129833 & -1.1899 & 0.118711 \tabularnewline
29 & -0.023533 & -0.2157 & 0.41488 \tabularnewline
30 & 0.028024 & 0.2568 & 0.398965 \tabularnewline
31 & 0.037488 & 0.3436 & 0.366008 \tabularnewline
32 & -0.031732 & -0.2908 & 0.385948 \tabularnewline
33 & 0.019531 & 0.179 & 0.429183 \tabularnewline
34 & 0.063231 & 0.5795 & 0.281894 \tabularnewline
35 & 0.050247 & 0.4605 & 0.323165 \tabularnewline
36 & -0.06655 & -0.6099 & 0.271774 \tabularnewline
37 & -0.061093 & -0.5599 & 0.288509 \tabularnewline
38 & 0.083729 & 0.7674 & 0.222502 \tabularnewline
39 & 0.022068 & 0.2023 & 0.420102 \tabularnewline
40 & -0.098558 & -0.9033 & 0.184475 \tabularnewline
41 & -0.19174 & -1.7573 & 0.041253 \tabularnewline
42 & 0.000352 & 0.0032 & 0.498718 \tabularnewline
43 & 0.00659 & 0.0604 & 0.475989 \tabularnewline
44 & -0.056339 & -0.5164 & 0.303481 \tabularnewline
45 & 0.121672 & 1.1151 & 0.133986 \tabularnewline
46 & -0.028986 & -0.2657 & 0.395574 \tabularnewline
47 & 0.135688 & 1.2436 & 0.108553 \tabularnewline
48 & -0.040241 & -0.3688 & 0.356598 \tabularnewline
\hline
\end{tabular}
%Source: https://freestatistics.org/blog/index.php?pk=120661&T=2

[TABLE]
[ROW][C]Partial Autocorrelation Function[/C][/ROW]
[ROW][C]Time lag k[/C][C]PACF(k)[/C][C]T-STAT[/C][C]P-value[/C][/ROW]
[ROW][C]1[/C][C]0.938418[/C][C]8.6007[/C][C]0[/C][/ROW]
[ROW][C]2[/C][C]-0.319933[/C][C]-2.9322[/C][C]0.002168[/C][/ROW]
[ROW][C]3[/C][C]0.047423[/C][C]0.4346[/C][C]0.332471[/C][/ROW]
[ROW][C]4[/C][C]-0.249578[/C][C]-2.2874[/C][C]0.012343[/C][/ROW]
[ROW][C]5[/C][C]-0.019556[/C][C]-0.1792[/C][C]0.429093[/C][/ROW]
[ROW][C]6[/C][C]-0.072031[/C][C]-0.6602[/C][C]0.255474[/C][/ROW]
[ROW][C]7[/C][C]0.066217[/C][C]0.6069[/C][C]0.27278[/C][/ROW]
[ROW][C]8[/C][C]0.24786[/C][C]2.2717[/C][C]0.012831[/C][/ROW]
[ROW][C]9[/C][C]0.026699[/C][C]0.2447[/C][C]0.403644[/C][/ROW]
[ROW][C]10[/C][C]0.049886[/C][C]0.4572[/C][C]0.324348[/C][/ROW]
[ROW][C]11[/C][C]-0.007279[/C][C]-0.0667[/C][C]0.473485[/C][/ROW]
[ROW][C]12[/C][C]0.060278[/C][C]0.5525[/C][C]0.29105[/C][/ROW]
[ROW][C]13[/C][C]0.069425[/C][C]0.6363[/C][C]0.263159[/C][/ROW]
[ROW][C]14[/C][C]0.020676[/C][C]0.1895[/C][C]0.425081[/C][/ROW]
[ROW][C]15[/C][C]0.005838[/C][C]0.0535[/C][C]0.478729[/C][/ROW]
[ROW][C]16[/C][C]-0.153691[/C][C]-1.4086[/C][C]0.081322[/C][/ROW]
[ROW][C]17[/C][C]-0.127415[/C][C]-1.1678[/C][C]0.1231[/C][/ROW]
[ROW][C]18[/C][C]0.023677[/C][C]0.217[/C][C]0.414365[/C][/ROW]
[ROW][C]19[/C][C]-0.023634[/C][C]-0.2166[/C][C]0.414518[/C][/ROW]
[ROW][C]20[/C][C]-0.076283[/C][C]-0.6991[/C][C]0.243195[/C][/ROW]
[ROW][C]21[/C][C]-0.024645[/C][C]-0.2259[/C][C]0.410923[/C][/ROW]
[ROW][C]22[/C][C]-0.030315[/C][C]-0.2778[/C][C]0.390908[/C][/ROW]
[ROW][C]23[/C][C]-0.124738[/C][C]-1.1432[/C][C]0.128093[/C][/ROW]
[ROW][C]24[/C][C]0.135288[/C][C]1.2399[/C][C]0.109226[/C][/ROW]
[ROW][C]25[/C][C]-0.093359[/C][C]-0.8556[/C][C]0.197314[/C][/ROW]
[ROW][C]26[/C][C]-0.01683[/C][C]-0.1543[/C][C]0.43889[/C][/ROW]
[ROW][C]27[/C][C]-0.098993[/C][C]-0.9073[/C][C]0.183424[/C][/ROW]
[ROW][C]28[/C][C]-0.129833[/C][C]-1.1899[/C][C]0.118711[/C][/ROW]
[ROW][C]29[/C][C]-0.023533[/C][C]-0.2157[/C][C]0.41488[/C][/ROW]
[ROW][C]30[/C][C]0.028024[/C][C]0.2568[/C][C]0.398965[/C][/ROW]
[ROW][C]31[/C][C]0.037488[/C][C]0.3436[/C][C]0.366008[/C][/ROW]
[ROW][C]32[/C][C]-0.031732[/C][C]-0.2908[/C][C]0.385948[/C][/ROW]
[ROW][C]33[/C][C]0.019531[/C][C]0.179[/C][C]0.429183[/C][/ROW]
[ROW][C]34[/C][C]0.063231[/C][C]0.5795[/C][C]0.281894[/C][/ROW]
[ROW][C]35[/C][C]0.050247[/C][C]0.4605[/C][C]0.323165[/C][/ROW]
[ROW][C]36[/C][C]-0.06655[/C][C]-0.6099[/C][C]0.271774[/C][/ROW]
[ROW][C]37[/C][C]-0.061093[/C][C]-0.5599[/C][C]0.288509[/C][/ROW]
[ROW][C]38[/C][C]0.083729[/C][C]0.7674[/C][C]0.222502[/C][/ROW]
[ROW][C]39[/C][C]0.022068[/C][C]0.2023[/C][C]0.420102[/C][/ROW]
[ROW][C]40[/C][C]-0.098558[/C][C]-0.9033[/C][C]0.184475[/C][/ROW]
[ROW][C]41[/C][C]-0.19174[/C][C]-1.7573[/C][C]0.041253[/C][/ROW]
[ROW][C]42[/C][C]0.000352[/C][C]0.0032[/C][C]0.498718[/C][/ROW]
[ROW][C]43[/C][C]0.00659[/C][C]0.0604[/C][C]0.475989[/C][/ROW]
[ROW][C]44[/C][C]-0.056339[/C][C]-0.5164[/C][C]0.303481[/C][/ROW]
[ROW][C]45[/C][C]0.121672[/C][C]1.1151[/C][C]0.133986[/C][/ROW]
[ROW][C]46[/C][C]-0.028986[/C][C]-0.2657[/C][C]0.395574[/C][/ROW]
[ROW][C]47[/C][C]0.135688[/C][C]1.2436[/C][C]0.108553[/C][/ROW]
[ROW][C]48[/C][C]-0.040241[/C][C]-0.3688[/C][C]0.356598[/C][/ROW]
[/TABLE]
Source: https://freestatistics.org/blog/index.php?pk=120661&T=2

Globally Unique Identifier (entire table): ba.freestatistics.org/blog/index.php?pk=120661&T=2

As an alternative you can also use a QR Code:  

The GUIDs for individual cells are displayed in the table below:

Partial Autocorrelation Function
Time lag kPACF(k)T-STATP-value
10.9384188.60070
2-0.319933-2.93220.002168
30.0474230.43460.332471
4-0.249578-2.28740.012343
5-0.019556-0.17920.429093
6-0.072031-0.66020.255474
70.0662170.60690.27278
80.247862.27170.012831
90.0266990.24470.403644
100.0498860.45720.324348
11-0.007279-0.06670.473485
120.0602780.55250.29105
130.0694250.63630.263159
140.0206760.18950.425081
150.0058380.05350.478729
16-0.153691-1.40860.081322
17-0.127415-1.16780.1231
180.0236770.2170.414365
19-0.023634-0.21660.414518
20-0.076283-0.69910.243195
21-0.024645-0.22590.410923
22-0.030315-0.27780.390908
23-0.124738-1.14320.128093
240.1352881.23990.109226
25-0.093359-0.85560.197314
26-0.01683-0.15430.43889
27-0.098993-0.90730.183424
28-0.129833-1.18990.118711
29-0.023533-0.21570.41488
300.0280240.25680.398965
310.0374880.34360.366008
32-0.031732-0.29080.385948
330.0195310.1790.429183
340.0632310.57950.281894
350.0502470.46050.323165
36-0.06655-0.60990.271774
37-0.061093-0.55990.288509
380.0837290.76740.222502
390.0220680.20230.420102
40-0.098558-0.90330.184475
41-0.19174-1.75730.041253
420.0003520.00320.498718
430.006590.06040.475989
44-0.056339-0.51640.303481
450.1216721.11510.133986
46-0.028986-0.26570.395574
470.1356881.24360.108553
48-0.040241-0.36880.356598


Parameters (Session):
par1 = 48 ; par2 = 1 ; par3 = 0 ; par4 = 0 ; par5 = 12 ; par6 = White Noise ; par7 = 0.95 ;
Parameters (R input):
par1 = 48 ; par2 = 1 ; par3 = 0 ; par4 = 0 ; par5 = 12 ; par6 = White Noise ; par7 = 0.95 ; par8 = ;
R code (references can be found in the software module):
if (par1 == 'Default') {
par1 = 10*log10(length(x))
} else {
par1 <- as.numeric(par1)
}
par2 <- as.numeric(par2)
par3 <- as.numeric(par3)
par4 <- as.numeric(par4)
par5 <- as.numeric(par5)
if (par6 == 'White Noise') par6 <- 'white' else par6 <- 'ma'
par7 <- as.numeric(par7)
if (par8 != '') par8 <- as.numeric(par8)
ox <- x
if (par8 == '') {
if (par2 == 0) {
x <- log(x)
} else {
x <- (x ^ par2 - 1) / par2
}
} else {
x <- log(x,base=par8)
}
if (par3 > 0) x <- diff(x,lag=1,difference=par3)
if (par4 > 0) x <- diff(x,lag=par5,difference=par4)
bitmap(file='picts.png')
op <- par(mfrow=c(2,1))
plot(ox,type='l',main='Original Time Series',xlab='time',ylab='value')
if (par8=='') {
mytitle <- paste('Working Time Series (lambda=',par2,', d=',par3,', D=',par4,')',sep='')
mysub <- paste('(lambda=',par2,', d=',par3,', D=',par4,', CI=', par7, ', CI type=',par6,')',sep='')
} else {
mytitle <- paste('Working Time Series (base=',par8,', d=',par3,', D=',par4,')',sep='')
mysub <- paste('(base=',par8,', d=',par3,', D=',par4,', CI=', par7, ', CI type=',par6,')',sep='')
}
plot(x,type='l', main=mytitle,xlab='time',ylab='value')
par(op)
dev.off()
bitmap(file='pic1.png')
racf <- acf(x, par1, main='Autocorrelation', xlab='time lag', ylab='ACF', ci.type=par6, ci=par7, sub=mysub)
dev.off()
bitmap(file='pic2.png')
rpacf <- pacf(x,par1,main='Partial Autocorrelation',xlab='lags',ylab='PACF',sub=mysub)
dev.off()
(myacf <- c(racf$acf))
(mypacf <- c(rpacf$acf))
lengthx <- length(x)
sqrtn <- sqrt(lengthx)
load(file='createtable')
a<-table.start()
a<-table.row.start(a)
a<-table.element(a,'Autocorrelation Function',4,TRUE)
a<-table.row.end(a)
a<-table.row.start(a)
a<-table.element(a,'Time lag k',header=TRUE)
a<-table.element(a,hyperlink('basics.htm','ACF(k)','click here for more information about the Autocorrelation Function'),header=TRUE)
a<-table.element(a,'T-STAT',header=TRUE)
a<-table.element(a,'P-value',header=TRUE)
a<-table.row.end(a)
for (i in 2:(par1+1)) {
a<-table.row.start(a)
a<-table.element(a,i-1,header=TRUE)
a<-table.element(a,round(myacf[i],6))
mytstat <- myacf[i]*sqrtn
a<-table.element(a,round(mytstat,4))
a<-table.element(a,round(1-pt(abs(mytstat),lengthx),6))
a<-table.row.end(a)
}
a<-table.end(a)
table.save(a,file='mytable.tab')
a<-table.start()
a<-table.row.start(a)
a<-table.element(a,'Partial Autocorrelation Function',4,TRUE)
a<-table.row.end(a)
a<-table.row.start(a)
a<-table.element(a,'Time lag k',header=TRUE)
a<-table.element(a,hyperlink('basics.htm','PACF(k)','click here for more information about the Partial Autocorrelation Function'),header=TRUE)
a<-table.element(a,'T-STAT',header=TRUE)
a<-table.element(a,'P-value',header=TRUE)
a<-table.row.end(a)
for (i in 1:par1) {
a<-table.row.start(a)
a<-table.element(a,i,header=TRUE)
a<-table.element(a,round(mypacf[i],6))
mytstat <- mypacf[i]*sqrtn
a<-table.element(a,round(mytstat,4))
a<-table.element(a,round(1-pt(abs(mytstat),lengthx),6))
a<-table.row.end(a)
}
a<-table.end(a)
table.save(a,file='mytable1.tab')