Free Statistics

of Irreproducible Research!

Author's title

Author*Unverified author*
R Software Modulerwasp_autocorrelation.wasp
Title produced by software(Partial) Autocorrelation Function
Date of computationTue, 26 Apr 2011 14:19:31 +0000
Cite this page as followsStatistical Computations at FreeStatistics.org, Office for Research Development and Education, URL https://freestatistics.org/blog/index.php?v=date/2011/Apr/26/t1303827352sa5j2ci0ucs2mej.htm/, Retrieved Thu, 09 May 2024 19:43:57 +0000
Statistical Computations at FreeStatistics.org, Office for Research Development and Education, URL https://freestatistics.org/blog/index.php?pk=120636, Retrieved Thu, 09 May 2024 19:43:57 +0000
QR Codes:

Original text written by user:
IsPrivate?No (this computation is public)
User-defined keywordsKDGP2W12
Estimated Impact218
Family? (F = Feedback message, R = changed R code, M = changed R Module, P = changed Parameters, D = changed Data)
-       [(Partial) Autocorrelation Function] [] [2011-04-26 14:19:31] [39dfb880f237820275004e8a4e7fff84] [Current]
Feedback Forum

Post a new message
Dataseries X:
1,3014
1,3201
1,2938
1,2694
1,2165
1,2037
1,2292
1,2256
1,2015
1,1786
1,1856
1,2103
1,1938
1,202
1,2271
1,277
1,265
1,2684
1,2811
1,2727
1,2611
1,2881
1,3213
1,2999
1,3074
1,3242
1,3516
1,3511
1,3419
1,3716
1,3622
1,3896
1,4227
1,4684
1,457
1,4718
1,4748
1,5527
1,5751
1,5557
1,5553
1,577
1,4975
1,437
1,3322
1,2732
1,3449
1,3239
1,2785
1,305
1,319
1,365
1,4016
1,4088
1,4268
1,4562
1,4816
1,4914
1,4614
1,4272
1,3686
1,3569
1,3406
1,2565
1,2209
1,277
1,2894
1,3067
1,3898
1,3661
1,322
1,336


Summary of computational transaction
Raw Inputview raw input (R code)
Raw Outputview raw output of R engine
Computing time1 seconds
R Server'Herman Ole Andreas Wold' @ www.yougetit.org

\begin{tabular}{lllllllll}
\hline
Summary of computational transaction \tabularnewline
Raw Input & view raw input (R code)  \tabularnewline
Raw Output & view raw output of R engine  \tabularnewline
Computing time & 1 seconds \tabularnewline
R Server & 'Herman Ole Andreas Wold' @ www.yougetit.org \tabularnewline
\hline
\end{tabular}
%Source: https://freestatistics.org/blog/index.php?pk=120636&T=0

[TABLE]
[ROW][C]Summary of computational transaction[/C][/ROW]
[ROW][C]Raw Input[/C][C]view raw input (R code) [/C][/ROW]
[ROW][C]Raw Output[/C][C]view raw output of R engine [/C][/ROW]
[ROW][C]Computing time[/C][C]1 seconds[/C][/ROW]
[ROW][C]R Server[/C][C]'Herman Ole Andreas Wold' @ www.yougetit.org[/C][/ROW]
[/TABLE]
Source: https://freestatistics.org/blog/index.php?pk=120636&T=0

Globally Unique Identifier (entire table): ba.freestatistics.org/blog/index.php?pk=120636&T=0

As an alternative you can also use a QR Code:  

The GUIDs for individual cells are displayed in the table below:

Summary of computational transaction
Raw Inputview raw input (R code)
Raw Outputview raw output of R engine
Computing time1 seconds
R Server'Herman Ole Andreas Wold' @ www.yougetit.org


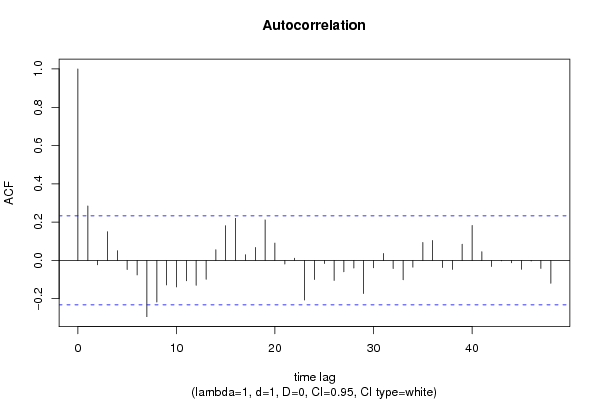
Autocorrelation Function
Time lag kACF(k)T-STATP-value
10.284712.3990.009534
2-0.02289-0.19290.423804
30.1502641.26610.1048
40.0502230.42320.33672
5-0.047559-0.40070.344909
6-0.075579-0.63680.26314
7-0.293593-2.47390.00788
8-0.217423-1.8320.03557
9-0.127788-1.07680.142617
10-0.138293-1.16530.123903
11-0.105723-0.89080.188012
12-0.129236-1.0890.139926
13-0.097984-0.82560.20589
140.0559090.47110.319509
150.1812131.52690.065611
160.2197741.85180.034103
170.0299360.25220.400791
180.0679070.57220.284499
190.2116981.78380.039365
200.090330.76110.224549
21-0.018563-0.15640.438076
220.0117420.09890.460733
23-0.206673-1.74150.042967
24-0.099665-0.83980.201921
25-0.015669-0.1320.447667
26-0.104376-0.87950.191053
27-0.059476-0.50120.308905
28-0.039573-0.33340.36989
29-0.172638-1.45470.075083
30-0.038659-0.32570.372788
310.0361620.30470.380741
32-0.042315-0.35660.361243
33-0.100813-0.84950.19924
34-0.034913-0.29420.384739
350.0935990.78870.216464
360.1043050.87890.191212
37-0.037203-0.31350.377418
38-0.046667-0.39320.347666
390.0845830.71270.239181
400.1820851.53430.064704
410.0454850.38330.351336
42-0.031392-0.26450.396076
43-0.002181-0.01840.492693
44-0.011759-0.09910.460675
45-0.045904-0.38680.350032
46-0.00339-0.02860.488644
47-0.04148-0.34950.363867
48-0.118861-1.00150.159984

\begin{tabular}{lllllllll}
\hline
Autocorrelation Function \tabularnewline
Time lag k & ACF(k) & T-STAT & P-value \tabularnewline
1 & 0.28471 & 2.399 & 0.009534 \tabularnewline
2 & -0.02289 & -0.1929 & 0.423804 \tabularnewline
3 & 0.150264 & 1.2661 & 0.1048 \tabularnewline
4 & 0.050223 & 0.4232 & 0.33672 \tabularnewline
5 & -0.047559 & -0.4007 & 0.344909 \tabularnewline
6 & -0.075579 & -0.6368 & 0.26314 \tabularnewline
7 & -0.293593 & -2.4739 & 0.00788 \tabularnewline
8 & -0.217423 & -1.832 & 0.03557 \tabularnewline
9 & -0.127788 & -1.0768 & 0.142617 \tabularnewline
10 & -0.138293 & -1.1653 & 0.123903 \tabularnewline
11 & -0.105723 & -0.8908 & 0.188012 \tabularnewline
12 & -0.129236 & -1.089 & 0.139926 \tabularnewline
13 & -0.097984 & -0.8256 & 0.20589 \tabularnewline
14 & 0.055909 & 0.4711 & 0.319509 \tabularnewline
15 & 0.181213 & 1.5269 & 0.065611 \tabularnewline
16 & 0.219774 & 1.8518 & 0.034103 \tabularnewline
17 & 0.029936 & 0.2522 & 0.400791 \tabularnewline
18 & 0.067907 & 0.5722 & 0.284499 \tabularnewline
19 & 0.211698 & 1.7838 & 0.039365 \tabularnewline
20 & 0.09033 & 0.7611 & 0.224549 \tabularnewline
21 & -0.018563 & -0.1564 & 0.438076 \tabularnewline
22 & 0.011742 & 0.0989 & 0.460733 \tabularnewline
23 & -0.206673 & -1.7415 & 0.042967 \tabularnewline
24 & -0.099665 & -0.8398 & 0.201921 \tabularnewline
25 & -0.015669 & -0.132 & 0.447667 \tabularnewline
26 & -0.104376 & -0.8795 & 0.191053 \tabularnewline
27 & -0.059476 & -0.5012 & 0.308905 \tabularnewline
28 & -0.039573 & -0.3334 & 0.36989 \tabularnewline
29 & -0.172638 & -1.4547 & 0.075083 \tabularnewline
30 & -0.038659 & -0.3257 & 0.372788 \tabularnewline
31 & 0.036162 & 0.3047 & 0.380741 \tabularnewline
32 & -0.042315 & -0.3566 & 0.361243 \tabularnewline
33 & -0.100813 & -0.8495 & 0.19924 \tabularnewline
34 & -0.034913 & -0.2942 & 0.384739 \tabularnewline
35 & 0.093599 & 0.7887 & 0.216464 \tabularnewline
36 & 0.104305 & 0.8789 & 0.191212 \tabularnewline
37 & -0.037203 & -0.3135 & 0.377418 \tabularnewline
38 & -0.046667 & -0.3932 & 0.347666 \tabularnewline
39 & 0.084583 & 0.7127 & 0.239181 \tabularnewline
40 & 0.182085 & 1.5343 & 0.064704 \tabularnewline
41 & 0.045485 & 0.3833 & 0.351336 \tabularnewline
42 & -0.031392 & -0.2645 & 0.396076 \tabularnewline
43 & -0.002181 & -0.0184 & 0.492693 \tabularnewline
44 & -0.011759 & -0.0991 & 0.460675 \tabularnewline
45 & -0.045904 & -0.3868 & 0.350032 \tabularnewline
46 & -0.00339 & -0.0286 & 0.488644 \tabularnewline
47 & -0.04148 & -0.3495 & 0.363867 \tabularnewline
48 & -0.118861 & -1.0015 & 0.159984 \tabularnewline
\hline
\end{tabular}
%Source: https://freestatistics.org/blog/index.php?pk=120636&T=1

[TABLE]
[ROW][C]Autocorrelation Function[/C][/ROW]
[ROW][C]Time lag k[/C][C]ACF(k)[/C][C]T-STAT[/C][C]P-value[/C][/ROW]
[ROW][C]1[/C][C]0.28471[/C][C]2.399[/C][C]0.009534[/C][/ROW]
[ROW][C]2[/C][C]-0.02289[/C][C]-0.1929[/C][C]0.423804[/C][/ROW]
[ROW][C]3[/C][C]0.150264[/C][C]1.2661[/C][C]0.1048[/C][/ROW]
[ROW][C]4[/C][C]0.050223[/C][C]0.4232[/C][C]0.33672[/C][/ROW]
[ROW][C]5[/C][C]-0.047559[/C][C]-0.4007[/C][C]0.344909[/C][/ROW]
[ROW][C]6[/C][C]-0.075579[/C][C]-0.6368[/C][C]0.26314[/C][/ROW]
[ROW][C]7[/C][C]-0.293593[/C][C]-2.4739[/C][C]0.00788[/C][/ROW]
[ROW][C]8[/C][C]-0.217423[/C][C]-1.832[/C][C]0.03557[/C][/ROW]
[ROW][C]9[/C][C]-0.127788[/C][C]-1.0768[/C][C]0.142617[/C][/ROW]
[ROW][C]10[/C][C]-0.138293[/C][C]-1.1653[/C][C]0.123903[/C][/ROW]
[ROW][C]11[/C][C]-0.105723[/C][C]-0.8908[/C][C]0.188012[/C][/ROW]
[ROW][C]12[/C][C]-0.129236[/C][C]-1.089[/C][C]0.139926[/C][/ROW]
[ROW][C]13[/C][C]-0.097984[/C][C]-0.8256[/C][C]0.20589[/C][/ROW]
[ROW][C]14[/C][C]0.055909[/C][C]0.4711[/C][C]0.319509[/C][/ROW]
[ROW][C]15[/C][C]0.181213[/C][C]1.5269[/C][C]0.065611[/C][/ROW]
[ROW][C]16[/C][C]0.219774[/C][C]1.8518[/C][C]0.034103[/C][/ROW]
[ROW][C]17[/C][C]0.029936[/C][C]0.2522[/C][C]0.400791[/C][/ROW]
[ROW][C]18[/C][C]0.067907[/C][C]0.5722[/C][C]0.284499[/C][/ROW]
[ROW][C]19[/C][C]0.211698[/C][C]1.7838[/C][C]0.039365[/C][/ROW]
[ROW][C]20[/C][C]0.09033[/C][C]0.7611[/C][C]0.224549[/C][/ROW]
[ROW][C]21[/C][C]-0.018563[/C][C]-0.1564[/C][C]0.438076[/C][/ROW]
[ROW][C]22[/C][C]0.011742[/C][C]0.0989[/C][C]0.460733[/C][/ROW]
[ROW][C]23[/C][C]-0.206673[/C][C]-1.7415[/C][C]0.042967[/C][/ROW]
[ROW][C]24[/C][C]-0.099665[/C][C]-0.8398[/C][C]0.201921[/C][/ROW]
[ROW][C]25[/C][C]-0.015669[/C][C]-0.132[/C][C]0.447667[/C][/ROW]
[ROW][C]26[/C][C]-0.104376[/C][C]-0.8795[/C][C]0.191053[/C][/ROW]
[ROW][C]27[/C][C]-0.059476[/C][C]-0.5012[/C][C]0.308905[/C][/ROW]
[ROW][C]28[/C][C]-0.039573[/C][C]-0.3334[/C][C]0.36989[/C][/ROW]
[ROW][C]29[/C][C]-0.172638[/C][C]-1.4547[/C][C]0.075083[/C][/ROW]
[ROW][C]30[/C][C]-0.038659[/C][C]-0.3257[/C][C]0.372788[/C][/ROW]
[ROW][C]31[/C][C]0.036162[/C][C]0.3047[/C][C]0.380741[/C][/ROW]
[ROW][C]32[/C][C]-0.042315[/C][C]-0.3566[/C][C]0.361243[/C][/ROW]
[ROW][C]33[/C][C]-0.100813[/C][C]-0.8495[/C][C]0.19924[/C][/ROW]
[ROW][C]34[/C][C]-0.034913[/C][C]-0.2942[/C][C]0.384739[/C][/ROW]
[ROW][C]35[/C][C]0.093599[/C][C]0.7887[/C][C]0.216464[/C][/ROW]
[ROW][C]36[/C][C]0.104305[/C][C]0.8789[/C][C]0.191212[/C][/ROW]
[ROW][C]37[/C][C]-0.037203[/C][C]-0.3135[/C][C]0.377418[/C][/ROW]
[ROW][C]38[/C][C]-0.046667[/C][C]-0.3932[/C][C]0.347666[/C][/ROW]
[ROW][C]39[/C][C]0.084583[/C][C]0.7127[/C][C]0.239181[/C][/ROW]
[ROW][C]40[/C][C]0.182085[/C][C]1.5343[/C][C]0.064704[/C][/ROW]
[ROW][C]41[/C][C]0.045485[/C][C]0.3833[/C][C]0.351336[/C][/ROW]
[ROW][C]42[/C][C]-0.031392[/C][C]-0.2645[/C][C]0.396076[/C][/ROW]
[ROW][C]43[/C][C]-0.002181[/C][C]-0.0184[/C][C]0.492693[/C][/ROW]
[ROW][C]44[/C][C]-0.011759[/C][C]-0.0991[/C][C]0.460675[/C][/ROW]
[ROW][C]45[/C][C]-0.045904[/C][C]-0.3868[/C][C]0.350032[/C][/ROW]
[ROW][C]46[/C][C]-0.00339[/C][C]-0.0286[/C][C]0.488644[/C][/ROW]
[ROW][C]47[/C][C]-0.04148[/C][C]-0.3495[/C][C]0.363867[/C][/ROW]
[ROW][C]48[/C][C]-0.118861[/C][C]-1.0015[/C][C]0.159984[/C][/ROW]
[/TABLE]
Source: https://freestatistics.org/blog/index.php?pk=120636&T=1

Globally Unique Identifier (entire table): ba.freestatistics.org/blog/index.php?pk=120636&T=1

As an alternative you can also use a QR Code:  

The GUIDs for individual cells are displayed in the table below:

Autocorrelation Function
Time lag kACF(k)T-STATP-value
10.284712.3990.009534
2-0.02289-0.19290.423804
30.1502641.26610.1048
40.0502230.42320.33672
5-0.047559-0.40070.344909
6-0.075579-0.63680.26314
7-0.293593-2.47390.00788
8-0.217423-1.8320.03557
9-0.127788-1.07680.142617
10-0.138293-1.16530.123903
11-0.105723-0.89080.188012
12-0.129236-1.0890.139926
13-0.097984-0.82560.20589
140.0559090.47110.319509
150.1812131.52690.065611
160.2197741.85180.034103
170.0299360.25220.400791
180.0679070.57220.284499
190.2116981.78380.039365
200.090330.76110.224549
21-0.018563-0.15640.438076
220.0117420.09890.460733
23-0.206673-1.74150.042967
24-0.099665-0.83980.201921
25-0.015669-0.1320.447667
26-0.104376-0.87950.191053
27-0.059476-0.50120.308905
28-0.039573-0.33340.36989
29-0.172638-1.45470.075083
30-0.038659-0.32570.372788
310.0361620.30470.380741
32-0.042315-0.35660.361243
33-0.100813-0.84950.19924
34-0.034913-0.29420.384739
350.0935990.78870.216464
360.1043050.87890.191212
37-0.037203-0.31350.377418
38-0.046667-0.39320.347666
390.0845830.71270.239181
400.1820851.53430.064704
410.0454850.38330.351336
42-0.031392-0.26450.396076
43-0.002181-0.01840.492693
44-0.011759-0.09910.460675
45-0.045904-0.38680.350032
46-0.00339-0.02860.488644
47-0.04148-0.34950.363867
48-0.118861-1.00150.159984


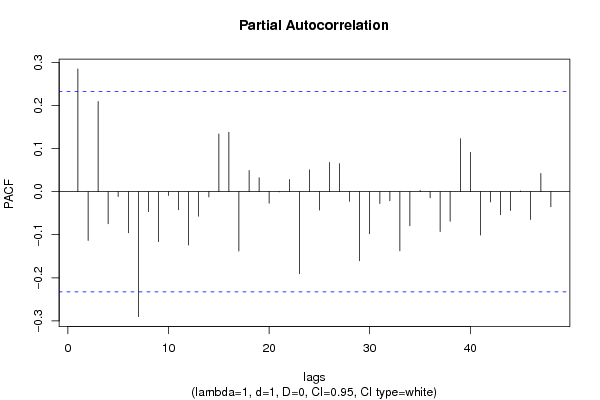
Partial Autocorrelation Function
Time lag kPACF(k)T-STATP-value
10.284712.3990.009534
2-0.113119-0.95320.171871
30.2091361.76220.041169
4-0.074469-0.62750.266176
5-0.011489-0.09680.461577
6-0.095504-0.80470.211831
7-0.290104-2.44450.008496
8-0.046453-0.39140.34833
9-0.116095-0.97820.165639
10-0.009051-0.07630.469712
11-0.042014-0.3540.362188
12-0.123813-1.04330.150181
13-0.056818-0.47880.316792
14-0.012219-0.1030.459142
150.1338531.12790.131586
160.1378111.16120.124722
17-0.137583-1.15930.125111
180.0491880.41450.339892
190.0324080.27310.392795
20-0.026925-0.22690.410588
21-0.000657-0.00550.4978
220.0282560.23810.40625
23-0.190378-1.60410.05656
240.0505820.42620.335621
25-0.042784-0.36050.359771
260.0676740.57020.285162
270.0650020.54770.292802
28-0.022201-0.18710.426069
29-0.160556-1.35290.090194
30-0.097763-0.82380.206417
31-0.027392-0.23080.409063
32-0.021087-0.17770.429738
33-0.137334-1.15720.125536
34-0.079067-0.66620.253712
350.0025190.02120.491562
36-0.014092-0.11870.452908
37-0.092582-0.78010.21896
38-0.068918-0.58070.281636
390.1225841.03290.152576
400.0911980.76840.222385
41-0.100776-0.84920.199325
42-0.023809-0.20060.420785
43-0.053476-0.45060.326828
44-0.043656-0.36790.357038
450.001410.01190.495278
46-0.064689-0.54510.293704
470.0420790.35460.361982
48-0.034901-0.29410.384776

\begin{tabular}{lllllllll}
\hline
Partial Autocorrelation Function \tabularnewline
Time lag k & PACF(k) & T-STAT & P-value \tabularnewline
1 & 0.28471 & 2.399 & 0.009534 \tabularnewline
2 & -0.113119 & -0.9532 & 0.171871 \tabularnewline
3 & 0.209136 & 1.7622 & 0.041169 \tabularnewline
4 & -0.074469 & -0.6275 & 0.266176 \tabularnewline
5 & -0.011489 & -0.0968 & 0.461577 \tabularnewline
6 & -0.095504 & -0.8047 & 0.211831 \tabularnewline
7 & -0.290104 & -2.4445 & 0.008496 \tabularnewline
8 & -0.046453 & -0.3914 & 0.34833 \tabularnewline
9 & -0.116095 & -0.9782 & 0.165639 \tabularnewline
10 & -0.009051 & -0.0763 & 0.469712 \tabularnewline
11 & -0.042014 & -0.354 & 0.362188 \tabularnewline
12 & -0.123813 & -1.0433 & 0.150181 \tabularnewline
13 & -0.056818 & -0.4788 & 0.316792 \tabularnewline
14 & -0.012219 & -0.103 & 0.459142 \tabularnewline
15 & 0.133853 & 1.1279 & 0.131586 \tabularnewline
16 & 0.137811 & 1.1612 & 0.124722 \tabularnewline
17 & -0.137583 & -1.1593 & 0.125111 \tabularnewline
18 & 0.049188 & 0.4145 & 0.339892 \tabularnewline
19 & 0.032408 & 0.2731 & 0.392795 \tabularnewline
20 & -0.026925 & -0.2269 & 0.410588 \tabularnewline
21 & -0.000657 & -0.0055 & 0.4978 \tabularnewline
22 & 0.028256 & 0.2381 & 0.40625 \tabularnewline
23 & -0.190378 & -1.6041 & 0.05656 \tabularnewline
24 & 0.050582 & 0.4262 & 0.335621 \tabularnewline
25 & -0.042784 & -0.3605 & 0.359771 \tabularnewline
26 & 0.067674 & 0.5702 & 0.285162 \tabularnewline
27 & 0.065002 & 0.5477 & 0.292802 \tabularnewline
28 & -0.022201 & -0.1871 & 0.426069 \tabularnewline
29 & -0.160556 & -1.3529 & 0.090194 \tabularnewline
30 & -0.097763 & -0.8238 & 0.206417 \tabularnewline
31 & -0.027392 & -0.2308 & 0.409063 \tabularnewline
32 & -0.021087 & -0.1777 & 0.429738 \tabularnewline
33 & -0.137334 & -1.1572 & 0.125536 \tabularnewline
34 & -0.079067 & -0.6662 & 0.253712 \tabularnewline
35 & 0.002519 & 0.0212 & 0.491562 \tabularnewline
36 & -0.014092 & -0.1187 & 0.452908 \tabularnewline
37 & -0.092582 & -0.7801 & 0.21896 \tabularnewline
38 & -0.068918 & -0.5807 & 0.281636 \tabularnewline
39 & 0.122584 & 1.0329 & 0.152576 \tabularnewline
40 & 0.091198 & 0.7684 & 0.222385 \tabularnewline
41 & -0.100776 & -0.8492 & 0.199325 \tabularnewline
42 & -0.023809 & -0.2006 & 0.420785 \tabularnewline
43 & -0.053476 & -0.4506 & 0.326828 \tabularnewline
44 & -0.043656 & -0.3679 & 0.357038 \tabularnewline
45 & 0.00141 & 0.0119 & 0.495278 \tabularnewline
46 & -0.064689 & -0.5451 & 0.293704 \tabularnewline
47 & 0.042079 & 0.3546 & 0.361982 \tabularnewline
48 & -0.034901 & -0.2941 & 0.384776 \tabularnewline
\hline
\end{tabular}
%Source: https://freestatistics.org/blog/index.php?pk=120636&T=2

[TABLE]
[ROW][C]Partial Autocorrelation Function[/C][/ROW]
[ROW][C]Time lag k[/C][C]PACF(k)[/C][C]T-STAT[/C][C]P-value[/C][/ROW]
[ROW][C]1[/C][C]0.28471[/C][C]2.399[/C][C]0.009534[/C][/ROW]
[ROW][C]2[/C][C]-0.113119[/C][C]-0.9532[/C][C]0.171871[/C][/ROW]
[ROW][C]3[/C][C]0.209136[/C][C]1.7622[/C][C]0.041169[/C][/ROW]
[ROW][C]4[/C][C]-0.074469[/C][C]-0.6275[/C][C]0.266176[/C][/ROW]
[ROW][C]5[/C][C]-0.011489[/C][C]-0.0968[/C][C]0.461577[/C][/ROW]
[ROW][C]6[/C][C]-0.095504[/C][C]-0.8047[/C][C]0.211831[/C][/ROW]
[ROW][C]7[/C][C]-0.290104[/C][C]-2.4445[/C][C]0.008496[/C][/ROW]
[ROW][C]8[/C][C]-0.046453[/C][C]-0.3914[/C][C]0.34833[/C][/ROW]
[ROW][C]9[/C][C]-0.116095[/C][C]-0.9782[/C][C]0.165639[/C][/ROW]
[ROW][C]10[/C][C]-0.009051[/C][C]-0.0763[/C][C]0.469712[/C][/ROW]
[ROW][C]11[/C][C]-0.042014[/C][C]-0.354[/C][C]0.362188[/C][/ROW]
[ROW][C]12[/C][C]-0.123813[/C][C]-1.0433[/C][C]0.150181[/C][/ROW]
[ROW][C]13[/C][C]-0.056818[/C][C]-0.4788[/C][C]0.316792[/C][/ROW]
[ROW][C]14[/C][C]-0.012219[/C][C]-0.103[/C][C]0.459142[/C][/ROW]
[ROW][C]15[/C][C]0.133853[/C][C]1.1279[/C][C]0.131586[/C][/ROW]
[ROW][C]16[/C][C]0.137811[/C][C]1.1612[/C][C]0.124722[/C][/ROW]
[ROW][C]17[/C][C]-0.137583[/C][C]-1.1593[/C][C]0.125111[/C][/ROW]
[ROW][C]18[/C][C]0.049188[/C][C]0.4145[/C][C]0.339892[/C][/ROW]
[ROW][C]19[/C][C]0.032408[/C][C]0.2731[/C][C]0.392795[/C][/ROW]
[ROW][C]20[/C][C]-0.026925[/C][C]-0.2269[/C][C]0.410588[/C][/ROW]
[ROW][C]21[/C][C]-0.000657[/C][C]-0.0055[/C][C]0.4978[/C][/ROW]
[ROW][C]22[/C][C]0.028256[/C][C]0.2381[/C][C]0.40625[/C][/ROW]
[ROW][C]23[/C][C]-0.190378[/C][C]-1.6041[/C][C]0.05656[/C][/ROW]
[ROW][C]24[/C][C]0.050582[/C][C]0.4262[/C][C]0.335621[/C][/ROW]
[ROW][C]25[/C][C]-0.042784[/C][C]-0.3605[/C][C]0.359771[/C][/ROW]
[ROW][C]26[/C][C]0.067674[/C][C]0.5702[/C][C]0.285162[/C][/ROW]
[ROW][C]27[/C][C]0.065002[/C][C]0.5477[/C][C]0.292802[/C][/ROW]
[ROW][C]28[/C][C]-0.022201[/C][C]-0.1871[/C][C]0.426069[/C][/ROW]
[ROW][C]29[/C][C]-0.160556[/C][C]-1.3529[/C][C]0.090194[/C][/ROW]
[ROW][C]30[/C][C]-0.097763[/C][C]-0.8238[/C][C]0.206417[/C][/ROW]
[ROW][C]31[/C][C]-0.027392[/C][C]-0.2308[/C][C]0.409063[/C][/ROW]
[ROW][C]32[/C][C]-0.021087[/C][C]-0.1777[/C][C]0.429738[/C][/ROW]
[ROW][C]33[/C][C]-0.137334[/C][C]-1.1572[/C][C]0.125536[/C][/ROW]
[ROW][C]34[/C][C]-0.079067[/C][C]-0.6662[/C][C]0.253712[/C][/ROW]
[ROW][C]35[/C][C]0.002519[/C][C]0.0212[/C][C]0.491562[/C][/ROW]
[ROW][C]36[/C][C]-0.014092[/C][C]-0.1187[/C][C]0.452908[/C][/ROW]
[ROW][C]37[/C][C]-0.092582[/C][C]-0.7801[/C][C]0.21896[/C][/ROW]
[ROW][C]38[/C][C]-0.068918[/C][C]-0.5807[/C][C]0.281636[/C][/ROW]
[ROW][C]39[/C][C]0.122584[/C][C]1.0329[/C][C]0.152576[/C][/ROW]
[ROW][C]40[/C][C]0.091198[/C][C]0.7684[/C][C]0.222385[/C][/ROW]
[ROW][C]41[/C][C]-0.100776[/C][C]-0.8492[/C][C]0.199325[/C][/ROW]
[ROW][C]42[/C][C]-0.023809[/C][C]-0.2006[/C][C]0.420785[/C][/ROW]
[ROW][C]43[/C][C]-0.053476[/C][C]-0.4506[/C][C]0.326828[/C][/ROW]
[ROW][C]44[/C][C]-0.043656[/C][C]-0.3679[/C][C]0.357038[/C][/ROW]
[ROW][C]45[/C][C]0.00141[/C][C]0.0119[/C][C]0.495278[/C][/ROW]
[ROW][C]46[/C][C]-0.064689[/C][C]-0.5451[/C][C]0.293704[/C][/ROW]
[ROW][C]47[/C][C]0.042079[/C][C]0.3546[/C][C]0.361982[/C][/ROW]
[ROW][C]48[/C][C]-0.034901[/C][C]-0.2941[/C][C]0.384776[/C][/ROW]
[/TABLE]
Source: https://freestatistics.org/blog/index.php?pk=120636&T=2

Globally Unique Identifier (entire table): ba.freestatistics.org/blog/index.php?pk=120636&T=2

As an alternative you can also use a QR Code:  

The GUIDs for individual cells are displayed in the table below:

Partial Autocorrelation Function
Time lag kPACF(k)T-STATP-value
10.284712.3990.009534
2-0.113119-0.95320.171871
30.2091361.76220.041169
4-0.074469-0.62750.266176
5-0.011489-0.09680.461577
6-0.095504-0.80470.211831
7-0.290104-2.44450.008496
8-0.046453-0.39140.34833
9-0.116095-0.97820.165639
10-0.009051-0.07630.469712
11-0.042014-0.3540.362188
12-0.123813-1.04330.150181
13-0.056818-0.47880.316792
14-0.012219-0.1030.459142
150.1338531.12790.131586
160.1378111.16120.124722
17-0.137583-1.15930.125111
180.0491880.41450.339892
190.0324080.27310.392795
20-0.026925-0.22690.410588
21-0.000657-0.00550.4978
220.0282560.23810.40625
23-0.190378-1.60410.05656
240.0505820.42620.335621
25-0.042784-0.36050.359771
260.0676740.57020.285162
270.0650020.54770.292802
28-0.022201-0.18710.426069
29-0.160556-1.35290.090194
30-0.097763-0.82380.206417
31-0.027392-0.23080.409063
32-0.021087-0.17770.429738
33-0.137334-1.15720.125536
34-0.079067-0.66620.253712
350.0025190.02120.491562
36-0.014092-0.11870.452908
37-0.092582-0.78010.21896
38-0.068918-0.58070.281636
390.1225841.03290.152576
400.0911980.76840.222385
41-0.100776-0.84920.199325
42-0.023809-0.20060.420785
43-0.053476-0.45060.326828
44-0.043656-0.36790.357038
450.001410.01190.495278
46-0.064689-0.54510.293704
470.0420790.35460.361982
48-0.034901-0.29410.384776


Parameters (Session):
par1 = 48 ; par2 = 1 ; par3 = 1 ; par4 = 0 ; par5 = 12 ; par6 = White Noise ; par7 = 0.95 ;
Parameters (R input):
par1 = 48 ; par2 = 1 ; par3 = 1 ; par4 = 0 ; par5 = 12 ; par6 = White Noise ; par7 = 0.95 ; par8 = ;
R code (references can be found in the software module):
if (par1 == 'Default') {
par1 = 10*log10(length(x))
} else {
par1 <- as.numeric(par1)
}
par2 <- as.numeric(par2)
par3 <- as.numeric(par3)
par4 <- as.numeric(par4)
par5 <- as.numeric(par5)
if (par6 == 'White Noise') par6 <- 'white' else par6 <- 'ma'
par7 <- as.numeric(par7)
if (par8 != '') par8 <- as.numeric(par8)
ox <- x
if (par8 == '') {
if (par2 == 0) {
x <- log(x)
} else {
x <- (x ^ par2 - 1) / par2
}
} else {
x <- log(x,base=par8)
}
if (par3 > 0) x <- diff(x,lag=1,difference=par3)
if (par4 > 0) x <- diff(x,lag=par5,difference=par4)
bitmap(file='picts.png')
op <- par(mfrow=c(2,1))
plot(ox,type='l',main='Original Time Series',xlab='time',ylab='value')
if (par8=='') {
mytitle <- paste('Working Time Series (lambda=',par2,', d=',par3,', D=',par4,')',sep='')
mysub <- paste('(lambda=',par2,', d=',par3,', D=',par4,', CI=', par7, ', CI type=',par6,')',sep='')
} else {
mytitle <- paste('Working Time Series (base=',par8,', d=',par3,', D=',par4,')',sep='')
mysub <- paste('(base=',par8,', d=',par3,', D=',par4,', CI=', par7, ', CI type=',par6,')',sep='')
}
plot(x,type='l', main=mytitle,xlab='time',ylab='value')
par(op)
dev.off()
bitmap(file='pic1.png')
racf <- acf(x, par1, main='Autocorrelation', xlab='time lag', ylab='ACF', ci.type=par6, ci=par7, sub=mysub)
dev.off()
bitmap(file='pic2.png')
rpacf <- pacf(x,par1,main='Partial Autocorrelation',xlab='lags',ylab='PACF',sub=mysub)
dev.off()
(myacf <- c(racf$acf))
(mypacf <- c(rpacf$acf))
lengthx <- length(x)
sqrtn <- sqrt(lengthx)
load(file='createtable')
a<-table.start()
a<-table.row.start(a)
a<-table.element(a,'Autocorrelation Function',4,TRUE)
a<-table.row.end(a)
a<-table.row.start(a)
a<-table.element(a,'Time lag k',header=TRUE)
a<-table.element(a,hyperlink('basics.htm','ACF(k)','click here for more information about the Autocorrelation Function'),header=TRUE)
a<-table.element(a,'T-STAT',header=TRUE)
a<-table.element(a,'P-value',header=TRUE)
a<-table.row.end(a)
for (i in 2:(par1+1)) {
a<-table.row.start(a)
a<-table.element(a,i-1,header=TRUE)
a<-table.element(a,round(myacf[i],6))
mytstat <- myacf[i]*sqrtn
a<-table.element(a,round(mytstat,4))
a<-table.element(a,round(1-pt(abs(mytstat),lengthx),6))
a<-table.row.end(a)
}
a<-table.end(a)
table.save(a,file='mytable.tab')
a<-table.start()
a<-table.row.start(a)
a<-table.element(a,'Partial Autocorrelation Function',4,TRUE)
a<-table.row.end(a)
a<-table.row.start(a)
a<-table.element(a,'Time lag k',header=TRUE)
a<-table.element(a,hyperlink('basics.htm','PACF(k)','click here for more information about the Partial Autocorrelation Function'),header=TRUE)
a<-table.element(a,'T-STAT',header=TRUE)
a<-table.element(a,'P-value',header=TRUE)
a<-table.row.end(a)
for (i in 1:par1) {
a<-table.row.start(a)
a<-table.element(a,i,header=TRUE)
a<-table.element(a,round(mypacf[i],6))
mytstat <- mypacf[i]*sqrtn
a<-table.element(a,round(mytstat,4))
a<-table.element(a,round(1-pt(abs(mytstat),lengthx),6))
a<-table.row.end(a)
}
a<-table.end(a)
table.save(a,file='mytable1.tab')