Free Statistics

of Irreproducible Research!

Author's title

Author*Unverified author*
R Software Modulerwasp_autocorrelation.wasp
Title produced by software(Partial) Autocorrelation Function
Date of computationTue, 26 Apr 2011 14:14:46 +0000
Cite this page as followsStatistical Computations at FreeStatistics.org, Office for Research Development and Education, URL https://freestatistics.org/blog/index.php?v=date/2011/Apr/26/t13038270780ebbt0cplditj8e.htm/, Retrieved Thu, 09 May 2024 13:17:43 +0000
Statistical Computations at FreeStatistics.org, Office for Research Development and Education, URL https://freestatistics.org/blog/index.php?pk=120635, Retrieved Thu, 09 May 2024 13:17:43 +0000
QR Codes:

Original text written by user:
IsPrivate?No (this computation is public)
User-defined keywordsKDGP2W12
Estimated Impact205
Family? (F = Feedback message, R = changed R code, M = changed R Module, P = changed Parameters, D = changed Data)
-       [(Partial) Autocorrelation Function] [] [2011-04-26 14:14:46] [39dfb880f237820275004e8a4e7fff84] [Current]
Feedback Forum

Post a new message
Dataseries X:
1,3014
1,3201
1,2938
1,2694
1,2165
1,2037
1,2292
1,2256
1,2015
1,1786
1,1856
1,2103
1,1938
1,202
1,2271
1,277
1,265
1,2684
1,2811
1,2727
1,2611
1,2881
1,3213
1,2999
1,3074
1,3242
1,3516
1,3511
1,3419
1,3716
1,3622
1,3896
1,4227
1,4684
1,457
1,4718
1,4748
1,5527
1,5751
1,5557
1,5553
1,577
1,4975
1,437
1,3322
1,2732
1,3449
1,3239
1,2785
1,305
1,319
1,365
1,4016
1,4088
1,4268
1,4562
1,4816
1,4914
1,4614
1,4272
1,3686
1,3569
1,3406
1,2565
1,2209
1,277
1,2894
1,3067
1,3898
1,3661
1,322
1,336


Summary of computational transaction
Raw Inputview raw input (R code)
Raw Outputview raw output of R engine
Computing time3 seconds
R Server'RServer@AstonUniversity' @ vre.aston.ac.uk

\begin{tabular}{lllllllll}
\hline
Summary of computational transaction \tabularnewline
Raw Input & view raw input (R code)  \tabularnewline
Raw Output & view raw output of R engine  \tabularnewline
Computing time & 3 seconds \tabularnewline
R Server & 'RServer@AstonUniversity' @ vre.aston.ac.uk \tabularnewline
\hline
\end{tabular}
%Source: https://freestatistics.org/blog/index.php?pk=120635&T=0

[TABLE]
[ROW][C]Summary of computational transaction[/C][/ROW]
[ROW][C]Raw Input[/C][C]view raw input (R code) [/C][/ROW]
[ROW][C]Raw Output[/C][C]view raw output of R engine [/C][/ROW]
[ROW][C]Computing time[/C][C]3 seconds[/C][/ROW]
[ROW][C]R Server[/C][C]'RServer@AstonUniversity' @ vre.aston.ac.uk[/C][/ROW]
[/TABLE]
Source: https://freestatistics.org/blog/index.php?pk=120635&T=0

Globally Unique Identifier (entire table): ba.freestatistics.org/blog/index.php?pk=120635&T=0

As an alternative you can also use a QR Code:  

The GUIDs for individual cells are displayed in the table below:

Summary of computational transaction
Raw Inputview raw input (R code)
Raw Outputview raw output of R engine
Computing time3 seconds
R Server'RServer@AstonUniversity' @ vre.aston.ac.uk


Autocorrelation Function
Time lag kACF(k)T-STATP-value
10.935947.94170
20.8370527.10260
30.7399536.27870
40.6227595.28431e-06
50.4952654.20253.7e-05
60.3727643.1630.001143
70.2610522.21510.014959
80.1853961.57310.060036
90.1360011.1540.126158
100.102130.86660.194521
110.0860850.73050.233741
120.0847530.71920.237188
130.0991730.84150.201425
140.126561.07390.143228
150.1485131.26020.105838
160.1503331.27560.103095
170.1234651.04760.149156
180.0926070.78580.217283
190.0536690.45540.325098
20-0.012503-0.10610.457903
21-0.091151-0.77340.220897
22-0.166438-1.41230.081088
23-0.241439-2.04870.02207
24-0.291997-2.47770.007786
25-0.329139-2.79280.003344
26-0.363145-3.08140.001459
27-0.383198-3.25150.000874
28-0.395173-3.35320.000638
29-0.401653-3.40810.000537
30-0.384192-3.260.000852
31-0.361713-3.06920.001513
32-0.342553-2.90670.002426
33-0.316271-2.68370.004515
34-0.274578-2.32990.01131
35-0.22947-1.94710.027711
36-0.196114-1.66410.050221
37-0.175725-1.49110.070154
38-0.146298-1.24140.109248
39-0.109542-0.92950.177868
40-0.084939-0.72070.236705
41-0.083481-0.70840.240504
42-0.086654-0.73530.232277
43-0.090283-0.76610.223068
44-0.097384-0.82630.205673
45-0.108957-0.92450.179149
46-0.118217-1.00310.159585
47-0.123227-1.04560.149618
48-0.12442-1.05570.14731

\begin{tabular}{lllllllll}
\hline
Autocorrelation Function \tabularnewline
Time lag k & ACF(k) & T-STAT & P-value \tabularnewline
1 & 0.93594 & 7.9417 & 0 \tabularnewline
2 & 0.837052 & 7.1026 & 0 \tabularnewline
3 & 0.739953 & 6.2787 & 0 \tabularnewline
4 & 0.622759 & 5.2843 & 1e-06 \tabularnewline
5 & 0.495265 & 4.2025 & 3.7e-05 \tabularnewline
6 & 0.372764 & 3.163 & 0.001143 \tabularnewline
7 & 0.261052 & 2.2151 & 0.014959 \tabularnewline
8 & 0.185396 & 1.5731 & 0.060036 \tabularnewline
9 & 0.136001 & 1.154 & 0.126158 \tabularnewline
10 & 0.10213 & 0.8666 & 0.194521 \tabularnewline
11 & 0.086085 & 0.7305 & 0.233741 \tabularnewline
12 & 0.084753 & 0.7192 & 0.237188 \tabularnewline
13 & 0.099173 & 0.8415 & 0.201425 \tabularnewline
14 & 0.12656 & 1.0739 & 0.143228 \tabularnewline
15 & 0.148513 & 1.2602 & 0.105838 \tabularnewline
16 & 0.150333 & 1.2756 & 0.103095 \tabularnewline
17 & 0.123465 & 1.0476 & 0.149156 \tabularnewline
18 & 0.092607 & 0.7858 & 0.217283 \tabularnewline
19 & 0.053669 & 0.4554 & 0.325098 \tabularnewline
20 & -0.012503 & -0.1061 & 0.457903 \tabularnewline
21 & -0.091151 & -0.7734 & 0.220897 \tabularnewline
22 & -0.166438 & -1.4123 & 0.081088 \tabularnewline
23 & -0.241439 & -2.0487 & 0.02207 \tabularnewline
24 & -0.291997 & -2.4777 & 0.007786 \tabularnewline
25 & -0.329139 & -2.7928 & 0.003344 \tabularnewline
26 & -0.363145 & -3.0814 & 0.001459 \tabularnewline
27 & -0.383198 & -3.2515 & 0.000874 \tabularnewline
28 & -0.395173 & -3.3532 & 0.000638 \tabularnewline
29 & -0.401653 & -3.4081 & 0.000537 \tabularnewline
30 & -0.384192 & -3.26 & 0.000852 \tabularnewline
31 & -0.361713 & -3.0692 & 0.001513 \tabularnewline
32 & -0.342553 & -2.9067 & 0.002426 \tabularnewline
33 & -0.316271 & -2.6837 & 0.004515 \tabularnewline
34 & -0.274578 & -2.3299 & 0.01131 \tabularnewline
35 & -0.22947 & -1.9471 & 0.027711 \tabularnewline
36 & -0.196114 & -1.6641 & 0.050221 \tabularnewline
37 & -0.175725 & -1.4911 & 0.070154 \tabularnewline
38 & -0.146298 & -1.2414 & 0.109248 \tabularnewline
39 & -0.109542 & -0.9295 & 0.177868 \tabularnewline
40 & -0.084939 & -0.7207 & 0.236705 \tabularnewline
41 & -0.083481 & -0.7084 & 0.240504 \tabularnewline
42 & -0.086654 & -0.7353 & 0.232277 \tabularnewline
43 & -0.090283 & -0.7661 & 0.223068 \tabularnewline
44 & -0.097384 & -0.8263 & 0.205673 \tabularnewline
45 & -0.108957 & -0.9245 & 0.179149 \tabularnewline
46 & -0.118217 & -1.0031 & 0.159585 \tabularnewline
47 & -0.123227 & -1.0456 & 0.149618 \tabularnewline
48 & -0.12442 & -1.0557 & 0.14731 \tabularnewline
\hline
\end{tabular}
%Source: https://freestatistics.org/blog/index.php?pk=120635&T=1

[TABLE]
[ROW][C]Autocorrelation Function[/C][/ROW]
[ROW][C]Time lag k[/C][C]ACF(k)[/C][C]T-STAT[/C][C]P-value[/C][/ROW]
[ROW][C]1[/C][C]0.93594[/C][C]7.9417[/C][C]0[/C][/ROW]
[ROW][C]2[/C][C]0.837052[/C][C]7.1026[/C][C]0[/C][/ROW]
[ROW][C]3[/C][C]0.739953[/C][C]6.2787[/C][C]0[/C][/ROW]
[ROW][C]4[/C][C]0.622759[/C][C]5.2843[/C][C]1e-06[/C][/ROW]
[ROW][C]5[/C][C]0.495265[/C][C]4.2025[/C][C]3.7e-05[/C][/ROW]
[ROW][C]6[/C][C]0.372764[/C][C]3.163[/C][C]0.001143[/C][/ROW]
[ROW][C]7[/C][C]0.261052[/C][C]2.2151[/C][C]0.014959[/C][/ROW]
[ROW][C]8[/C][C]0.185396[/C][C]1.5731[/C][C]0.060036[/C][/ROW]
[ROW][C]9[/C][C]0.136001[/C][C]1.154[/C][C]0.126158[/C][/ROW]
[ROW][C]10[/C][C]0.10213[/C][C]0.8666[/C][C]0.194521[/C][/ROW]
[ROW][C]11[/C][C]0.086085[/C][C]0.7305[/C][C]0.233741[/C][/ROW]
[ROW][C]12[/C][C]0.084753[/C][C]0.7192[/C][C]0.237188[/C][/ROW]
[ROW][C]13[/C][C]0.099173[/C][C]0.8415[/C][C]0.201425[/C][/ROW]
[ROW][C]14[/C][C]0.12656[/C][C]1.0739[/C][C]0.143228[/C][/ROW]
[ROW][C]15[/C][C]0.148513[/C][C]1.2602[/C][C]0.105838[/C][/ROW]
[ROW][C]16[/C][C]0.150333[/C][C]1.2756[/C][C]0.103095[/C][/ROW]
[ROW][C]17[/C][C]0.123465[/C][C]1.0476[/C][C]0.149156[/C][/ROW]
[ROW][C]18[/C][C]0.092607[/C][C]0.7858[/C][C]0.217283[/C][/ROW]
[ROW][C]19[/C][C]0.053669[/C][C]0.4554[/C][C]0.325098[/C][/ROW]
[ROW][C]20[/C][C]-0.012503[/C][C]-0.1061[/C][C]0.457903[/C][/ROW]
[ROW][C]21[/C][C]-0.091151[/C][C]-0.7734[/C][C]0.220897[/C][/ROW]
[ROW][C]22[/C][C]-0.166438[/C][C]-1.4123[/C][C]0.081088[/C][/ROW]
[ROW][C]23[/C][C]-0.241439[/C][C]-2.0487[/C][C]0.02207[/C][/ROW]
[ROW][C]24[/C][C]-0.291997[/C][C]-2.4777[/C][C]0.007786[/C][/ROW]
[ROW][C]25[/C][C]-0.329139[/C][C]-2.7928[/C][C]0.003344[/C][/ROW]
[ROW][C]26[/C][C]-0.363145[/C][C]-3.0814[/C][C]0.001459[/C][/ROW]
[ROW][C]27[/C][C]-0.383198[/C][C]-3.2515[/C][C]0.000874[/C][/ROW]
[ROW][C]28[/C][C]-0.395173[/C][C]-3.3532[/C][C]0.000638[/C][/ROW]
[ROW][C]29[/C][C]-0.401653[/C][C]-3.4081[/C][C]0.000537[/C][/ROW]
[ROW][C]30[/C][C]-0.384192[/C][C]-3.26[/C][C]0.000852[/C][/ROW]
[ROW][C]31[/C][C]-0.361713[/C][C]-3.0692[/C][C]0.001513[/C][/ROW]
[ROW][C]32[/C][C]-0.342553[/C][C]-2.9067[/C][C]0.002426[/C][/ROW]
[ROW][C]33[/C][C]-0.316271[/C][C]-2.6837[/C][C]0.004515[/C][/ROW]
[ROW][C]34[/C][C]-0.274578[/C][C]-2.3299[/C][C]0.01131[/C][/ROW]
[ROW][C]35[/C][C]-0.22947[/C][C]-1.9471[/C][C]0.027711[/C][/ROW]
[ROW][C]36[/C][C]-0.196114[/C][C]-1.6641[/C][C]0.050221[/C][/ROW]
[ROW][C]37[/C][C]-0.175725[/C][C]-1.4911[/C][C]0.070154[/C][/ROW]
[ROW][C]38[/C][C]-0.146298[/C][C]-1.2414[/C][C]0.109248[/C][/ROW]
[ROW][C]39[/C][C]-0.109542[/C][C]-0.9295[/C][C]0.177868[/C][/ROW]
[ROW][C]40[/C][C]-0.084939[/C][C]-0.7207[/C][C]0.236705[/C][/ROW]
[ROW][C]41[/C][C]-0.083481[/C][C]-0.7084[/C][C]0.240504[/C][/ROW]
[ROW][C]42[/C][C]-0.086654[/C][C]-0.7353[/C][C]0.232277[/C][/ROW]
[ROW][C]43[/C][C]-0.090283[/C][C]-0.7661[/C][C]0.223068[/C][/ROW]
[ROW][C]44[/C][C]-0.097384[/C][C]-0.8263[/C][C]0.205673[/C][/ROW]
[ROW][C]45[/C][C]-0.108957[/C][C]-0.9245[/C][C]0.179149[/C][/ROW]
[ROW][C]46[/C][C]-0.118217[/C][C]-1.0031[/C][C]0.159585[/C][/ROW]
[ROW][C]47[/C][C]-0.123227[/C][C]-1.0456[/C][C]0.149618[/C][/ROW]
[ROW][C]48[/C][C]-0.12442[/C][C]-1.0557[/C][C]0.14731[/C][/ROW]
[/TABLE]
Source: https://freestatistics.org/blog/index.php?pk=120635&T=1

Globally Unique Identifier (entire table): ba.freestatistics.org/blog/index.php?pk=120635&T=1

As an alternative you can also use a QR Code:  

The GUIDs for individual cells are displayed in the table below:

Autocorrelation Function
Time lag kACF(k)T-STATP-value
10.935947.94170
20.8370527.10260
30.7399536.27870
40.6227595.28431e-06
50.4952654.20253.7e-05
60.3727643.1630.001143
70.2610522.21510.014959
80.1853961.57310.060036
90.1360011.1540.126158
100.102130.86660.194521
110.0860850.73050.233741
120.0847530.71920.237188
130.0991730.84150.201425
140.126561.07390.143228
150.1485131.26020.105838
160.1503331.27560.103095
170.1234651.04760.149156
180.0926070.78580.217283
190.0536690.45540.325098
20-0.012503-0.10610.457903
21-0.091151-0.77340.220897
22-0.166438-1.41230.081088
23-0.241439-2.04870.02207
24-0.291997-2.47770.007786
25-0.329139-2.79280.003344
26-0.363145-3.08140.001459
27-0.383198-3.25150.000874
28-0.395173-3.35320.000638
29-0.401653-3.40810.000537
30-0.384192-3.260.000852
31-0.361713-3.06920.001513
32-0.342553-2.90670.002426
33-0.316271-2.68370.004515
34-0.274578-2.32990.01131
35-0.22947-1.94710.027711
36-0.196114-1.66410.050221
37-0.175725-1.49110.070154
38-0.146298-1.24140.109248
39-0.109542-0.92950.177868
40-0.084939-0.72070.236705
41-0.083481-0.70840.240504
42-0.086654-0.73530.232277
43-0.090283-0.76610.223068
44-0.097384-0.82630.205673
45-0.108957-0.92450.179149
46-0.118217-1.00310.159585
47-0.123227-1.04560.149618
48-0.12442-1.05570.14731


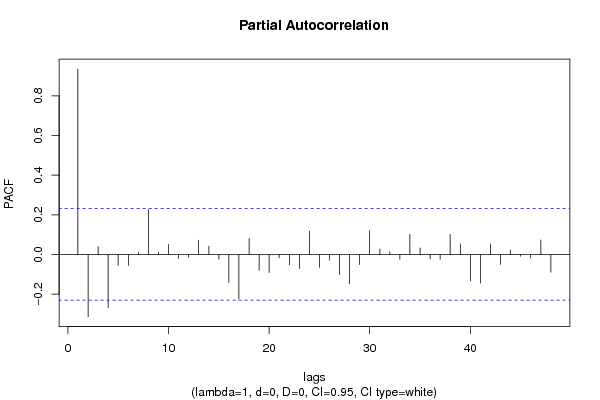
Partial Autocorrelation Function
Time lag kPACF(k)T-STATP-value
10.935947.94170
2-0.313921-2.66370.004765
30.0393450.33390.36973
4-0.267822-2.27250.01302
5-0.054645-0.46370.322137
6-0.054641-0.46360.322152
70.0115840.09830.460987
80.2257061.91520.029721
90.0112390.09540.462143
100.0504590.42820.334905
11-0.020836-0.17680.430082
12-0.013615-0.11550.454174
130.0715160.60680.272936
140.0414850.3520.362928
15-0.02455-0.20830.417788
16-0.141321-1.19910.117201
17-0.225131-1.91030.030039
180.0805990.68390.248114
19-0.080149-0.68010.249316
20-0.091479-0.77620.220079
21-0.017171-0.14570.442281
22-0.051518-0.43710.331656
23-0.070361-0.5970.276181
240.1163770.98750.163354
25-0.06439-0.54640.293252
26-0.028784-0.24420.403869
27-0.101557-0.86170.195845
28-0.147644-1.25280.107167
29-0.050884-0.43180.333602
300.1194451.01350.157102
310.0274660.23310.408188
320.0139640.11850.453006
33-0.024446-0.20740.418129
340.1004040.8520.198532
350.0323810.27480.392142
36-0.021937-0.18610.426429
37-0.023801-0.2020.420261
380.1003190.85120.19873
390.0524080.44470.328935
40-0.133072-1.12910.131291
41-0.144598-1.2270.111918
420.0530640.45030.326937
43-0.050434-0.42790.334983
440.0228190.19360.423508
45-0.00911-0.07730.469298
46-0.018283-0.15510.438575
470.073230.62140.268156
48-0.089423-0.75880.22523

\begin{tabular}{lllllllll}
\hline
Partial Autocorrelation Function \tabularnewline
Time lag k & PACF(k) & T-STAT & P-value \tabularnewline
1 & 0.93594 & 7.9417 & 0 \tabularnewline
2 & -0.313921 & -2.6637 & 0.004765 \tabularnewline
3 & 0.039345 & 0.3339 & 0.36973 \tabularnewline
4 & -0.267822 & -2.2725 & 0.01302 \tabularnewline
5 & -0.054645 & -0.4637 & 0.322137 \tabularnewline
6 & -0.054641 & -0.4636 & 0.322152 \tabularnewline
7 & 0.011584 & 0.0983 & 0.460987 \tabularnewline
8 & 0.225706 & 1.9152 & 0.029721 \tabularnewline
9 & 0.011239 & 0.0954 & 0.462143 \tabularnewline
10 & 0.050459 & 0.4282 & 0.334905 \tabularnewline
11 & -0.020836 & -0.1768 & 0.430082 \tabularnewline
12 & -0.013615 & -0.1155 & 0.454174 \tabularnewline
13 & 0.071516 & 0.6068 & 0.272936 \tabularnewline
14 & 0.041485 & 0.352 & 0.362928 \tabularnewline
15 & -0.02455 & -0.2083 & 0.417788 \tabularnewline
16 & -0.141321 & -1.1991 & 0.117201 \tabularnewline
17 & -0.225131 & -1.9103 & 0.030039 \tabularnewline
18 & 0.080599 & 0.6839 & 0.248114 \tabularnewline
19 & -0.080149 & -0.6801 & 0.249316 \tabularnewline
20 & -0.091479 & -0.7762 & 0.220079 \tabularnewline
21 & -0.017171 & -0.1457 & 0.442281 \tabularnewline
22 & -0.051518 & -0.4371 & 0.331656 \tabularnewline
23 & -0.070361 & -0.597 & 0.276181 \tabularnewline
24 & 0.116377 & 0.9875 & 0.163354 \tabularnewline
25 & -0.06439 & -0.5464 & 0.293252 \tabularnewline
26 & -0.028784 & -0.2442 & 0.403869 \tabularnewline
27 & -0.101557 & -0.8617 & 0.195845 \tabularnewline
28 & -0.147644 & -1.2528 & 0.107167 \tabularnewline
29 & -0.050884 & -0.4318 & 0.333602 \tabularnewline
30 & 0.119445 & 1.0135 & 0.157102 \tabularnewline
31 & 0.027466 & 0.2331 & 0.408188 \tabularnewline
32 & 0.013964 & 0.1185 & 0.453006 \tabularnewline
33 & -0.024446 & -0.2074 & 0.418129 \tabularnewline
34 & 0.100404 & 0.852 & 0.198532 \tabularnewline
35 & 0.032381 & 0.2748 & 0.392142 \tabularnewline
36 & -0.021937 & -0.1861 & 0.426429 \tabularnewline
37 & -0.023801 & -0.202 & 0.420261 \tabularnewline
38 & 0.100319 & 0.8512 & 0.19873 \tabularnewline
39 & 0.052408 & 0.4447 & 0.328935 \tabularnewline
40 & -0.133072 & -1.1291 & 0.131291 \tabularnewline
41 & -0.144598 & -1.227 & 0.111918 \tabularnewline
42 & 0.053064 & 0.4503 & 0.326937 \tabularnewline
43 & -0.050434 & -0.4279 & 0.334983 \tabularnewline
44 & 0.022819 & 0.1936 & 0.423508 \tabularnewline
45 & -0.00911 & -0.0773 & 0.469298 \tabularnewline
46 & -0.018283 & -0.1551 & 0.438575 \tabularnewline
47 & 0.07323 & 0.6214 & 0.268156 \tabularnewline
48 & -0.089423 & -0.7588 & 0.22523 \tabularnewline
\hline
\end{tabular}
%Source: https://freestatistics.org/blog/index.php?pk=120635&T=2

[TABLE]
[ROW][C]Partial Autocorrelation Function[/C][/ROW]
[ROW][C]Time lag k[/C][C]PACF(k)[/C][C]T-STAT[/C][C]P-value[/C][/ROW]
[ROW][C]1[/C][C]0.93594[/C][C]7.9417[/C][C]0[/C][/ROW]
[ROW][C]2[/C][C]-0.313921[/C][C]-2.6637[/C][C]0.004765[/C][/ROW]
[ROW][C]3[/C][C]0.039345[/C][C]0.3339[/C][C]0.36973[/C][/ROW]
[ROW][C]4[/C][C]-0.267822[/C][C]-2.2725[/C][C]0.01302[/C][/ROW]
[ROW][C]5[/C][C]-0.054645[/C][C]-0.4637[/C][C]0.322137[/C][/ROW]
[ROW][C]6[/C][C]-0.054641[/C][C]-0.4636[/C][C]0.322152[/C][/ROW]
[ROW][C]7[/C][C]0.011584[/C][C]0.0983[/C][C]0.460987[/C][/ROW]
[ROW][C]8[/C][C]0.225706[/C][C]1.9152[/C][C]0.029721[/C][/ROW]
[ROW][C]9[/C][C]0.011239[/C][C]0.0954[/C][C]0.462143[/C][/ROW]
[ROW][C]10[/C][C]0.050459[/C][C]0.4282[/C][C]0.334905[/C][/ROW]
[ROW][C]11[/C][C]-0.020836[/C][C]-0.1768[/C][C]0.430082[/C][/ROW]
[ROW][C]12[/C][C]-0.013615[/C][C]-0.1155[/C][C]0.454174[/C][/ROW]
[ROW][C]13[/C][C]0.071516[/C][C]0.6068[/C][C]0.272936[/C][/ROW]
[ROW][C]14[/C][C]0.041485[/C][C]0.352[/C][C]0.362928[/C][/ROW]
[ROW][C]15[/C][C]-0.02455[/C][C]-0.2083[/C][C]0.417788[/C][/ROW]
[ROW][C]16[/C][C]-0.141321[/C][C]-1.1991[/C][C]0.117201[/C][/ROW]
[ROW][C]17[/C][C]-0.225131[/C][C]-1.9103[/C][C]0.030039[/C][/ROW]
[ROW][C]18[/C][C]0.080599[/C][C]0.6839[/C][C]0.248114[/C][/ROW]
[ROW][C]19[/C][C]-0.080149[/C][C]-0.6801[/C][C]0.249316[/C][/ROW]
[ROW][C]20[/C][C]-0.091479[/C][C]-0.7762[/C][C]0.220079[/C][/ROW]
[ROW][C]21[/C][C]-0.017171[/C][C]-0.1457[/C][C]0.442281[/C][/ROW]
[ROW][C]22[/C][C]-0.051518[/C][C]-0.4371[/C][C]0.331656[/C][/ROW]
[ROW][C]23[/C][C]-0.070361[/C][C]-0.597[/C][C]0.276181[/C][/ROW]
[ROW][C]24[/C][C]0.116377[/C][C]0.9875[/C][C]0.163354[/C][/ROW]
[ROW][C]25[/C][C]-0.06439[/C][C]-0.5464[/C][C]0.293252[/C][/ROW]
[ROW][C]26[/C][C]-0.028784[/C][C]-0.2442[/C][C]0.403869[/C][/ROW]
[ROW][C]27[/C][C]-0.101557[/C][C]-0.8617[/C][C]0.195845[/C][/ROW]
[ROW][C]28[/C][C]-0.147644[/C][C]-1.2528[/C][C]0.107167[/C][/ROW]
[ROW][C]29[/C][C]-0.050884[/C][C]-0.4318[/C][C]0.333602[/C][/ROW]
[ROW][C]30[/C][C]0.119445[/C][C]1.0135[/C][C]0.157102[/C][/ROW]
[ROW][C]31[/C][C]0.027466[/C][C]0.2331[/C][C]0.408188[/C][/ROW]
[ROW][C]32[/C][C]0.013964[/C][C]0.1185[/C][C]0.453006[/C][/ROW]
[ROW][C]33[/C][C]-0.024446[/C][C]-0.2074[/C][C]0.418129[/C][/ROW]
[ROW][C]34[/C][C]0.100404[/C][C]0.852[/C][C]0.198532[/C][/ROW]
[ROW][C]35[/C][C]0.032381[/C][C]0.2748[/C][C]0.392142[/C][/ROW]
[ROW][C]36[/C][C]-0.021937[/C][C]-0.1861[/C][C]0.426429[/C][/ROW]
[ROW][C]37[/C][C]-0.023801[/C][C]-0.202[/C][C]0.420261[/C][/ROW]
[ROW][C]38[/C][C]0.100319[/C][C]0.8512[/C][C]0.19873[/C][/ROW]
[ROW][C]39[/C][C]0.052408[/C][C]0.4447[/C][C]0.328935[/C][/ROW]
[ROW][C]40[/C][C]-0.133072[/C][C]-1.1291[/C][C]0.131291[/C][/ROW]
[ROW][C]41[/C][C]-0.144598[/C][C]-1.227[/C][C]0.111918[/C][/ROW]
[ROW][C]42[/C][C]0.053064[/C][C]0.4503[/C][C]0.326937[/C][/ROW]
[ROW][C]43[/C][C]-0.050434[/C][C]-0.4279[/C][C]0.334983[/C][/ROW]
[ROW][C]44[/C][C]0.022819[/C][C]0.1936[/C][C]0.423508[/C][/ROW]
[ROW][C]45[/C][C]-0.00911[/C][C]-0.0773[/C][C]0.469298[/C][/ROW]
[ROW][C]46[/C][C]-0.018283[/C][C]-0.1551[/C][C]0.438575[/C][/ROW]
[ROW][C]47[/C][C]0.07323[/C][C]0.6214[/C][C]0.268156[/C][/ROW]
[ROW][C]48[/C][C]-0.089423[/C][C]-0.7588[/C][C]0.22523[/C][/ROW]
[/TABLE]
Source: https://freestatistics.org/blog/index.php?pk=120635&T=2

Globally Unique Identifier (entire table): ba.freestatistics.org/blog/index.php?pk=120635&T=2

As an alternative you can also use a QR Code:  

The GUIDs for individual cells are displayed in the table below:

Partial Autocorrelation Function
Time lag kPACF(k)T-STATP-value
10.935947.94170
2-0.313921-2.66370.004765
30.0393450.33390.36973
4-0.267822-2.27250.01302
5-0.054645-0.46370.322137
6-0.054641-0.46360.322152
70.0115840.09830.460987
80.2257061.91520.029721
90.0112390.09540.462143
100.0504590.42820.334905
11-0.020836-0.17680.430082
12-0.013615-0.11550.454174
130.0715160.60680.272936
140.0414850.3520.362928
15-0.02455-0.20830.417788
16-0.141321-1.19910.117201
17-0.225131-1.91030.030039
180.0805990.68390.248114
19-0.080149-0.68010.249316
20-0.091479-0.77620.220079
21-0.017171-0.14570.442281
22-0.051518-0.43710.331656
23-0.070361-0.5970.276181
240.1163770.98750.163354
25-0.06439-0.54640.293252
26-0.028784-0.24420.403869
27-0.101557-0.86170.195845
28-0.147644-1.25280.107167
29-0.050884-0.43180.333602
300.1194451.01350.157102
310.0274660.23310.408188
320.0139640.11850.453006
33-0.024446-0.20740.418129
340.1004040.8520.198532
350.0323810.27480.392142
36-0.021937-0.18610.426429
37-0.023801-0.2020.420261
380.1003190.85120.19873
390.0524080.44470.328935
40-0.133072-1.12910.131291
41-0.144598-1.2270.111918
420.0530640.45030.326937
43-0.050434-0.42790.334983
440.0228190.19360.423508
45-0.00911-0.07730.469298
46-0.018283-0.15510.438575
470.073230.62140.268156
48-0.089423-0.75880.22523


Parameters (Session):
par1 = 48 ; par2 = 1 ; par3 = 0 ; par4 = 0 ; par5 = 12 ; par6 = White Noise ; par7 = 0.95 ;
Parameters (R input):
par1 = 48 ; par2 = 1 ; par3 = 0 ; par4 = 0 ; par5 = 12 ; par6 = White Noise ; par7 = 0.95 ; par8 = ;
R code (references can be found in the software module):
if (par1 == 'Default') {
par1 = 10*log10(length(x))
} else {
par1 <- as.numeric(par1)
}
par2 <- as.numeric(par2)
par3 <- as.numeric(par3)
par4 <- as.numeric(par4)
par5 <- as.numeric(par5)
if (par6 == 'White Noise') par6 <- 'white' else par6 <- 'ma'
par7 <- as.numeric(par7)
if (par8 != '') par8 <- as.numeric(par8)
ox <- x
if (par8 == '') {
if (par2 == 0) {
x <- log(x)
} else {
x <- (x ^ par2 - 1) / par2
}
} else {
x <- log(x,base=par8)
}
if (par3 > 0) x <- diff(x,lag=1,difference=par3)
if (par4 > 0) x <- diff(x,lag=par5,difference=par4)
bitmap(file='picts.png')
op <- par(mfrow=c(2,1))
plot(ox,type='l',main='Original Time Series',xlab='time',ylab='value')
if (par8=='') {
mytitle <- paste('Working Time Series (lambda=',par2,', d=',par3,', D=',par4,')',sep='')
mysub <- paste('(lambda=',par2,', d=',par3,', D=',par4,', CI=', par7, ', CI type=',par6,')',sep='')
} else {
mytitle <- paste('Working Time Series (base=',par8,', d=',par3,', D=',par4,')',sep='')
mysub <- paste('(base=',par8,', d=',par3,', D=',par4,', CI=', par7, ', CI type=',par6,')',sep='')
}
plot(x,type='l', main=mytitle,xlab='time',ylab='value')
par(op)
dev.off()
bitmap(file='pic1.png')
racf <- acf(x, par1, main='Autocorrelation', xlab='time lag', ylab='ACF', ci.type=par6, ci=par7, sub=mysub)
dev.off()
bitmap(file='pic2.png')
rpacf <- pacf(x,par1,main='Partial Autocorrelation',xlab='lags',ylab='PACF',sub=mysub)
dev.off()
(myacf <- c(racf$acf))
(mypacf <- c(rpacf$acf))
lengthx <- length(x)
sqrtn <- sqrt(lengthx)
load(file='createtable')
a<-table.start()
a<-table.row.start(a)
a<-table.element(a,'Autocorrelation Function',4,TRUE)
a<-table.row.end(a)
a<-table.row.start(a)
a<-table.element(a,'Time lag k',header=TRUE)
a<-table.element(a,hyperlink('basics.htm','ACF(k)','click here for more information about the Autocorrelation Function'),header=TRUE)
a<-table.element(a,'T-STAT',header=TRUE)
a<-table.element(a,'P-value',header=TRUE)
a<-table.row.end(a)
for (i in 2:(par1+1)) {
a<-table.row.start(a)
a<-table.element(a,i-1,header=TRUE)
a<-table.element(a,round(myacf[i],6))
mytstat <- myacf[i]*sqrtn
a<-table.element(a,round(mytstat,4))
a<-table.element(a,round(1-pt(abs(mytstat),lengthx),6))
a<-table.row.end(a)
}
a<-table.end(a)
table.save(a,file='mytable.tab')
a<-table.start()
a<-table.row.start(a)
a<-table.element(a,'Partial Autocorrelation Function',4,TRUE)
a<-table.row.end(a)
a<-table.row.start(a)
a<-table.element(a,'Time lag k',header=TRUE)
a<-table.element(a,hyperlink('basics.htm','PACF(k)','click here for more information about the Partial Autocorrelation Function'),header=TRUE)
a<-table.element(a,'T-STAT',header=TRUE)
a<-table.element(a,'P-value',header=TRUE)
a<-table.row.end(a)
for (i in 1:par1) {
a<-table.row.start(a)
a<-table.element(a,i,header=TRUE)
a<-table.element(a,round(mypacf[i],6))
mytstat <- mypacf[i]*sqrtn
a<-table.element(a,round(mytstat,4))
a<-table.element(a,round(1-pt(abs(mytstat),lengthx),6))
a<-table.row.end(a)
}
a<-table.end(a)
table.save(a,file='mytable1.tab')