Free Statistics

of Irreproducible Research!

Author's title

Author*Unverified author*
R Software Modulerwasp_autocorrelation.wasp
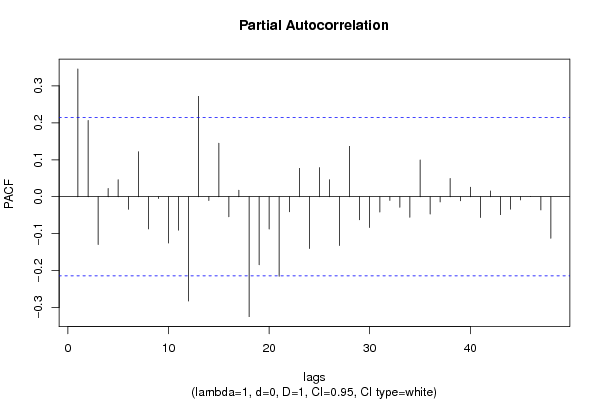
Title produced by software(Partial) Autocorrelation Function
Date of computationMon, 25 Apr 2011 14:34:40 +0000
Cite this page as followsStatistical Computations at FreeStatistics.org, Office for Research Development and Education, URL https://freestatistics.org/blog/index.php?v=date/2011/Apr/25/t1303741957l8dh1uurr7iot8o.htm/, Retrieved Wed, 08 May 2024 11:06:44 +0000
Statistical Computations at FreeStatistics.org, Office for Research Development and Education, URL https://freestatistics.org/blog/index.php?pk=120630, Retrieved Wed, 08 May 2024 11:06:44 +0000
QR Codes:

Original text written by user:
IsPrivate?No (this computation is public)
User-defined keywordsKDGP2W12
Estimated Impact195
Family? (F = Feedback message, R = changed R code, M = changed R Module, P = changed Parameters, D = changed Data)
-       [(Partial) Autocorrelation Function] [Time series analy...] [2011-04-25 14:34:40] [fc42f3d005062709f652b08fadb3432c] [Current]
Feedback Forum

Post a new message
Dataseries X:
600
425
398
582
458
455
621
635
589
220
351
379
683
524
536
598
581
632
645
722
689
645
354
486
423
479
684
601
608
463
602
485
563
645
486
435
479
579
563
202
389
467
466
706
546
689
531
528
579
684
651
637
548
496
582
467
693
615
708
648
899
852
745
689
582
674
684
542
489
472
398
486
549
766
654
628
689
648
578
536
548
496
475
687
642
584
596
609
678
694
485
489
537
706
489
598


Summary of computational transaction
Raw Inputview raw input (R code)
Raw Outputview raw output of R engine
Computing time2 seconds
R Server'RServer@AstonUniversity' @ vre.aston.ac.uk

\begin{tabular}{lllllllll}
\hline
Summary of computational transaction \tabularnewline
Raw Input & view raw input (R code)  \tabularnewline
Raw Output & view raw output of R engine  \tabularnewline
Computing time & 2 seconds \tabularnewline
R Server & 'RServer@AstonUniversity' @ vre.aston.ac.uk \tabularnewline
\hline
\end{tabular}
%Source: https://freestatistics.org/blog/index.php?pk=120630&T=0

[TABLE]
[ROW][C]Summary of computational transaction[/C][/ROW]
[ROW][C]Raw Input[/C][C]view raw input (R code) [/C][/ROW]
[ROW][C]Raw Output[/C][C]view raw output of R engine [/C][/ROW]
[ROW][C]Computing time[/C][C]2 seconds[/C][/ROW]
[ROW][C]R Server[/C][C]'RServer@AstonUniversity' @ vre.aston.ac.uk[/C][/ROW]
[/TABLE]
Source: https://freestatistics.org/blog/index.php?pk=120630&T=0

Globally Unique Identifier (entire table): ba.freestatistics.org/blog/index.php?pk=120630&T=0

As an alternative you can also use a QR Code:  

The GUIDs for individual cells are displayed in the table below:

Summary of computational transaction
Raw Inputview raw input (R code)
Raw Outputview raw output of R engine
Computing time2 seconds
R Server'RServer@AstonUniversity' @ vre.aston.ac.uk


Autocorrelation Function
Time lag kACF(k)T-STATP-value
10.34583.16930.001066
20.3013042.76150.003533
30.0449430.41190.340726
40.0600630.55050.291722
50.0336920.30880.379123
60.0086920.07970.468347
70.1085080.99450.16142
8-0.016293-0.14930.440825
90.0292410.2680.39468
10-0.135056-1.23780.109618
11-0.131629-1.20640.115525
12-0.354437-3.24850.000834
13-0.018262-0.16740.433738
14-0.068029-0.62350.267323
150.1454741.33330.093021
160.0310830.28490.388218
170.0429810.39390.347316
18-0.182742-1.67490.04884
19-0.327501-3.00160.001768
20-0.213724-1.95880.026726
21-0.353516-3.240.000857
22-0.126103-1.15580.125529
23-0.133782-1.22610.111788
24-0.039248-0.35970.359983
25-0.14975-1.37250.086784
26-0.077574-0.7110.239534
27-0.199391-1.82750.035591
28-0.005792-0.05310.478895
29-0.030852-0.28280.389026
300.1761361.61430.055105
310.1730261.58580.05827
320.136911.25480.106516
330.2027231.8580.033337
34-0.059599-0.54620.293176
350.0544760.49930.309443
36-0.080823-0.74080.230453
370.0902580.82720.205226
380.037360.34240.366448
390.1917631.75750.041234
400.1467591.34510.091111
410.0740550.67870.24959
420.0623820.57170.284512
430.0465540.42670.335353
440.0363880.33350.369794
450.0647850.59380.277134
460.1698121.55640.061692
470.0414840.38020.352375
480.054790.50220.308434

\begin{tabular}{lllllllll}
\hline
Autocorrelation Function \tabularnewline
Time lag k & ACF(k) & T-STAT & P-value \tabularnewline
1 & 0.3458 & 3.1693 & 0.001066 \tabularnewline
2 & 0.301304 & 2.7615 & 0.003533 \tabularnewline
3 & 0.044943 & 0.4119 & 0.340726 \tabularnewline
4 & 0.060063 & 0.5505 & 0.291722 \tabularnewline
5 & 0.033692 & 0.3088 & 0.379123 \tabularnewline
6 & 0.008692 & 0.0797 & 0.468347 \tabularnewline
7 & 0.108508 & 0.9945 & 0.16142 \tabularnewline
8 & -0.016293 & -0.1493 & 0.440825 \tabularnewline
9 & 0.029241 & 0.268 & 0.39468 \tabularnewline
10 & -0.135056 & -1.2378 & 0.109618 \tabularnewline
11 & -0.131629 & -1.2064 & 0.115525 \tabularnewline
12 & -0.354437 & -3.2485 & 0.000834 \tabularnewline
13 & -0.018262 & -0.1674 & 0.433738 \tabularnewline
14 & -0.068029 & -0.6235 & 0.267323 \tabularnewline
15 & 0.145474 & 1.3333 & 0.093021 \tabularnewline
16 & 0.031083 & 0.2849 & 0.388218 \tabularnewline
17 & 0.042981 & 0.3939 & 0.347316 \tabularnewline
18 & -0.182742 & -1.6749 & 0.04884 \tabularnewline
19 & -0.327501 & -3.0016 & 0.001768 \tabularnewline
20 & -0.213724 & -1.9588 & 0.026726 \tabularnewline
21 & -0.353516 & -3.24 & 0.000857 \tabularnewline
22 & -0.126103 & -1.1558 & 0.125529 \tabularnewline
23 & -0.133782 & -1.2261 & 0.111788 \tabularnewline
24 & -0.039248 & -0.3597 & 0.359983 \tabularnewline
25 & -0.14975 & -1.3725 & 0.086784 \tabularnewline
26 & -0.077574 & -0.711 & 0.239534 \tabularnewline
27 & -0.199391 & -1.8275 & 0.035591 \tabularnewline
28 & -0.005792 & -0.0531 & 0.478895 \tabularnewline
29 & -0.030852 & -0.2828 & 0.389026 \tabularnewline
30 & 0.176136 & 1.6143 & 0.055105 \tabularnewline
31 & 0.173026 & 1.5858 & 0.05827 \tabularnewline
32 & 0.13691 & 1.2548 & 0.106516 \tabularnewline
33 & 0.202723 & 1.858 & 0.033337 \tabularnewline
34 & -0.059599 & -0.5462 & 0.293176 \tabularnewline
35 & 0.054476 & 0.4993 & 0.309443 \tabularnewline
36 & -0.080823 & -0.7408 & 0.230453 \tabularnewline
37 & 0.090258 & 0.8272 & 0.205226 \tabularnewline
38 & 0.03736 & 0.3424 & 0.366448 \tabularnewline
39 & 0.191763 & 1.7575 & 0.041234 \tabularnewline
40 & 0.146759 & 1.3451 & 0.091111 \tabularnewline
41 & 0.074055 & 0.6787 & 0.24959 \tabularnewline
42 & 0.062382 & 0.5717 & 0.284512 \tabularnewline
43 & 0.046554 & 0.4267 & 0.335353 \tabularnewline
44 & 0.036388 & 0.3335 & 0.369794 \tabularnewline
45 & 0.064785 & 0.5938 & 0.277134 \tabularnewline
46 & 0.169812 & 1.5564 & 0.061692 \tabularnewline
47 & 0.041484 & 0.3802 & 0.352375 \tabularnewline
48 & 0.05479 & 0.5022 & 0.308434 \tabularnewline
\hline
\end{tabular}
%Source: https://freestatistics.org/blog/index.php?pk=120630&T=1

[TABLE]
[ROW][C]Autocorrelation Function[/C][/ROW]
[ROW][C]Time lag k[/C][C]ACF(k)[/C][C]T-STAT[/C][C]P-value[/C][/ROW]
[ROW][C]1[/C][C]0.3458[/C][C]3.1693[/C][C]0.001066[/C][/ROW]
[ROW][C]2[/C][C]0.301304[/C][C]2.7615[/C][C]0.003533[/C][/ROW]
[ROW][C]3[/C][C]0.044943[/C][C]0.4119[/C][C]0.340726[/C][/ROW]
[ROW][C]4[/C][C]0.060063[/C][C]0.5505[/C][C]0.291722[/C][/ROW]
[ROW][C]5[/C][C]0.033692[/C][C]0.3088[/C][C]0.379123[/C][/ROW]
[ROW][C]6[/C][C]0.008692[/C][C]0.0797[/C][C]0.468347[/C][/ROW]
[ROW][C]7[/C][C]0.108508[/C][C]0.9945[/C][C]0.16142[/C][/ROW]
[ROW][C]8[/C][C]-0.016293[/C][C]-0.1493[/C][C]0.440825[/C][/ROW]
[ROW][C]9[/C][C]0.029241[/C][C]0.268[/C][C]0.39468[/C][/ROW]
[ROW][C]10[/C][C]-0.135056[/C][C]-1.2378[/C][C]0.109618[/C][/ROW]
[ROW][C]11[/C][C]-0.131629[/C][C]-1.2064[/C][C]0.115525[/C][/ROW]
[ROW][C]12[/C][C]-0.354437[/C][C]-3.2485[/C][C]0.000834[/C][/ROW]
[ROW][C]13[/C][C]-0.018262[/C][C]-0.1674[/C][C]0.433738[/C][/ROW]
[ROW][C]14[/C][C]-0.068029[/C][C]-0.6235[/C][C]0.267323[/C][/ROW]
[ROW][C]15[/C][C]0.145474[/C][C]1.3333[/C][C]0.093021[/C][/ROW]
[ROW][C]16[/C][C]0.031083[/C][C]0.2849[/C][C]0.388218[/C][/ROW]
[ROW][C]17[/C][C]0.042981[/C][C]0.3939[/C][C]0.347316[/C][/ROW]
[ROW][C]18[/C][C]-0.182742[/C][C]-1.6749[/C][C]0.04884[/C][/ROW]
[ROW][C]19[/C][C]-0.327501[/C][C]-3.0016[/C][C]0.001768[/C][/ROW]
[ROW][C]20[/C][C]-0.213724[/C][C]-1.9588[/C][C]0.026726[/C][/ROW]
[ROW][C]21[/C][C]-0.353516[/C][C]-3.24[/C][C]0.000857[/C][/ROW]
[ROW][C]22[/C][C]-0.126103[/C][C]-1.1558[/C][C]0.125529[/C][/ROW]
[ROW][C]23[/C][C]-0.133782[/C][C]-1.2261[/C][C]0.111788[/C][/ROW]
[ROW][C]24[/C][C]-0.039248[/C][C]-0.3597[/C][C]0.359983[/C][/ROW]
[ROW][C]25[/C][C]-0.14975[/C][C]-1.3725[/C][C]0.086784[/C][/ROW]
[ROW][C]26[/C][C]-0.077574[/C][C]-0.711[/C][C]0.239534[/C][/ROW]
[ROW][C]27[/C][C]-0.199391[/C][C]-1.8275[/C][C]0.035591[/C][/ROW]
[ROW][C]28[/C][C]-0.005792[/C][C]-0.0531[/C][C]0.478895[/C][/ROW]
[ROW][C]29[/C][C]-0.030852[/C][C]-0.2828[/C][C]0.389026[/C][/ROW]
[ROW][C]30[/C][C]0.176136[/C][C]1.6143[/C][C]0.055105[/C][/ROW]
[ROW][C]31[/C][C]0.173026[/C][C]1.5858[/C][C]0.05827[/C][/ROW]
[ROW][C]32[/C][C]0.13691[/C][C]1.2548[/C][C]0.106516[/C][/ROW]
[ROW][C]33[/C][C]0.202723[/C][C]1.858[/C][C]0.033337[/C][/ROW]
[ROW][C]34[/C][C]-0.059599[/C][C]-0.5462[/C][C]0.293176[/C][/ROW]
[ROW][C]35[/C][C]0.054476[/C][C]0.4993[/C][C]0.309443[/C][/ROW]
[ROW][C]36[/C][C]-0.080823[/C][C]-0.7408[/C][C]0.230453[/C][/ROW]
[ROW][C]37[/C][C]0.090258[/C][C]0.8272[/C][C]0.205226[/C][/ROW]
[ROW][C]38[/C][C]0.03736[/C][C]0.3424[/C][C]0.366448[/C][/ROW]
[ROW][C]39[/C][C]0.191763[/C][C]1.7575[/C][C]0.041234[/C][/ROW]
[ROW][C]40[/C][C]0.146759[/C][C]1.3451[/C][C]0.091111[/C][/ROW]
[ROW][C]41[/C][C]0.074055[/C][C]0.6787[/C][C]0.24959[/C][/ROW]
[ROW][C]42[/C][C]0.062382[/C][C]0.5717[/C][C]0.284512[/C][/ROW]
[ROW][C]43[/C][C]0.046554[/C][C]0.4267[/C][C]0.335353[/C][/ROW]
[ROW][C]44[/C][C]0.036388[/C][C]0.3335[/C][C]0.369794[/C][/ROW]
[ROW][C]45[/C][C]0.064785[/C][C]0.5938[/C][C]0.277134[/C][/ROW]
[ROW][C]46[/C][C]0.169812[/C][C]1.5564[/C][C]0.061692[/C][/ROW]
[ROW][C]47[/C][C]0.041484[/C][C]0.3802[/C][C]0.352375[/C][/ROW]
[ROW][C]48[/C][C]0.05479[/C][C]0.5022[/C][C]0.308434[/C][/ROW]
[/TABLE]
Source: https://freestatistics.org/blog/index.php?pk=120630&T=1

Globally Unique Identifier (entire table): ba.freestatistics.org/blog/index.php?pk=120630&T=1

As an alternative you can also use a QR Code:  

The GUIDs for individual cells are displayed in the table below:

Autocorrelation Function
Time lag kACF(k)T-STATP-value
10.34583.16930.001066
20.3013042.76150.003533
30.0449430.41190.340726
40.0600630.55050.291722
50.0336920.30880.379123
60.0086920.07970.468347
70.1085080.99450.16142
8-0.016293-0.14930.440825
90.0292410.2680.39468
10-0.135056-1.23780.109618
11-0.131629-1.20640.115525
12-0.354437-3.24850.000834
13-0.018262-0.16740.433738
14-0.068029-0.62350.267323
150.1454741.33330.093021
160.0310830.28490.388218
170.0429810.39390.347316
18-0.182742-1.67490.04884
19-0.327501-3.00160.001768
20-0.213724-1.95880.026726
21-0.353516-3.240.000857
22-0.126103-1.15580.125529
23-0.133782-1.22610.111788
24-0.039248-0.35970.359983
25-0.14975-1.37250.086784
26-0.077574-0.7110.239534
27-0.199391-1.82750.035591
28-0.005792-0.05310.478895
29-0.030852-0.28280.389026
300.1761361.61430.055105
310.1730261.58580.05827
320.136911.25480.106516
330.2027231.8580.033337
34-0.059599-0.54620.293176
350.0544760.49930.309443
36-0.080823-0.74080.230453
370.0902580.82720.205226
380.037360.34240.366448
390.1917631.75750.041234
400.1467591.34510.091111
410.0740550.67870.24959
420.0623820.57170.284512
430.0465540.42670.335353
440.0363880.33350.369794
450.0647850.59380.277134
460.1698121.55640.061692
470.0414840.38020.352375
480.054790.50220.308434


Partial Autocorrelation Function
Time lag kPACF(k)T-STATP-value
10.34583.16930.001066
20.2064081.89180.030984
3-0.129453-1.18650.119393
40.0221990.20350.419634
50.0460440.4220.337051
6-0.033736-0.30920.37897
70.1220511.11860.133247
8-0.087027-0.79760.213671
9-0.004691-0.0430.482905
10-0.12537-1.1490.126901
11-0.090433-0.82880.204774
12-0.282244-2.58680.005705
130.2716992.49020.00737
14-0.010304-0.09440.462494
150.144931.32830.093838
16-0.0544-0.49860.309687
170.017450.15990.436661
18-0.324462-2.97370.001919
19-0.184088-1.68720.047638
20-0.087606-0.80290.212142
21-0.215427-1.97440.02581
22-0.04073-0.37330.354936
230.0768810.70460.241496
24-0.139906-1.28230.101639
250.0788580.72270.235921
260.0462290.42370.336436
27-0.131847-1.20840.115143
280.1363891.250.10738
29-0.062564-0.57340.28395
30-0.083301-0.76350.223663
31-0.041354-0.3790.352816
32-0.009959-0.09130.463747
33-0.028424-0.26050.397553
34-0.055441-0.50810.306349
350.0993020.91010.182682
36-0.04687-0.42960.334304
37-0.014038-0.12870.448967
380.049580.45440.325354
39-0.010686-0.09790.461106
400.0255130.23380.407843
41-0.056081-0.5140.304304
420.0156320.14330.443209
43-0.048417-0.44370.329183
44-0.033584-0.30780.379498
45-0.008583-0.07870.468743
460.0002350.00220.499142
47-0.035638-0.32660.37238
48-0.112201-1.02830.153371

\begin{tabular}{lllllllll}
\hline
Partial Autocorrelation Function \tabularnewline
Time lag k & PACF(k) & T-STAT & P-value \tabularnewline
1 & 0.3458 & 3.1693 & 0.001066 \tabularnewline
2 & 0.206408 & 1.8918 & 0.030984 \tabularnewline
3 & -0.129453 & -1.1865 & 0.119393 \tabularnewline
4 & 0.022199 & 0.2035 & 0.419634 \tabularnewline
5 & 0.046044 & 0.422 & 0.337051 \tabularnewline
6 & -0.033736 & -0.3092 & 0.37897 \tabularnewline
7 & 0.122051 & 1.1186 & 0.133247 \tabularnewline
8 & -0.087027 & -0.7976 & 0.213671 \tabularnewline
9 & -0.004691 & -0.043 & 0.482905 \tabularnewline
10 & -0.12537 & -1.149 & 0.126901 \tabularnewline
11 & -0.090433 & -0.8288 & 0.204774 \tabularnewline
12 & -0.282244 & -2.5868 & 0.005705 \tabularnewline
13 & 0.271699 & 2.4902 & 0.00737 \tabularnewline
14 & -0.010304 & -0.0944 & 0.462494 \tabularnewline
15 & 0.14493 & 1.3283 & 0.093838 \tabularnewline
16 & -0.0544 & -0.4986 & 0.309687 \tabularnewline
17 & 0.01745 & 0.1599 & 0.436661 \tabularnewline
18 & -0.324462 & -2.9737 & 0.001919 \tabularnewline
19 & -0.184088 & -1.6872 & 0.047638 \tabularnewline
20 & -0.087606 & -0.8029 & 0.212142 \tabularnewline
21 & -0.215427 & -1.9744 & 0.02581 \tabularnewline
22 & -0.04073 & -0.3733 & 0.354936 \tabularnewline
23 & 0.076881 & 0.7046 & 0.241496 \tabularnewline
24 & -0.139906 & -1.2823 & 0.101639 \tabularnewline
25 & 0.078858 & 0.7227 & 0.235921 \tabularnewline
26 & 0.046229 & 0.4237 & 0.336436 \tabularnewline
27 & -0.131847 & -1.2084 & 0.115143 \tabularnewline
28 & 0.136389 & 1.25 & 0.10738 \tabularnewline
29 & -0.062564 & -0.5734 & 0.28395 \tabularnewline
30 & -0.083301 & -0.7635 & 0.223663 \tabularnewline
31 & -0.041354 & -0.379 & 0.352816 \tabularnewline
32 & -0.009959 & -0.0913 & 0.463747 \tabularnewline
33 & -0.028424 & -0.2605 & 0.397553 \tabularnewline
34 & -0.055441 & -0.5081 & 0.306349 \tabularnewline
35 & 0.099302 & 0.9101 & 0.182682 \tabularnewline
36 & -0.04687 & -0.4296 & 0.334304 \tabularnewline
37 & -0.014038 & -0.1287 & 0.448967 \tabularnewline
38 & 0.04958 & 0.4544 & 0.325354 \tabularnewline
39 & -0.010686 & -0.0979 & 0.461106 \tabularnewline
40 & 0.025513 & 0.2338 & 0.407843 \tabularnewline
41 & -0.056081 & -0.514 & 0.304304 \tabularnewline
42 & 0.015632 & 0.1433 & 0.443209 \tabularnewline
43 & -0.048417 & -0.4437 & 0.329183 \tabularnewline
44 & -0.033584 & -0.3078 & 0.379498 \tabularnewline
45 & -0.008583 & -0.0787 & 0.468743 \tabularnewline
46 & 0.000235 & 0.0022 & 0.499142 \tabularnewline
47 & -0.035638 & -0.3266 & 0.37238 \tabularnewline
48 & -0.112201 & -1.0283 & 0.153371 \tabularnewline
\hline
\end{tabular}
%Source: https://freestatistics.org/blog/index.php?pk=120630&T=2

[TABLE]
[ROW][C]Partial Autocorrelation Function[/C][/ROW]
[ROW][C]Time lag k[/C][C]PACF(k)[/C][C]T-STAT[/C][C]P-value[/C][/ROW]
[ROW][C]1[/C][C]0.3458[/C][C]3.1693[/C][C]0.001066[/C][/ROW]
[ROW][C]2[/C][C]0.206408[/C][C]1.8918[/C][C]0.030984[/C][/ROW]
[ROW][C]3[/C][C]-0.129453[/C][C]-1.1865[/C][C]0.119393[/C][/ROW]
[ROW][C]4[/C][C]0.022199[/C][C]0.2035[/C][C]0.419634[/C][/ROW]
[ROW][C]5[/C][C]0.046044[/C][C]0.422[/C][C]0.337051[/C][/ROW]
[ROW][C]6[/C][C]-0.033736[/C][C]-0.3092[/C][C]0.37897[/C][/ROW]
[ROW][C]7[/C][C]0.122051[/C][C]1.1186[/C][C]0.133247[/C][/ROW]
[ROW][C]8[/C][C]-0.087027[/C][C]-0.7976[/C][C]0.213671[/C][/ROW]
[ROW][C]9[/C][C]-0.004691[/C][C]-0.043[/C][C]0.482905[/C][/ROW]
[ROW][C]10[/C][C]-0.12537[/C][C]-1.149[/C][C]0.126901[/C][/ROW]
[ROW][C]11[/C][C]-0.090433[/C][C]-0.8288[/C][C]0.204774[/C][/ROW]
[ROW][C]12[/C][C]-0.282244[/C][C]-2.5868[/C][C]0.005705[/C][/ROW]
[ROW][C]13[/C][C]0.271699[/C][C]2.4902[/C][C]0.00737[/C][/ROW]
[ROW][C]14[/C][C]-0.010304[/C][C]-0.0944[/C][C]0.462494[/C][/ROW]
[ROW][C]15[/C][C]0.14493[/C][C]1.3283[/C][C]0.093838[/C][/ROW]
[ROW][C]16[/C][C]-0.0544[/C][C]-0.4986[/C][C]0.309687[/C][/ROW]
[ROW][C]17[/C][C]0.01745[/C][C]0.1599[/C][C]0.436661[/C][/ROW]
[ROW][C]18[/C][C]-0.324462[/C][C]-2.9737[/C][C]0.001919[/C][/ROW]
[ROW][C]19[/C][C]-0.184088[/C][C]-1.6872[/C][C]0.047638[/C][/ROW]
[ROW][C]20[/C][C]-0.087606[/C][C]-0.8029[/C][C]0.212142[/C][/ROW]
[ROW][C]21[/C][C]-0.215427[/C][C]-1.9744[/C][C]0.02581[/C][/ROW]
[ROW][C]22[/C][C]-0.04073[/C][C]-0.3733[/C][C]0.354936[/C][/ROW]
[ROW][C]23[/C][C]0.076881[/C][C]0.7046[/C][C]0.241496[/C][/ROW]
[ROW][C]24[/C][C]-0.139906[/C][C]-1.2823[/C][C]0.101639[/C][/ROW]
[ROW][C]25[/C][C]0.078858[/C][C]0.7227[/C][C]0.235921[/C][/ROW]
[ROW][C]26[/C][C]0.046229[/C][C]0.4237[/C][C]0.336436[/C][/ROW]
[ROW][C]27[/C][C]-0.131847[/C][C]-1.2084[/C][C]0.115143[/C][/ROW]
[ROW][C]28[/C][C]0.136389[/C][C]1.25[/C][C]0.10738[/C][/ROW]
[ROW][C]29[/C][C]-0.062564[/C][C]-0.5734[/C][C]0.28395[/C][/ROW]
[ROW][C]30[/C][C]-0.083301[/C][C]-0.7635[/C][C]0.223663[/C][/ROW]
[ROW][C]31[/C][C]-0.041354[/C][C]-0.379[/C][C]0.352816[/C][/ROW]
[ROW][C]32[/C][C]-0.009959[/C][C]-0.0913[/C][C]0.463747[/C][/ROW]
[ROW][C]33[/C][C]-0.028424[/C][C]-0.2605[/C][C]0.397553[/C][/ROW]
[ROW][C]34[/C][C]-0.055441[/C][C]-0.5081[/C][C]0.306349[/C][/ROW]
[ROW][C]35[/C][C]0.099302[/C][C]0.9101[/C][C]0.182682[/C][/ROW]
[ROW][C]36[/C][C]-0.04687[/C][C]-0.4296[/C][C]0.334304[/C][/ROW]
[ROW][C]37[/C][C]-0.014038[/C][C]-0.1287[/C][C]0.448967[/C][/ROW]
[ROW][C]38[/C][C]0.04958[/C][C]0.4544[/C][C]0.325354[/C][/ROW]
[ROW][C]39[/C][C]-0.010686[/C][C]-0.0979[/C][C]0.461106[/C][/ROW]
[ROW][C]40[/C][C]0.025513[/C][C]0.2338[/C][C]0.407843[/C][/ROW]
[ROW][C]41[/C][C]-0.056081[/C][C]-0.514[/C][C]0.304304[/C][/ROW]
[ROW][C]42[/C][C]0.015632[/C][C]0.1433[/C][C]0.443209[/C][/ROW]
[ROW][C]43[/C][C]-0.048417[/C][C]-0.4437[/C][C]0.329183[/C][/ROW]
[ROW][C]44[/C][C]-0.033584[/C][C]-0.3078[/C][C]0.379498[/C][/ROW]
[ROW][C]45[/C][C]-0.008583[/C][C]-0.0787[/C][C]0.468743[/C][/ROW]
[ROW][C]46[/C][C]0.000235[/C][C]0.0022[/C][C]0.499142[/C][/ROW]
[ROW][C]47[/C][C]-0.035638[/C][C]-0.3266[/C][C]0.37238[/C][/ROW]
[ROW][C]48[/C][C]-0.112201[/C][C]-1.0283[/C][C]0.153371[/C][/ROW]
[/TABLE]
Source: https://freestatistics.org/blog/index.php?pk=120630&T=2

Globally Unique Identifier (entire table): ba.freestatistics.org/blog/index.php?pk=120630&T=2

As an alternative you can also use a QR Code:  

The GUIDs for individual cells are displayed in the table below:

Partial Autocorrelation Function
Time lag kPACF(k)T-STATP-value
10.34583.16930.001066
20.2064081.89180.030984
3-0.129453-1.18650.119393
40.0221990.20350.419634
50.0460440.4220.337051
6-0.033736-0.30920.37897
70.1220511.11860.133247
8-0.087027-0.79760.213671
9-0.004691-0.0430.482905
10-0.12537-1.1490.126901
11-0.090433-0.82880.204774
12-0.282244-2.58680.005705
130.2716992.49020.00737
14-0.010304-0.09440.462494
150.144931.32830.093838
16-0.0544-0.49860.309687
170.017450.15990.436661
18-0.324462-2.97370.001919
19-0.184088-1.68720.047638
20-0.087606-0.80290.212142
21-0.215427-1.97440.02581
22-0.04073-0.37330.354936
230.0768810.70460.241496
24-0.139906-1.28230.101639
250.0788580.72270.235921
260.0462290.42370.336436
27-0.131847-1.20840.115143
280.1363891.250.10738
29-0.062564-0.57340.28395
30-0.083301-0.76350.223663
31-0.041354-0.3790.352816
32-0.009959-0.09130.463747
33-0.028424-0.26050.397553
34-0.055441-0.50810.306349
350.0993020.91010.182682
36-0.04687-0.42960.334304
37-0.014038-0.12870.448967
380.049580.45440.325354
39-0.010686-0.09790.461106
400.0255130.23380.407843
41-0.056081-0.5140.304304
420.0156320.14330.443209
43-0.048417-0.44370.329183
44-0.033584-0.30780.379498
45-0.008583-0.07870.468743
460.0002350.00220.499142
47-0.035638-0.32660.37238
48-0.112201-1.02830.153371


Parameters (Session):
par1 = 48 ; par2 = 1 ; par3 = 0 ; par4 = 1 ; par5 = 12 ; par6 = White Noise ; par7 = 0.95 ;
Parameters (R input):
par1 = 48 ; par2 = 1 ; par3 = 0 ; par4 = 1 ; par5 = 12 ; par6 = White Noise ; par7 = 0.95 ; par8 = ;
R code (references can be found in the software module):
if (par1 == 'Default') {
par1 = 10*log10(length(x))
} else {
par1 <- as.numeric(par1)
}
par2 <- as.numeric(par2)
par3 <- as.numeric(par3)
par4 <- as.numeric(par4)
par5 <- as.numeric(par5)
if (par6 == 'White Noise') par6 <- 'white' else par6 <- 'ma'
par7 <- as.numeric(par7)
if (par8 != '') par8 <- as.numeric(par8)
ox <- x
if (par8 == '') {
if (par2 == 0) {
x <- log(x)
} else {
x <- (x ^ par2 - 1) / par2
}
} else {
x <- log(x,base=par8)
}
if (par3 > 0) x <- diff(x,lag=1,difference=par3)
if (par4 > 0) x <- diff(x,lag=par5,difference=par4)
bitmap(file='picts.png')
op <- par(mfrow=c(2,1))
plot(ox,type='l',main='Original Time Series',xlab='time',ylab='value')
if (par8=='') {
mytitle <- paste('Working Time Series (lambda=',par2,', d=',par3,', D=',par4,')',sep='')
mysub <- paste('(lambda=',par2,', d=',par3,', D=',par4,', CI=', par7, ', CI type=',par6,')',sep='')
} else {
mytitle <- paste('Working Time Series (base=',par8,', d=',par3,', D=',par4,')',sep='')
mysub <- paste('(base=',par8,', d=',par3,', D=',par4,', CI=', par7, ', CI type=',par6,')',sep='')
}
plot(x,type='l', main=mytitle,xlab='time',ylab='value')
par(op)
dev.off()
bitmap(file='pic1.png')
racf <- acf(x, par1, main='Autocorrelation', xlab='time lag', ylab='ACF', ci.type=par6, ci=par7, sub=mysub)
dev.off()
bitmap(file='pic2.png')
rpacf <- pacf(x,par1,main='Partial Autocorrelation',xlab='lags',ylab='PACF',sub=mysub)
dev.off()
(myacf <- c(racf$acf))
(mypacf <- c(rpacf$acf))
lengthx <- length(x)
sqrtn <- sqrt(lengthx)
load(file='createtable')
a<-table.start()
a<-table.row.start(a)
a<-table.element(a,'Autocorrelation Function',4,TRUE)
a<-table.row.end(a)
a<-table.row.start(a)
a<-table.element(a,'Time lag k',header=TRUE)
a<-table.element(a,hyperlink('basics.htm','ACF(k)','click here for more information about the Autocorrelation Function'),header=TRUE)
a<-table.element(a,'T-STAT',header=TRUE)
a<-table.element(a,'P-value',header=TRUE)
a<-table.row.end(a)
for (i in 2:(par1+1)) {
a<-table.row.start(a)
a<-table.element(a,i-1,header=TRUE)
a<-table.element(a,round(myacf[i],6))
mytstat <- myacf[i]*sqrtn
a<-table.element(a,round(mytstat,4))
a<-table.element(a,round(1-pt(abs(mytstat),lengthx),6))
a<-table.row.end(a)
}
a<-table.end(a)
table.save(a,file='mytable.tab')
a<-table.start()
a<-table.row.start(a)
a<-table.element(a,'Partial Autocorrelation Function',4,TRUE)
a<-table.row.end(a)
a<-table.row.start(a)
a<-table.element(a,'Time lag k',header=TRUE)
a<-table.element(a,hyperlink('basics.htm','PACF(k)','click here for more information about the Partial Autocorrelation Function'),header=TRUE)
a<-table.element(a,'T-STAT',header=TRUE)
a<-table.element(a,'P-value',header=TRUE)
a<-table.row.end(a)
for (i in 1:par1) {
a<-table.row.start(a)
a<-table.element(a,i,header=TRUE)
a<-table.element(a,round(mypacf[i],6))
mytstat <- mypacf[i]*sqrtn
a<-table.element(a,round(mytstat,4))
a<-table.element(a,round(1-pt(abs(mytstat),lengthx),6))
a<-table.row.end(a)
}
a<-table.end(a)
table.save(a,file='mytable1.tab')