Free Statistics

of Irreproducible Research!

Author's title

Author*Unverified author*
R Software Modulerwasp_multipleregression.wasp
Title produced by softwareMultiple Regression
Date of computationWed, 20 Apr 2011 03:53:28 +0000
Cite this page as followsStatistical Computations at FreeStatistics.org, Office for Research Development and Education, URL https://freestatistics.org/blog/index.php?v=date/2011/Apr/20/t130327196784a96dtuwri3dpz.htm/, Retrieved Thu, 09 May 2024 17:52:00 +0000
Statistical Computations at FreeStatistics.org, Office for Research Development and Education, URL https://freestatistics.org/blog/index.php?pk=120621, Retrieved Thu, 09 May 2024 17:52:00 +0000
QR Codes:

Original text written by user:
IsPrivate?No (this computation is public)
User-defined keywords
Estimated Impact228
Family? (F = Feedback message, R = changed R code, M = changed R Module, P = changed Parameters, D = changed Data)
-       [Multiple Regression] [dividend project] [2011-04-20 03:53:28] [d41d8cd98f00b204e9800998ecf8427e] [Current]
Feedback Forum

Post a new message
Dataseries X:
0.103638248	0.161963	1.8049	0.353861
0.132478037	0.165501	3.6967	0.357803
0.135816148	0.118078	2.5405	0.357531
0.148739627	0.126748	1.9518	0.325875
0.132908957	0.163447	1.3482	0.334919
0.136347327	0.096188	1.3459	0.344185
0.134656272	0.108369	1.8102	0.321689
0.141001855	0.108262	1.74	0.35336
0.132556598	0.070497	1.2274	0.281717
0.135787029	0.120334	1.3482	0.346899
0.134742217	0.109403	1.2096	0.338057
0.14266942	0.106887	1.4936	0.352255
0.137347743	0.099173	1.1971	0.284856
0.152776103	0.116039	1.3657	0.242718
0.143613001	0.128575	1.513	0.368384
0.153429967	0.110503	1.5941	0.434267
0.144245369	0.105957	1.5822	0.303746
0.153933404	0.106399	1.6498	0.368653
0.153028351	0.106466	1.709	0.366548
0.156417222	0.131275	1.4455	0.374977
0.146599282	0.139812	1.1474	0.349582
0.148219365	0.142927	1.2846	0.383001
0.136491073	0.144568	1.3725	0.435807
0.146048788	0.148735	1.2815	0.423048
0.146239279	0.154986	1.2046	0.389757
0.139762404	0.162922	1.1968	0.479903
0.060755392	0.1532	1.1857	0.205177
0.060346995	0.153236	1.1351	0.208203
0.133481646	0.156157	1.1625	0.472192
0.145125845	0.156423	1.0727	0.467168
0.061824348	0.163833	1.0691	0.216492
0.065324101	0.169181	1.1106	0.20578
0.063378241	0.173547	1.1228	0.24653
0.065117883	0.175869	1.0883	0.259212
0.065489146	0.178632	1.1249	0.229663
0.069039738	0.183657	1.2361	0.222528
0.068336214	0.180599	1.3753	0.221109
0.063101092	0.182668	1.3006	0.268843
0.070386641	0.179301	1.3086	0.281901
0.075928156	0.178955	1.3875	0.261913
0.075532635	0.174564	1.2855	0.360444
0.077186964	0.173946	1.4361	0.277621
0.079388415	0.182703	1.5932	0.283505
0.169231251	0.183455	1.6564	0.263776


Summary of computational transaction
Raw Inputview raw input (R code)
Raw Outputview raw output of R engine
Computing time4 seconds
R Server'Herman Ole Andreas Wold' @ www.yougetit.org

\begin{tabular}{lllllllll}
\hline
Summary of computational transaction \tabularnewline
Raw Input & view raw input (R code)  \tabularnewline
Raw Output & view raw output of R engine  \tabularnewline
Computing time & 4 seconds \tabularnewline
R Server & 'Herman Ole Andreas Wold' @ www.yougetit.org \tabularnewline
\hline
\end{tabular}
%Source: https://freestatistics.org/blog/index.php?pk=120621&T=0

[TABLE]
[ROW][C]Summary of computational transaction[/C][/ROW]
[ROW][C]Raw Input[/C][C]view raw input (R code) [/C][/ROW]
[ROW][C]Raw Output[/C][C]view raw output of R engine [/C][/ROW]
[ROW][C]Computing time[/C][C]4 seconds[/C][/ROW]
[ROW][C]R Server[/C][C]'Herman Ole Andreas Wold' @ www.yougetit.org[/C][/ROW]
[/TABLE]
Source: https://freestatistics.org/blog/index.php?pk=120621&T=0

Globally Unique Identifier (entire table): ba.freestatistics.org/blog/index.php?pk=120621&T=0

As an alternative you can also use a QR Code:  

The GUIDs for individual cells are displayed in the table below:

Summary of computational transaction
Raw Inputview raw input (R code)
Raw Outputview raw output of R engine
Computing time4 seconds
R Server'Herman Ole Andreas Wold' @ www.yougetit.org


Multiple Linear Regression - Estimated Regression Equation
div/rev/share[t] = + 0.100447462934908 -0.576381870047455roa[t] + 0.0115228239094356currentR[t] + 0.256366870998517ebitmargin[t] + e[t]

\begin{tabular}{lllllllll}
\hline
Multiple Linear Regression - Estimated Regression Equation \tabularnewline
div/rev/share[t] =  +  0.100447462934908 -0.576381870047455roa[t] +  0.0115228239094356currentR[t] +  0.256366870998517ebitmargin[t]  + e[t] \tabularnewline
\hline
\end{tabular}
%Source: https://freestatistics.org/blog/index.php?pk=120621&T=1

[TABLE]
[ROW][C]Multiple Linear Regression - Estimated Regression Equation[/C][/ROW]
[ROW][C]div/rev/share[t] =  +  0.100447462934908 -0.576381870047455roa[t] +  0.0115228239094356currentR[t] +  0.256366870998517ebitmargin[t]  + e[t][/C][/ROW]
[/TABLE]
Source: https://freestatistics.org/blog/index.php?pk=120621&T=1

Globally Unique Identifier (entire table): ba.freestatistics.org/blog/index.php?pk=120621&T=1

As an alternative you can also use a QR Code:  

The GUIDs for individual cells are displayed in the table below:

Multiple Linear Regression - Estimated Regression Equation
div/rev/share[t] = + 0.100447462934908 -0.576381870047455roa[t] + 0.0115228239094356currentR[t] + 0.256366870998517ebitmargin[t] + e[t]


Multiple Linear Regression - Ordinary Least Squares
VariableParameterS.D.T-STATH0: parameter = 02-tail p-value1-tail p-value
(Intercept)0.1004474629349080.0252843.97280.0002890.000144
roa-0.5763818700474550.104923-5.49342e-061e-06
currentR0.01152282390943560.0070091.6440.1080220.054011
ebitmargin0.2563668709985170.0431555.94061e-060

\begin{tabular}{lllllllll}
\hline
Multiple Linear Regression - Ordinary Least Squares \tabularnewline
Variable & Parameter & S.D. & T-STATH0: parameter = 0 & 2-tail p-value & 1-tail p-value \tabularnewline
(Intercept) & 0.100447462934908 & 0.025284 & 3.9728 & 0.000289 & 0.000144 \tabularnewline
roa & -0.576381870047455 & 0.104923 & -5.4934 & 2e-06 & 1e-06 \tabularnewline
currentR & 0.0115228239094356 & 0.007009 & 1.644 & 0.108022 & 0.054011 \tabularnewline
ebitmargin & 0.256366870998517 & 0.043155 & 5.9406 & 1e-06 & 0 \tabularnewline
\hline
\end{tabular}
%Source: https://freestatistics.org/blog/index.php?pk=120621&T=2

[TABLE]
[ROW][C]Multiple Linear Regression - Ordinary Least Squares[/C][/ROW]
[ROW][C]Variable[/C][C]Parameter[/C][C]S.D.[/C][C]T-STATH0: parameter = 0[/C][C]2-tail p-value[/C][C]1-tail p-value[/C][/ROW]
[ROW][C](Intercept)[/C][C]0.100447462934908[/C][C]0.025284[/C][C]3.9728[/C][C]0.000289[/C][C]0.000144[/C][/ROW]
[ROW][C]roa[/C][C]-0.576381870047455[/C][C]0.104923[/C][C]-5.4934[/C][C]2e-06[/C][C]1e-06[/C][/ROW]
[ROW][C]currentR[/C][C]0.0115228239094356[/C][C]0.007009[/C][C]1.644[/C][C]0.108022[/C][C]0.054011[/C][/ROW]
[ROW][C]ebitmargin[/C][C]0.256366870998517[/C][C]0.043155[/C][C]5.9406[/C][C]1e-06[/C][C]0[/C][/ROW]
[/TABLE]
Source: https://freestatistics.org/blog/index.php?pk=120621&T=2

Globally Unique Identifier (entire table): ba.freestatistics.org/blog/index.php?pk=120621&T=2

As an alternative you can also use a QR Code:  

The GUIDs for individual cells are displayed in the table below:

Multiple Linear Regression - Ordinary Least Squares
VariableParameterS.D.T-STATH0: parameter = 02-tail p-value1-tail p-value
(Intercept)0.1004474629349080.0252843.97280.0002890.000144
roa-0.5763818700474550.104923-5.49342e-061e-06
currentR0.01152282390943560.0070091.6440.1080220.054011
ebitmargin0.2563668709985170.0431555.94061e-060


Multiple Linear Regression - Regression Statistics
Multiple R0.847488246747138
R-squared0.718236328374537
Adjusted R-squared0.697104053002628
F-TEST (value)33.9876476022672
F-TEST (DF numerator)3
F-TEST (DF denominator)40
p-value4.37336833414292e-11
Multiple Linear Regression - Residual Statistics
Residual Standard Deviation0.0202559442723589
Sum Squared Residuals0.0164121311345964

\begin{tabular}{lllllllll}
\hline
Multiple Linear Regression - Regression Statistics \tabularnewline
Multiple R & 0.847488246747138 \tabularnewline
R-squared & 0.718236328374537 \tabularnewline
Adjusted R-squared & 0.697104053002628 \tabularnewline
F-TEST (value) & 33.9876476022672 \tabularnewline
F-TEST (DF numerator) & 3 \tabularnewline
F-TEST (DF denominator) & 40 \tabularnewline
p-value & 4.37336833414292e-11 \tabularnewline
Multiple Linear Regression - Residual Statistics \tabularnewline
Residual Standard Deviation & 0.0202559442723589 \tabularnewline
Sum Squared Residuals & 0.0164121311345964 \tabularnewline
\hline
\end{tabular}
%Source: https://freestatistics.org/blog/index.php?pk=120621&T=3

[TABLE]
[ROW][C]Multiple Linear Regression - Regression Statistics[/C][/ROW]
[ROW][C]Multiple R[/C][C]0.847488246747138[/C][/ROW]
[ROW][C]R-squared[/C][C]0.718236328374537[/C][/ROW]
[ROW][C]Adjusted R-squared[/C][C]0.697104053002628[/C][/ROW]
[ROW][C]F-TEST (value)[/C][C]33.9876476022672[/C][/ROW]
[ROW][C]F-TEST (DF numerator)[/C][C]3[/C][/ROW]
[ROW][C]F-TEST (DF denominator)[/C][C]40[/C][/ROW]
[ROW][C]p-value[/C][C]4.37336833414292e-11[/C][/ROW]
[ROW][C]Multiple Linear Regression - Residual Statistics[/C][/ROW]
[ROW][C]Residual Standard Deviation[/C][C]0.0202559442723589[/C][/ROW]
[ROW][C]Sum Squared Residuals[/C][C]0.0164121311345964[/C][/ROW]
[/TABLE]
Source: https://freestatistics.org/blog/index.php?pk=120621&T=3

Globally Unique Identifier (entire table): ba.freestatistics.org/blog/index.php?pk=120621&T=3

As an alternative you can also use a QR Code:  

The GUIDs for individual cells are displayed in the table below:

Multiple Linear Regression - Regression Statistics
Multiple R0.847488246747138
R-squared0.718236328374537
Adjusted R-squared0.697104053002628
F-TEST (value)33.9876476022672
F-TEST (DF numerator)3
F-TEST (DF denominator)40
p-value4.37336833414292e-11
Multiple Linear Regression - Residual Statistics
Residual Standard Deviation0.0202559442723589
Sum Squared Residuals0.0164121311345964


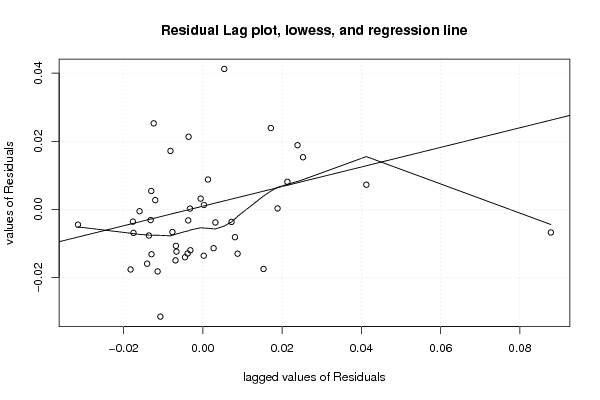
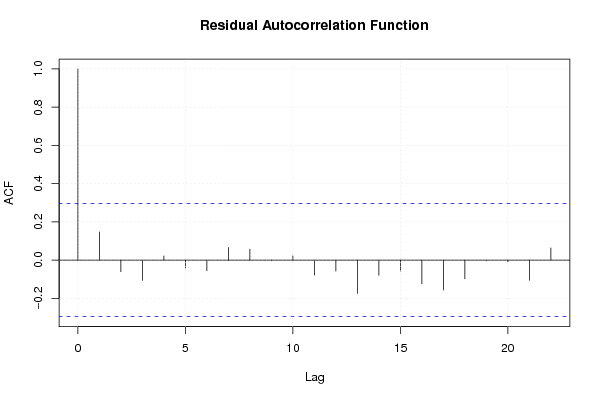
Multiple Linear Regression - Actuals, Interpolation, and Residuals
Time or IndexActualsInterpolationForecastResidualsPrediction Error
10.1036382480.118610708328958-0.0149724603289583
20.1324780370.139380945750077-0.00690290875007674
30.1358161480.153322282380336-0.0175061343803362
40.1487396270.1334260154632110.015313611536789
50.1329089570.1076367826839150.0252721743160853
60.1363473270.148752643813117-0.0124053168131171
70.1346562720.141314554265237-0.00665828226523732
80.1410018550.148686720058284-0.00768486505828404
90.1325565980.146180290105703-0.0136236921057028
100.1357870290.1355576093618330.000229419638167115
110.1347422170.137994180316105-0.00325196331610496
120.142669420.146356735925861-0.00368731592586101
130.1373477430.130107557643830.00724018535616962
140.1527761030.1115262619246050.0412498410753947
150.1436130010.138214649974450.00539835102555007
160.1534299670.166455742710998-0.0130257757109981
170.1442453690.1354775927181140.00876777628188594
180.1539334040.1526417793237320.0012916246762683
190.1530283510.1527456606504250.000282690349574795
200.1564172220.1375708550919280.0188463669080719
210.1465992820.1227048925709230.0238943894290771
220.1482193650.1310579189479990.0171614460520009
230.1364910730.144662641510838-0.0081715685108383
240.1460487880.1379412963755220.00810749162447819
250.1462392790.1249175186448080.021321760355192
260.1397624040.14336392205065-0.00360151805065007
270.0607553920.078408958243918-0.0176535662439181
280.0603469950.0785809197584204-0.0182339247584204
290.1334816460.144891067599158-0.0114094215991579
300.1451258450.1424150132747610.00271083172523858
310.0618243480.0738375196972115-0.0120131716972115
320.0653241010.0684870247263032-0.00316292372630319
330.0633782410.0765580699265607-0.0131798289265607
340.0651178830.0780734184574382-0.0129555354574382
350.0654891460.0693272260344472-0.0038380800344472
360.0690397380.06588306753161360.00315667046838644
370.0683362140.0688858357884652-0.000549621788465198
380.0631010920.0790699629735454-0.0159688709735454
390.0703866410.0844504619227693-0.0140638209227693
400.0759281560.0804347798387418-0.00450662383874184
410.0755326350.107050428757713-0.0315177937577127
420.0771869640.0879088966774528-0.0107219326774528
430.0793884150.0861802189465748-0.00679180394657485
440.1692312510.08141716025344580.0878140907465542

\begin{tabular}{lllllllll}
\hline
Multiple Linear Regression - Actuals, Interpolation, and Residuals \tabularnewline
Time or Index & Actuals & InterpolationForecast & ResidualsPrediction Error \tabularnewline
1 & 0.103638248 & 0.118610708328958 & -0.0149724603289583 \tabularnewline
2 & 0.132478037 & 0.139380945750077 & -0.00690290875007674 \tabularnewline
3 & 0.135816148 & 0.153322282380336 & -0.0175061343803362 \tabularnewline
4 & 0.148739627 & 0.133426015463211 & 0.015313611536789 \tabularnewline
5 & 0.132908957 & 0.107636782683915 & 0.0252721743160853 \tabularnewline
6 & 0.136347327 & 0.148752643813117 & -0.0124053168131171 \tabularnewline
7 & 0.134656272 & 0.141314554265237 & -0.00665828226523732 \tabularnewline
8 & 0.141001855 & 0.148686720058284 & -0.00768486505828404 \tabularnewline
9 & 0.132556598 & 0.146180290105703 & -0.0136236921057028 \tabularnewline
10 & 0.135787029 & 0.135557609361833 & 0.000229419638167115 \tabularnewline
11 & 0.134742217 & 0.137994180316105 & -0.00325196331610496 \tabularnewline
12 & 0.14266942 & 0.146356735925861 & -0.00368731592586101 \tabularnewline
13 & 0.137347743 & 0.13010755764383 & 0.00724018535616962 \tabularnewline
14 & 0.152776103 & 0.111526261924605 & 0.0412498410753947 \tabularnewline
15 & 0.143613001 & 0.13821464997445 & 0.00539835102555007 \tabularnewline
16 & 0.153429967 & 0.166455742710998 & -0.0130257757109981 \tabularnewline
17 & 0.144245369 & 0.135477592718114 & 0.00876777628188594 \tabularnewline
18 & 0.153933404 & 0.152641779323732 & 0.0012916246762683 \tabularnewline
19 & 0.153028351 & 0.152745660650425 & 0.000282690349574795 \tabularnewline
20 & 0.156417222 & 0.137570855091928 & 0.0188463669080719 \tabularnewline
21 & 0.146599282 & 0.122704892570923 & 0.0238943894290771 \tabularnewline
22 & 0.148219365 & 0.131057918947999 & 0.0171614460520009 \tabularnewline
23 & 0.136491073 & 0.144662641510838 & -0.0081715685108383 \tabularnewline
24 & 0.146048788 & 0.137941296375522 & 0.00810749162447819 \tabularnewline
25 & 0.146239279 & 0.124917518644808 & 0.021321760355192 \tabularnewline
26 & 0.139762404 & 0.14336392205065 & -0.00360151805065007 \tabularnewline
27 & 0.060755392 & 0.078408958243918 & -0.0176535662439181 \tabularnewline
28 & 0.060346995 & 0.0785809197584204 & -0.0182339247584204 \tabularnewline
29 & 0.133481646 & 0.144891067599158 & -0.0114094215991579 \tabularnewline
30 & 0.145125845 & 0.142415013274761 & 0.00271083172523858 \tabularnewline
31 & 0.061824348 & 0.0738375196972115 & -0.0120131716972115 \tabularnewline
32 & 0.065324101 & 0.0684870247263032 & -0.00316292372630319 \tabularnewline
33 & 0.063378241 & 0.0765580699265607 & -0.0131798289265607 \tabularnewline
34 & 0.065117883 & 0.0780734184574382 & -0.0129555354574382 \tabularnewline
35 & 0.065489146 & 0.0693272260344472 & -0.0038380800344472 \tabularnewline
36 & 0.069039738 & 0.0658830675316136 & 0.00315667046838644 \tabularnewline
37 & 0.068336214 & 0.0688858357884652 & -0.000549621788465198 \tabularnewline
38 & 0.063101092 & 0.0790699629735454 & -0.0159688709735454 \tabularnewline
39 & 0.070386641 & 0.0844504619227693 & -0.0140638209227693 \tabularnewline
40 & 0.075928156 & 0.0804347798387418 & -0.00450662383874184 \tabularnewline
41 & 0.075532635 & 0.107050428757713 & -0.0315177937577127 \tabularnewline
42 & 0.077186964 & 0.0879088966774528 & -0.0107219326774528 \tabularnewline
43 & 0.079388415 & 0.0861802189465748 & -0.00679180394657485 \tabularnewline
44 & 0.169231251 & 0.0814171602534458 & 0.0878140907465542 \tabularnewline
\hline
\end{tabular}
%Source: https://freestatistics.org/blog/index.php?pk=120621&T=4

[TABLE]
[ROW][C]Multiple Linear Regression - Actuals, Interpolation, and Residuals[/C][/ROW]
[ROW][C]Time or Index[/C][C]Actuals[/C][C]InterpolationForecast[/C][C]ResidualsPrediction Error[/C][/ROW]
[ROW][C]1[/C][C]0.103638248[/C][C]0.118610708328958[/C][C]-0.0149724603289583[/C][/ROW]
[ROW][C]2[/C][C]0.132478037[/C][C]0.139380945750077[/C][C]-0.00690290875007674[/C][/ROW]
[ROW][C]3[/C][C]0.135816148[/C][C]0.153322282380336[/C][C]-0.0175061343803362[/C][/ROW]
[ROW][C]4[/C][C]0.148739627[/C][C]0.133426015463211[/C][C]0.015313611536789[/C][/ROW]
[ROW][C]5[/C][C]0.132908957[/C][C]0.107636782683915[/C][C]0.0252721743160853[/C][/ROW]
[ROW][C]6[/C][C]0.136347327[/C][C]0.148752643813117[/C][C]-0.0124053168131171[/C][/ROW]
[ROW][C]7[/C][C]0.134656272[/C][C]0.141314554265237[/C][C]-0.00665828226523732[/C][/ROW]
[ROW][C]8[/C][C]0.141001855[/C][C]0.148686720058284[/C][C]-0.00768486505828404[/C][/ROW]
[ROW][C]9[/C][C]0.132556598[/C][C]0.146180290105703[/C][C]-0.0136236921057028[/C][/ROW]
[ROW][C]10[/C][C]0.135787029[/C][C]0.135557609361833[/C][C]0.000229419638167115[/C][/ROW]
[ROW][C]11[/C][C]0.134742217[/C][C]0.137994180316105[/C][C]-0.00325196331610496[/C][/ROW]
[ROW][C]12[/C][C]0.14266942[/C][C]0.146356735925861[/C][C]-0.00368731592586101[/C][/ROW]
[ROW][C]13[/C][C]0.137347743[/C][C]0.13010755764383[/C][C]0.00724018535616962[/C][/ROW]
[ROW][C]14[/C][C]0.152776103[/C][C]0.111526261924605[/C][C]0.0412498410753947[/C][/ROW]
[ROW][C]15[/C][C]0.143613001[/C][C]0.13821464997445[/C][C]0.00539835102555007[/C][/ROW]
[ROW][C]16[/C][C]0.153429967[/C][C]0.166455742710998[/C][C]-0.0130257757109981[/C][/ROW]
[ROW][C]17[/C][C]0.144245369[/C][C]0.135477592718114[/C][C]0.00876777628188594[/C][/ROW]
[ROW][C]18[/C][C]0.153933404[/C][C]0.152641779323732[/C][C]0.0012916246762683[/C][/ROW]
[ROW][C]19[/C][C]0.153028351[/C][C]0.152745660650425[/C][C]0.000282690349574795[/C][/ROW]
[ROW][C]20[/C][C]0.156417222[/C][C]0.137570855091928[/C][C]0.0188463669080719[/C][/ROW]
[ROW][C]21[/C][C]0.146599282[/C][C]0.122704892570923[/C][C]0.0238943894290771[/C][/ROW]
[ROW][C]22[/C][C]0.148219365[/C][C]0.131057918947999[/C][C]0.0171614460520009[/C][/ROW]
[ROW][C]23[/C][C]0.136491073[/C][C]0.144662641510838[/C][C]-0.0081715685108383[/C][/ROW]
[ROW][C]24[/C][C]0.146048788[/C][C]0.137941296375522[/C][C]0.00810749162447819[/C][/ROW]
[ROW][C]25[/C][C]0.146239279[/C][C]0.124917518644808[/C][C]0.021321760355192[/C][/ROW]
[ROW][C]26[/C][C]0.139762404[/C][C]0.14336392205065[/C][C]-0.00360151805065007[/C][/ROW]
[ROW][C]27[/C][C]0.060755392[/C][C]0.078408958243918[/C][C]-0.0176535662439181[/C][/ROW]
[ROW][C]28[/C][C]0.060346995[/C][C]0.0785809197584204[/C][C]-0.0182339247584204[/C][/ROW]
[ROW][C]29[/C][C]0.133481646[/C][C]0.144891067599158[/C][C]-0.0114094215991579[/C][/ROW]
[ROW][C]30[/C][C]0.145125845[/C][C]0.142415013274761[/C][C]0.00271083172523858[/C][/ROW]
[ROW][C]31[/C][C]0.061824348[/C][C]0.0738375196972115[/C][C]-0.0120131716972115[/C][/ROW]
[ROW][C]32[/C][C]0.065324101[/C][C]0.0684870247263032[/C][C]-0.00316292372630319[/C][/ROW]
[ROW][C]33[/C][C]0.063378241[/C][C]0.0765580699265607[/C][C]-0.0131798289265607[/C][/ROW]
[ROW][C]34[/C][C]0.065117883[/C][C]0.0780734184574382[/C][C]-0.0129555354574382[/C][/ROW]
[ROW][C]35[/C][C]0.065489146[/C][C]0.0693272260344472[/C][C]-0.0038380800344472[/C][/ROW]
[ROW][C]36[/C][C]0.069039738[/C][C]0.0658830675316136[/C][C]0.00315667046838644[/C][/ROW]
[ROW][C]37[/C][C]0.068336214[/C][C]0.0688858357884652[/C][C]-0.000549621788465198[/C][/ROW]
[ROW][C]38[/C][C]0.063101092[/C][C]0.0790699629735454[/C][C]-0.0159688709735454[/C][/ROW]
[ROW][C]39[/C][C]0.070386641[/C][C]0.0844504619227693[/C][C]-0.0140638209227693[/C][/ROW]
[ROW][C]40[/C][C]0.075928156[/C][C]0.0804347798387418[/C][C]-0.00450662383874184[/C][/ROW]
[ROW][C]41[/C][C]0.075532635[/C][C]0.107050428757713[/C][C]-0.0315177937577127[/C][/ROW]
[ROW][C]42[/C][C]0.077186964[/C][C]0.0879088966774528[/C][C]-0.0107219326774528[/C][/ROW]
[ROW][C]43[/C][C]0.079388415[/C][C]0.0861802189465748[/C][C]-0.00679180394657485[/C][/ROW]
[ROW][C]44[/C][C]0.169231251[/C][C]0.0814171602534458[/C][C]0.0878140907465542[/C][/ROW]
[/TABLE]
Source: https://freestatistics.org/blog/index.php?pk=120621&T=4

Globally Unique Identifier (entire table): ba.freestatistics.org/blog/index.php?pk=120621&T=4

As an alternative you can also use a QR Code:  

The GUIDs for individual cells are displayed in the table below:

Multiple Linear Regression - Actuals, Interpolation, and Residuals
Time or IndexActualsInterpolationForecastResidualsPrediction Error
10.1036382480.118610708328958-0.0149724603289583
20.1324780370.139380945750077-0.00690290875007674
30.1358161480.153322282380336-0.0175061343803362
40.1487396270.1334260154632110.015313611536789
50.1329089570.1076367826839150.0252721743160853
60.1363473270.148752643813117-0.0124053168131171
70.1346562720.141314554265237-0.00665828226523732
80.1410018550.148686720058284-0.00768486505828404
90.1325565980.146180290105703-0.0136236921057028
100.1357870290.1355576093618330.000229419638167115
110.1347422170.137994180316105-0.00325196331610496
120.142669420.146356735925861-0.00368731592586101
130.1373477430.130107557643830.00724018535616962
140.1527761030.1115262619246050.0412498410753947
150.1436130010.138214649974450.00539835102555007
160.1534299670.166455742710998-0.0130257757109981
170.1442453690.1354775927181140.00876777628188594
180.1539334040.1526417793237320.0012916246762683
190.1530283510.1527456606504250.000282690349574795
200.1564172220.1375708550919280.0188463669080719
210.1465992820.1227048925709230.0238943894290771
220.1482193650.1310579189479990.0171614460520009
230.1364910730.144662641510838-0.0081715685108383
240.1460487880.1379412963755220.00810749162447819
250.1462392790.1249175186448080.021321760355192
260.1397624040.14336392205065-0.00360151805065007
270.0607553920.078408958243918-0.0176535662439181
280.0603469950.0785809197584204-0.0182339247584204
290.1334816460.144891067599158-0.0114094215991579
300.1451258450.1424150132747610.00271083172523858
310.0618243480.0738375196972115-0.0120131716972115
320.0653241010.0684870247263032-0.00316292372630319
330.0633782410.0765580699265607-0.0131798289265607
340.0651178830.0780734184574382-0.0129555354574382
350.0654891460.0693272260344472-0.0038380800344472
360.0690397380.06588306753161360.00315667046838644
370.0683362140.0688858357884652-0.000549621788465198
380.0631010920.0790699629735454-0.0159688709735454
390.0703866410.0844504619227693-0.0140638209227693
400.0759281560.0804347798387418-0.00450662383874184
410.0755326350.107050428757713-0.0315177937577127
420.0771869640.0879088966774528-0.0107219326774528
430.0793884150.0861802189465748-0.00679180394657485
440.1692312510.08141716025344580.0878140907465542


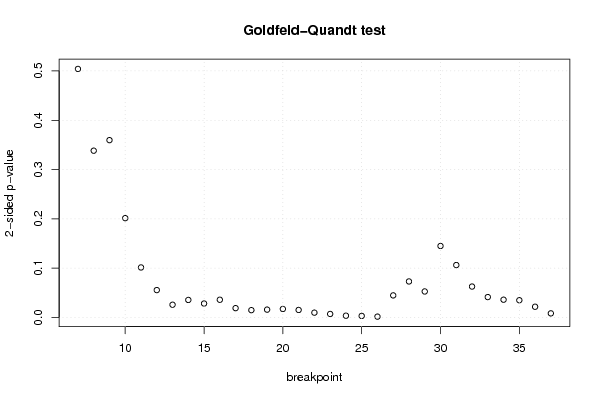
Goldfeld-Quandt test for Heteroskedasticity
p-valuesAlternative Hypothesis
breakpoint indexgreater2-sidedless
70.2520607416456930.5041214832913850.747939258354307
80.1690911320359030.3381822640718050.830908867964097
90.1798117232791520.3596234465583050.820188276720848
100.1006447005120590.2012894010241170.899355299487941
110.05060965887884240.1012193177576850.949390341121158
120.02765261852432360.05530523704864720.972347381475676
130.01278499589926860.02556999179853710.987215004100731
140.01763523248158110.03527046496316210.98236476751842
150.01401302925521790.02802605851043580.985986970744782
160.01783347247695490.03566694495390970.982166527523045
170.009311085448564050.01862217089712810.990688914551436
180.007273875171629340.01454775034325870.99272612482837
190.007814304069201660.01562860813840330.992185695930798
200.008477998098062940.01695599619612590.991522001901937
210.007488531911645950.01497706382329190.992511468088354
220.004739686649661330.009479373299322650.995260313350339
230.003409788033417830.006819576066835650.996590211966582
240.001647725975135860.003295451950271720.998352274024864
250.001428292241208650.002856584482417290.998571707758791
260.000687202110799880.001374404221599760.9993127978892
270.0222537560551730.04450751211034610.977746243944827
280.0364025144515410.0728050289030820.96359748554846
290.02624526111360180.05249052222720360.973754738886398
300.07240510353009280.1448102070601860.927594896469907
310.05303847096639590.1060769419327920.946961529033604
320.03124885667669530.06249771335339050.968751143323305
330.02055444820214550.0411088964042910.979445551797854
340.01788155043350340.03576310086700680.982118449566497
350.01735477721104590.03470955442209180.982645222788954
360.01073247384500490.02146494769000970.989267526154995
370.004023918632330450.00804783726466090.99597608136767

\begin{tabular}{lllllllll}
\hline
Goldfeld-Quandt test for Heteroskedasticity \tabularnewline
p-values & Alternative Hypothesis \tabularnewline
breakpoint index & greater & 2-sided & less \tabularnewline
7 & 0.252060741645693 & 0.504121483291385 & 0.747939258354307 \tabularnewline
8 & 0.169091132035903 & 0.338182264071805 & 0.830908867964097 \tabularnewline
9 & 0.179811723279152 & 0.359623446558305 & 0.820188276720848 \tabularnewline
10 & 0.100644700512059 & 0.201289401024117 & 0.899355299487941 \tabularnewline
11 & 0.0506096588788424 & 0.101219317757685 & 0.949390341121158 \tabularnewline
12 & 0.0276526185243236 & 0.0553052370486472 & 0.972347381475676 \tabularnewline
13 & 0.0127849958992686 & 0.0255699917985371 & 0.987215004100731 \tabularnewline
14 & 0.0176352324815811 & 0.0352704649631621 & 0.98236476751842 \tabularnewline
15 & 0.0140130292552179 & 0.0280260585104358 & 0.985986970744782 \tabularnewline
16 & 0.0178334724769549 & 0.0356669449539097 & 0.982166527523045 \tabularnewline
17 & 0.00931108544856405 & 0.0186221708971281 & 0.990688914551436 \tabularnewline
18 & 0.00727387517162934 & 0.0145477503432587 & 0.99272612482837 \tabularnewline
19 & 0.00781430406920166 & 0.0156286081384033 & 0.992185695930798 \tabularnewline
20 & 0.00847799809806294 & 0.0169559961961259 & 0.991522001901937 \tabularnewline
21 & 0.00748853191164595 & 0.0149770638232919 & 0.992511468088354 \tabularnewline
22 & 0.00473968664966133 & 0.00947937329932265 & 0.995260313350339 \tabularnewline
23 & 0.00340978803341783 & 0.00681957606683565 & 0.996590211966582 \tabularnewline
24 & 0.00164772597513586 & 0.00329545195027172 & 0.998352274024864 \tabularnewline
25 & 0.00142829224120865 & 0.00285658448241729 & 0.998571707758791 \tabularnewline
26 & 0.00068720211079988 & 0.00137440422159976 & 0.9993127978892 \tabularnewline
27 & 0.022253756055173 & 0.0445075121103461 & 0.977746243944827 \tabularnewline
28 & 0.036402514451541 & 0.072805028903082 & 0.96359748554846 \tabularnewline
29 & 0.0262452611136018 & 0.0524905222272036 & 0.973754738886398 \tabularnewline
30 & 0.0724051035300928 & 0.144810207060186 & 0.927594896469907 \tabularnewline
31 & 0.0530384709663959 & 0.106076941932792 & 0.946961529033604 \tabularnewline
32 & 0.0312488566766953 & 0.0624977133533905 & 0.968751143323305 \tabularnewline
33 & 0.0205544482021455 & 0.041108896404291 & 0.979445551797854 \tabularnewline
34 & 0.0178815504335034 & 0.0357631008670068 & 0.982118449566497 \tabularnewline
35 & 0.0173547772110459 & 0.0347095544220918 & 0.982645222788954 \tabularnewline
36 & 0.0107324738450049 & 0.0214649476900097 & 0.989267526154995 \tabularnewline
37 & 0.00402391863233045 & 0.0080478372646609 & 0.99597608136767 \tabularnewline
\hline
\end{tabular}
%Source: https://freestatistics.org/blog/index.php?pk=120621&T=5

[TABLE]
[ROW][C]Goldfeld-Quandt test for Heteroskedasticity[/C][/ROW]
[ROW][C]p-values[/C][C]Alternative Hypothesis[/C][/ROW]
[ROW][C]breakpoint index[/C][C]greater[/C][C]2-sided[/C][C]less[/C][/ROW]
[ROW][C]7[/C][C]0.252060741645693[/C][C]0.504121483291385[/C][C]0.747939258354307[/C][/ROW]
[ROW][C]8[/C][C]0.169091132035903[/C][C]0.338182264071805[/C][C]0.830908867964097[/C][/ROW]
[ROW][C]9[/C][C]0.179811723279152[/C][C]0.359623446558305[/C][C]0.820188276720848[/C][/ROW]
[ROW][C]10[/C][C]0.100644700512059[/C][C]0.201289401024117[/C][C]0.899355299487941[/C][/ROW]
[ROW][C]11[/C][C]0.0506096588788424[/C][C]0.101219317757685[/C][C]0.949390341121158[/C][/ROW]
[ROW][C]12[/C][C]0.0276526185243236[/C][C]0.0553052370486472[/C][C]0.972347381475676[/C][/ROW]
[ROW][C]13[/C][C]0.0127849958992686[/C][C]0.0255699917985371[/C][C]0.987215004100731[/C][/ROW]
[ROW][C]14[/C][C]0.0176352324815811[/C][C]0.0352704649631621[/C][C]0.98236476751842[/C][/ROW]
[ROW][C]15[/C][C]0.0140130292552179[/C][C]0.0280260585104358[/C][C]0.985986970744782[/C][/ROW]
[ROW][C]16[/C][C]0.0178334724769549[/C][C]0.0356669449539097[/C][C]0.982166527523045[/C][/ROW]
[ROW][C]17[/C][C]0.00931108544856405[/C][C]0.0186221708971281[/C][C]0.990688914551436[/C][/ROW]
[ROW][C]18[/C][C]0.00727387517162934[/C][C]0.0145477503432587[/C][C]0.99272612482837[/C][/ROW]
[ROW][C]19[/C][C]0.00781430406920166[/C][C]0.0156286081384033[/C][C]0.992185695930798[/C][/ROW]
[ROW][C]20[/C][C]0.00847799809806294[/C][C]0.0169559961961259[/C][C]0.991522001901937[/C][/ROW]
[ROW][C]21[/C][C]0.00748853191164595[/C][C]0.0149770638232919[/C][C]0.992511468088354[/C][/ROW]
[ROW][C]22[/C][C]0.00473968664966133[/C][C]0.00947937329932265[/C][C]0.995260313350339[/C][/ROW]
[ROW][C]23[/C][C]0.00340978803341783[/C][C]0.00681957606683565[/C][C]0.996590211966582[/C][/ROW]
[ROW][C]24[/C][C]0.00164772597513586[/C][C]0.00329545195027172[/C][C]0.998352274024864[/C][/ROW]
[ROW][C]25[/C][C]0.00142829224120865[/C][C]0.00285658448241729[/C][C]0.998571707758791[/C][/ROW]
[ROW][C]26[/C][C]0.00068720211079988[/C][C]0.00137440422159976[/C][C]0.9993127978892[/C][/ROW]
[ROW][C]27[/C][C]0.022253756055173[/C][C]0.0445075121103461[/C][C]0.977746243944827[/C][/ROW]
[ROW][C]28[/C][C]0.036402514451541[/C][C]0.072805028903082[/C][C]0.96359748554846[/C][/ROW]
[ROW][C]29[/C][C]0.0262452611136018[/C][C]0.0524905222272036[/C][C]0.973754738886398[/C][/ROW]
[ROW][C]30[/C][C]0.0724051035300928[/C][C]0.144810207060186[/C][C]0.927594896469907[/C][/ROW]
[ROW][C]31[/C][C]0.0530384709663959[/C][C]0.106076941932792[/C][C]0.946961529033604[/C][/ROW]
[ROW][C]32[/C][C]0.0312488566766953[/C][C]0.0624977133533905[/C][C]0.968751143323305[/C][/ROW]
[ROW][C]33[/C][C]0.0205544482021455[/C][C]0.041108896404291[/C][C]0.979445551797854[/C][/ROW]
[ROW][C]34[/C][C]0.0178815504335034[/C][C]0.0357631008670068[/C][C]0.982118449566497[/C][/ROW]
[ROW][C]35[/C][C]0.0173547772110459[/C][C]0.0347095544220918[/C][C]0.982645222788954[/C][/ROW]
[ROW][C]36[/C][C]0.0107324738450049[/C][C]0.0214649476900097[/C][C]0.989267526154995[/C][/ROW]
[ROW][C]37[/C][C]0.00402391863233045[/C][C]0.0080478372646609[/C][C]0.99597608136767[/C][/ROW]
[/TABLE]
Source: https://freestatistics.org/blog/index.php?pk=120621&T=5

Globally Unique Identifier (entire table): ba.freestatistics.org/blog/index.php?pk=120621&T=5

As an alternative you can also use a QR Code:  

The GUIDs for individual cells are displayed in the table below:

Goldfeld-Quandt test for Heteroskedasticity
p-valuesAlternative Hypothesis
breakpoint indexgreater2-sidedless
70.2520607416456930.5041214832913850.747939258354307
80.1690911320359030.3381822640718050.830908867964097
90.1798117232791520.3596234465583050.820188276720848
100.1006447005120590.2012894010241170.899355299487941
110.05060965887884240.1012193177576850.949390341121158
120.02765261852432360.05530523704864720.972347381475676
130.01278499589926860.02556999179853710.987215004100731
140.01763523248158110.03527046496316210.98236476751842
150.01401302925521790.02802605851043580.985986970744782
160.01783347247695490.03566694495390970.982166527523045
170.009311085448564050.01862217089712810.990688914551436
180.007273875171629340.01454775034325870.99272612482837
190.007814304069201660.01562860813840330.992185695930798
200.008477998098062940.01695599619612590.991522001901937
210.007488531911645950.01497706382329190.992511468088354
220.004739686649661330.009479373299322650.995260313350339
230.003409788033417830.006819576066835650.996590211966582
240.001647725975135860.003295451950271720.998352274024864
250.001428292241208650.002856584482417290.998571707758791
260.000687202110799880.001374404221599760.9993127978892
270.0222537560551730.04450751211034610.977746243944827
280.0364025144515410.0728050289030820.96359748554846
290.02624526111360180.05249052222720360.973754738886398
300.07240510353009280.1448102070601860.927594896469907
310.05303847096639590.1060769419327920.946961529033604
320.03124885667669530.06249771335339050.968751143323305
330.02055444820214550.0411088964042910.979445551797854
340.01788155043350340.03576310086700680.982118449566497
350.01735477721104590.03470955442209180.982645222788954
360.01073247384500490.02146494769000970.989267526154995
370.004023918632330450.00804783726466090.99597608136767


Meta Analysis of Goldfeld-Quandt test for Heteroskedasticity
Description# significant tests% significant testsOK/NOK
1% type I error level60.193548387096774NOK
5% type I error level200.64516129032258NOK
10% type I error level240.774193548387097NOK

\begin{tabular}{lllllllll}
\hline
Meta Analysis of Goldfeld-Quandt test for Heteroskedasticity \tabularnewline
Description & # significant tests & % significant tests & OK/NOK \tabularnewline
1% type I error level & 6 & 0.193548387096774 & NOK \tabularnewline
5% type I error level & 20 & 0.64516129032258 & NOK \tabularnewline
10% type I error level & 24 & 0.774193548387097 & NOK \tabularnewline
\hline
\end{tabular}
%Source: https://freestatistics.org/blog/index.php?pk=120621&T=6

[TABLE]
[ROW][C]Meta Analysis of Goldfeld-Quandt test for Heteroskedasticity[/C][/ROW]
[ROW][C]Description[/C][C]# significant tests[/C][C]% significant tests[/C][C]OK/NOK[/C][/ROW]
[ROW][C]1% type I error level[/C][C]6[/C][C]0.193548387096774[/C][C]NOK[/C][/ROW]
[ROW][C]5% type I error level[/C][C]20[/C][C]0.64516129032258[/C][C]NOK[/C][/ROW]
[ROW][C]10% type I error level[/C][C]24[/C][C]0.774193548387097[/C][C]NOK[/C][/ROW]
[/TABLE]
Source: https://freestatistics.org/blog/index.php?pk=120621&T=6

Globally Unique Identifier (entire table): ba.freestatistics.org/blog/index.php?pk=120621&T=6

As an alternative you can also use a QR Code:  

The GUIDs for individual cells are displayed in the table below:

Meta Analysis of Goldfeld-Quandt test for Heteroskedasticity
Description# significant tests% significant testsOK/NOK
1% type I error level60.193548387096774NOK
5% type I error level200.64516129032258NOK
10% type I error level240.774193548387097NOK


Parameters (Session):
par1 = 1 ; par2 = Do not include Seasonal Dummies ; par3 = No Linear Trend ;
Parameters (R input):
par1 = 1 ; par2 = Do not include Seasonal Dummies ; par3 = No Linear Trend ;
R code (references can be found in the software module):
library(lattice)
library(lmtest)
n25 <- 25 #minimum number of obs. for Goldfeld-Quandt test
par1 <- as.numeric(par1)
x <- t(y)
k <- length(x[1,])
n <- length(x[,1])
x1 <- cbind(x[,par1], x[,1:k!=par1])
mycolnames <- c(colnames(x)[par1], colnames(x)[1:k!=par1])
colnames(x1) <- mycolnames #colnames(x)[par1]
x <- x1
if (par3 == 'First Differences'){
x2 <- array(0, dim=c(n-1,k), dimnames=list(1:(n-1), paste('(1-B)',colnames(x),sep='')))
for (i in 1:n-1) {
for (j in 1:k) {
x2[i,j] <- x[i+1,j] - x[i,j]
}
}
x <- x2
}
if (par2 == 'Include Monthly Dummies'){
x2 <- array(0, dim=c(n,11), dimnames=list(1:n, paste('M', seq(1:11), sep ='')))
for (i in 1:11){
x2[seq(i,n,12),i] <- 1
}
x <- cbind(x, x2)
}
if (par2 == 'Include Quarterly Dummies'){
x2 <- array(0, dim=c(n,3), dimnames=list(1:n, paste('Q', seq(1:3), sep ='')))
for (i in 1:3){
x2[seq(i,n,4),i] <- 1
}
x <- cbind(x, x2)
}
k <- length(x[1,])
if (par3 == 'Linear Trend'){
x <- cbind(x, c(1:n))
colnames(x)[k+1] <- 't'
}
x
k <- length(x[1,])
df <- as.data.frame(x)
(mylm <- lm(df))
(mysum <- summary(mylm))
if (n > n25) {
kp3 <- k + 3
nmkm3 <- n - k - 3
gqarr <- array(NA, dim=c(nmkm3-kp3+1,3))
numgqtests <- 0
numsignificant1 <- 0
numsignificant5 <- 0
numsignificant10 <- 0
for (mypoint in kp3:nmkm3) {
j <- 0
numgqtests <- numgqtests + 1
for (myalt in c('greater', 'two.sided', 'less')) {
j <- j + 1
gqarr[mypoint-kp3+1,j] <- gqtest(mylm, point=mypoint, alternative=myalt)$p.value
}
if (gqarr[mypoint-kp3+1,2] < 0.01) numsignificant1 <- numsignificant1 + 1
if (gqarr[mypoint-kp3+1,2] < 0.05) numsignificant5 <- numsignificant5 + 1
if (gqarr[mypoint-kp3+1,2] < 0.10) numsignificant10 <- numsignificant10 + 1
}
gqarr
}
bitmap(file='test0.png')
plot(x[,1], type='l', main='Actuals and Interpolation', ylab='value of Actuals and Interpolation (dots)', xlab='time or index')
points(x[,1]-mysum$resid)
grid()
dev.off()
bitmap(file='test1.png')
plot(mysum$resid, type='b', pch=19, main='Residuals', ylab='value of Residuals', xlab='time or index')
grid()
dev.off()
bitmap(file='test2.png')
hist(mysum$resid, main='Residual Histogram', xlab='values of Residuals')
grid()
dev.off()
bitmap(file='test3.png')
densityplot(~mysum$resid,col='black',main='Residual Density Plot', xlab='values of Residuals')
dev.off()
bitmap(file='test4.png')
qqnorm(mysum$resid, main='Residual Normal Q-Q Plot')
qqline(mysum$resid)
grid()
dev.off()
(myerror <- as.ts(mysum$resid))
bitmap(file='test5.png')
dum <- cbind(lag(myerror,k=1),myerror)
dum
dum1 <- dum[2:length(myerror),]
dum1
z <- as.data.frame(dum1)
z
plot(z,main=paste('Residual Lag plot, lowess, and regression line'), ylab='values of Residuals', xlab='lagged values of Residuals')
lines(lowess(z))
abline(lm(z))
grid()
dev.off()
bitmap(file='test6.png')
acf(mysum$resid, lag.max=length(mysum$resid)/2, main='Residual Autocorrelation Function')
grid()
dev.off()
bitmap(file='test7.png')
pacf(mysum$resid, lag.max=length(mysum$resid)/2, main='Residual Partial Autocorrelation Function')
grid()
dev.off()
bitmap(file='test8.png')
opar <- par(mfrow = c(2,2), oma = c(0, 0, 1.1, 0))
plot(mylm, las = 1, sub='Residual Diagnostics')
par(opar)
dev.off()
if (n > n25) {
bitmap(file='test9.png')
plot(kp3:nmkm3,gqarr[,2], main='Goldfeld-Quandt test',ylab='2-sided p-value',xlab='breakpoint')
grid()
dev.off()
}
load(file='createtable')
a<-table.start()
a<-table.row.start(a)
a<-table.element(a, 'Multiple Linear Regression - Estimated Regression Equation', 1, TRUE)
a<-table.row.end(a)
myeq <- colnames(x)[1]
myeq <- paste(myeq, '[t] = ', sep='')
for (i in 1:k){
if (mysum$coefficients[i,1] > 0) myeq <- paste(myeq, '+', '')
myeq <- paste(myeq, mysum$coefficients[i,1], sep=' ')
if (rownames(mysum$coefficients)[i] != '(Intercept)') {
myeq <- paste(myeq, rownames(mysum$coefficients)[i], sep='')
if (rownames(mysum$coefficients)[i] != 't') myeq <- paste(myeq, '[t]', sep='')
}
}
myeq <- paste(myeq, ' + e[t]')
a<-table.row.start(a)
a<-table.element(a, myeq)
a<-table.row.end(a)
a<-table.end(a)
table.save(a,file='mytable1.tab')
a<-table.start()
a<-table.row.start(a)
a<-table.element(a,hyperlink('ols1.htm','Multiple Linear Regression - Ordinary Least Squares',''), 6, TRUE)
a<-table.row.end(a)
a<-table.row.start(a)
a<-table.element(a,'Variable',header=TRUE)
a<-table.element(a,'Parameter',header=TRUE)
a<-table.element(a,'S.D.',header=TRUE)
a<-table.element(a,'T-STAT
H0: parameter = 0',header=TRUE)
a<-table.element(a,'2-tail p-value',header=TRUE)
a<-table.element(a,'1-tail p-value',header=TRUE)
a<-table.row.end(a)
for (i in 1:k){
a<-table.row.start(a)
a<-table.element(a,rownames(mysum$coefficients)[i],header=TRUE)
a<-table.element(a,mysum$coefficients[i,1])
a<-table.element(a, round(mysum$coefficients[i,2],6))
a<-table.element(a, round(mysum$coefficients[i,3],4))
a<-table.element(a, round(mysum$coefficients[i,4],6))
a<-table.element(a, round(mysum$coefficients[i,4]/2,6))
a<-table.row.end(a)
}
a<-table.end(a)
table.save(a,file='mytable2.tab')
a<-table.start()
a<-table.row.start(a)
a<-table.element(a, 'Multiple Linear Regression - Regression Statistics', 2, TRUE)
a<-table.row.end(a)
a<-table.row.start(a)
a<-table.element(a, 'Multiple R',1,TRUE)
a<-table.element(a, sqrt(mysum$r.squared))
a<-table.row.end(a)
a<-table.row.start(a)
a<-table.element(a, 'R-squared',1,TRUE)
a<-table.element(a, mysum$r.squared)
a<-table.row.end(a)
a<-table.row.start(a)
a<-table.element(a, 'Adjusted R-squared',1,TRUE)
a<-table.element(a, mysum$adj.r.squared)
a<-table.row.end(a)
a<-table.row.start(a)
a<-table.element(a, 'F-TEST (value)',1,TRUE)
a<-table.element(a, mysum$fstatistic[1])
a<-table.row.end(a)
a<-table.row.start(a)
a<-table.element(a, 'F-TEST (DF numerator)',1,TRUE)
a<-table.element(a, mysum$fstatistic[2])
a<-table.row.end(a)
a<-table.row.start(a)
a<-table.element(a, 'F-TEST (DF denominator)',1,TRUE)
a<-table.element(a, mysum$fstatistic[3])
a<-table.row.end(a)
a<-table.row.start(a)
a<-table.element(a, 'p-value',1,TRUE)
a<-table.element(a, 1-pf(mysum$fstatistic[1],mysum$fstatistic[2],mysum$fstatistic[3]))
a<-table.row.end(a)
a<-table.row.start(a)
a<-table.element(a, 'Multiple Linear Regression - Residual Statistics', 2, TRUE)
a<-table.row.end(a)
a<-table.row.start(a)
a<-table.element(a, 'Residual Standard Deviation',1,TRUE)
a<-table.element(a, mysum$sigma)
a<-table.row.end(a)
a<-table.row.start(a)
a<-table.element(a, 'Sum Squared Residuals',1,TRUE)
a<-table.element(a, sum(myerror*myerror))
a<-table.row.end(a)
a<-table.end(a)
table.save(a,file='mytable3.tab')
a<-table.start()
a<-table.row.start(a)
a<-table.element(a, 'Multiple Linear Regression - Actuals, Interpolation, and Residuals', 4, TRUE)
a<-table.row.end(a)
a<-table.row.start(a)
a<-table.element(a, 'Time or Index', 1, TRUE)
a<-table.element(a, 'Actuals', 1, TRUE)
a<-table.element(a, 'Interpolation
Forecast', 1, TRUE)
a<-table.element(a, 'Residuals
Prediction Error', 1, TRUE)
a<-table.row.end(a)
for (i in 1:n) {
a<-table.row.start(a)
a<-table.element(a,i, 1, TRUE)
a<-table.element(a,x[i])
a<-table.element(a,x[i]-mysum$resid[i])
a<-table.element(a,mysum$resid[i])
a<-table.row.end(a)
}
a<-table.end(a)
table.save(a,file='mytable4.tab')
if (n > n25) {
a<-table.start()
a<-table.row.start(a)
a<-table.element(a,'Goldfeld-Quandt test for Heteroskedasticity',4,TRUE)
a<-table.row.end(a)
a<-table.row.start(a)
a<-table.element(a,'p-values',header=TRUE)
a<-table.element(a,'Alternative Hypothesis',3,header=TRUE)
a<-table.row.end(a)
a<-table.row.start(a)
a<-table.element(a,'breakpoint index',header=TRUE)
a<-table.element(a,'greater',header=TRUE)
a<-table.element(a,'2-sided',header=TRUE)
a<-table.element(a,'less',header=TRUE)
a<-table.row.end(a)
for (mypoint in kp3:nmkm3) {
a<-table.row.start(a)
a<-table.element(a,mypoint,header=TRUE)
a<-table.element(a,gqarr[mypoint-kp3+1,1])
a<-table.element(a,gqarr[mypoint-kp3+1,2])
a<-table.element(a,gqarr[mypoint-kp3+1,3])
a<-table.row.end(a)
}
a<-table.end(a)
table.save(a,file='mytable5.tab')
a<-table.start()
a<-table.row.start(a)
a<-table.element(a,'Meta Analysis of Goldfeld-Quandt test for Heteroskedasticity',4,TRUE)
a<-table.row.end(a)
a<-table.row.start(a)
a<-table.element(a,'Description',header=TRUE)
a<-table.element(a,'# significant tests',header=TRUE)
a<-table.element(a,'% significant tests',header=TRUE)
a<-table.element(a,'OK/NOK',header=TRUE)
a<-table.row.end(a)
a<-table.row.start(a)
a<-table.element(a,'1% type I error level',header=TRUE)
a<-table.element(a,numsignificant1)
a<-table.element(a,numsignificant1/numgqtests)
if (numsignificant1/numgqtests < 0.01) dum <- 'OK' else dum <- 'NOK'
a<-table.element(a,dum)
a<-table.row.end(a)
a<-table.row.start(a)
a<-table.element(a,'5% type I error level',header=TRUE)
a<-table.element(a,numsignificant5)
a<-table.element(a,numsignificant5/numgqtests)
if (numsignificant5/numgqtests < 0.05) dum <- 'OK' else dum <- 'NOK'
a<-table.element(a,dum)
a<-table.row.end(a)
a<-table.row.start(a)
a<-table.element(a,'10% type I error level',header=TRUE)
a<-table.element(a,numsignificant10)
a<-table.element(a,numsignificant10/numgqtests)
if (numsignificant10/numgqtests < 0.1) dum <- 'OK' else dum <- 'NOK'
a<-table.element(a,dum)
a<-table.row.end(a)
a<-table.end(a)
table.save(a,file='mytable6.tab')
}