| ANOVA Model | ||||||||
| xdf2$accuracy ~ xdf2$group * xdf2$cond | ||||||||
| names | (Intercept) | xdf2$groupgp2 | xdf2$condl500 | xdf2$conds1000 | xdf2$conds500 | xdf2$groupgp2:xdf2$condl500 | xdf2$groupgp2:xdf2$conds1000 | xdf2$groupgp2:xdf2$conds500 |
| means | 3.2362 | -0.84468 | -0.19286 | -0.40442 | -0.21037 | 0.65308 | 0.88876 | 0.8797 |
| ANOVA Statistics | |||||
| Df | Sum Sq | Mean Sq | F value | Pr(>F) | |
| 1 | |||||
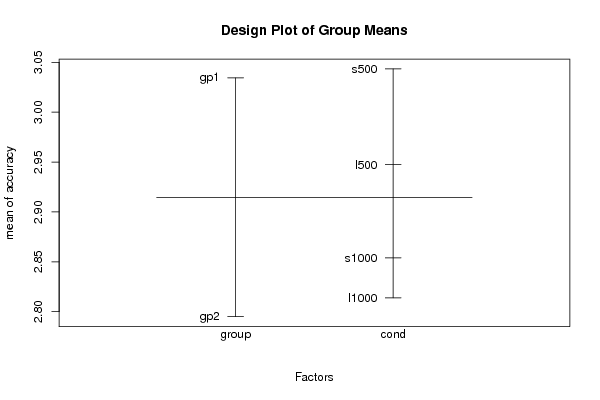
| xdf2$group | 1 | 1.6034 | 1.6034 | 1.3986 | 0.23966 |
| xdf2$cond | 1 | 0.88202 | 0.29401 | 0.25645 | 0.85658 |
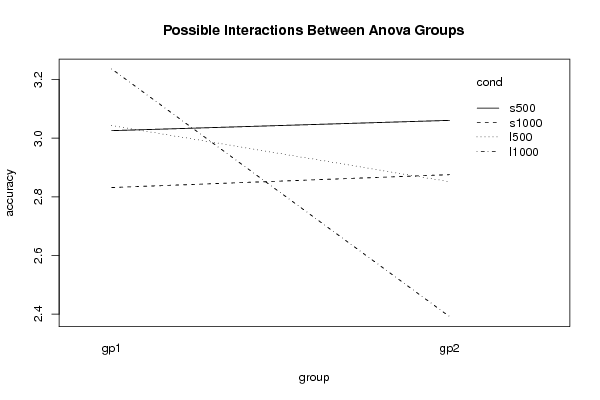
| xdf2$group:xdf2$cond | 1 | 3.6702 | 1.2234 | 1.0671 | 0.36642 |
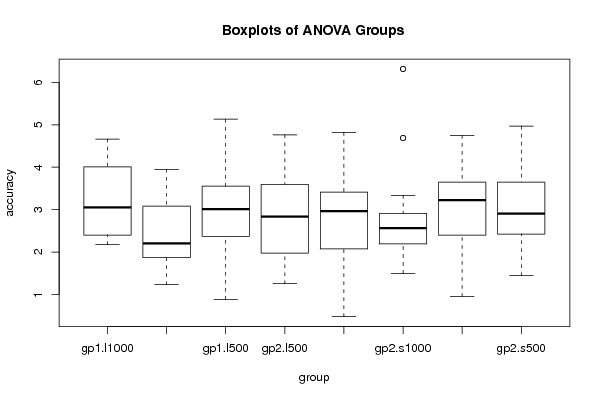
| Residuals | 104 | 119.23 | 1.1464 | ||
| Tukey Honest Significant Difference Comparisons | ||||
| diff | lwr | upr | p adj | |
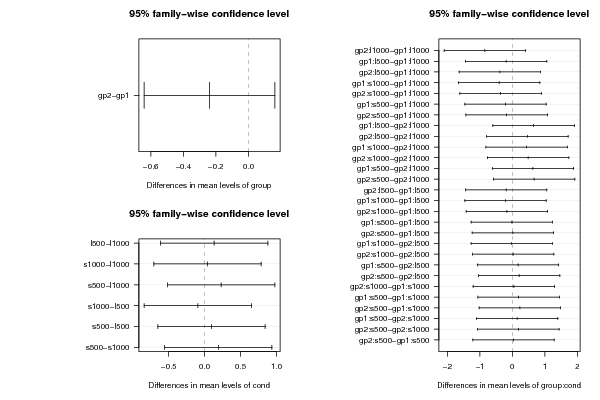
| gp2-gp1 | -0.2393 | -0.64056 | 0.16196 | 0.23966 |
| l500-l1000 | 0.13368 | -0.61351 | 0.88086 | 0.96607 |
| s1000-l1000 | 0.039963 | -0.70722 | 0.78715 | 0.99902 |
| s500-l1000 | 0.22948 | -0.51771 | 0.97666 | 0.85338 |
| s1000-l500 | -0.093714 | -0.8409 | 0.65347 | 0.98781 |
| s500-l500 | 0.095802 | -0.65138 | 0.84299 | 0.987 |
| s500-s1000 | 0.18952 | -0.55767 | 0.9367 | 0.91098 |
| gp2:l1000-gp1:l1000 | -0.84468 | -2.0966 | 0.40726 | 0.43002 |
| gp1:l500-gp1:l1000 | -0.19286 | -1.4448 | 1.0591 | 0.99974 |
| gp2:l500-gp1:l1000 | -0.38447 | -1.6364 | 0.86747 | 0.98014 |
| gp1:s1000-gp1:l1000 | -0.40442 | -1.6564 | 0.84752 | 0.97359 |
| gp2:s1000-gp1:l1000 | -0.36034 | -1.6123 | 0.8916 | 0.98634 |
| gp1:s500-gp1:l1000 | -0.21037 | -1.4623 | 1.0416 | 0.99953 |
| gp2:s500-gp1:l1000 | -0.17536 | -1.4273 | 1.0766 | 0.99986 |
| gp1:l500-gp2:l1000 | 0.65182 | -0.60012 | 1.9038 | 0.7429 |
| gp2:l500-gp2:l1000 | 0.46021 | -0.79173 | 1.7122 | 0.94698 |
| gp1:s1000-gp2:l1000 | 0.44026 | -0.81168 | 1.6922 | 0.95802 |
| gp2:s1000-gp2:l1000 | 0.48434 | -0.7676 | 1.7363 | 0.93115 |
| gp1:s500-gp2:l1000 | 0.63431 | -0.61763 | 1.8863 | 0.76839 |
| gp2:s500-gp2:l1000 | 0.66933 | -0.58261 | 1.9213 | 0.7164 |
| gp2:l500-gp1:l500 | -0.1916 | -1.4435 | 1.0603 | 0.99975 |
| gp1:s1000-gp1:l500 | -0.21156 | -1.4635 | 1.0404 | 0.99952 |
| gp2:s1000-gp1:l500 | -0.16747 | -1.4194 | 1.0845 | 0.9999 |
| gp1:s500-gp1:l500 | -0.017507 | -1.2694 | 1.2344 | 1 |
| gp2:s500-gp1:l500 | 0.017507 | -1.2344 | 1.2694 | 1 |
| gp1:s1000-gp2:l500 | -0.019953 | -1.2719 | 1.232 | 1 |
| gp2:s1000-gp2:l500 | 0.02413 | -1.2278 | 1.2761 | 1 |
| gp1:s500-gp2:l500 | 0.1741 | -1.0778 | 1.426 | 0.99987 |
| gp2:s500-gp2:l500 | 0.20911 | -1.0428 | 1.4611 | 0.99955 |
| gp2:s1000-gp1:s1000 | 0.044083 | -1.2079 | 1.296 | 1 |
| gp1:s500-gp1:s1000 | 0.19405 | -1.0579 | 1.446 | 0.99973 |
| gp2:s500-gp1:s1000 | 0.22906 | -1.0229 | 1.481 | 0.99919 |
| gp1:s500-gp2:s1000 | 0.14997 | -1.102 | 1.4019 | 0.99995 |
| gp2:s500-gp2:s1000 | 0.18498 | -1.067 | 1.4369 | 0.9998 |
| gp2:s500-gp1:s500 | 0.035014 | -1.2169 | 1.287 | 1 |
| Levenes Test for Homogeneity of Variance | |||
| Df | F value | Pr(>F) | |
| Group | 7 | 0.47842 | 0.84832 |
| 104 | |||