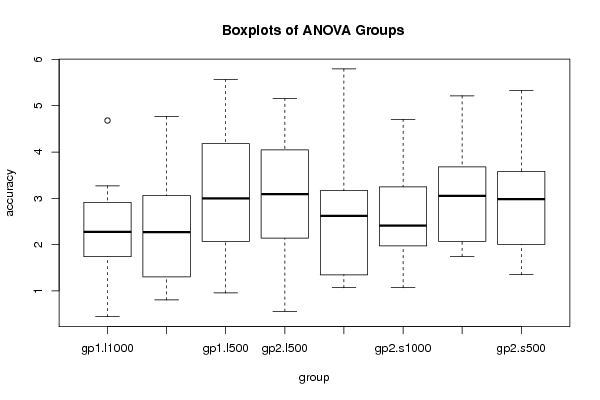
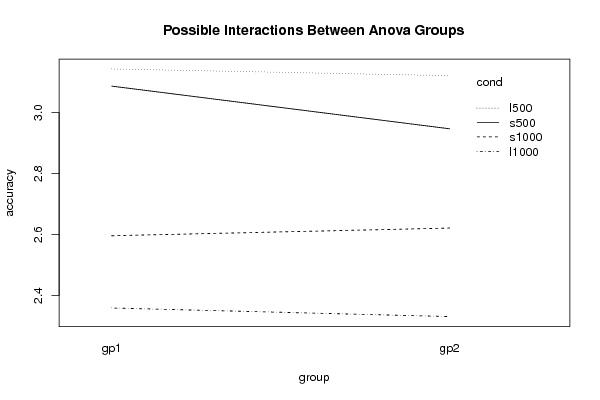
| ANOVA Model | ||||||||
| xdf2$accuracy ~ xdf2$group * xdf2$cond | ||||||||
| names | (Intercept) | xdf2$groupgp2 | xdf2$condl500 | xdf2$conds1000 | xdf2$conds500 | xdf2$groupgp2:xdf2$condl500 | xdf2$groupgp2:xdf2$conds1000 | xdf2$groupgp2:xdf2$conds500 |
| means | 2.3584 | -0.028491 | 0.78507 | 0.23727 | 0.72866 | 0.0061208 | 0.053912 | -0.11157 |
| ANOVA Statistics | |||||
| Df | Sum Sq | Mean Sq | F value | Pr(>F) | |
| 1 | |||||
| xdf2$group | 1 | 0.047931 | 0.047931 | 0.032165 | 0.85802 |
| xdf2$cond | 1 | 11.189 | 3.7298 | 2.5029 | 0.06336 |
| xdf2$group:xdf2$cond | 1 | 0.10309 | 0.034363 | 0.02306 | 0.99523 |
| Residuals | 104 | 154.98 | 1.4902 | ||
| Tukey Honest Significant Difference Comparisons | ||||
| diff | lwr | upr | p adj | |
| gp2-gp1 | -0.041374 | -0.49885 | 0.4161 | 0.85802 |
| l500-l1000 | 0.78813 | -0.063735 | 1.64 | 0.080378 |
| s1000-l1000 | 0.26423 | -0.58764 | 1.1161 | 0.84966 |
| s500-l1000 | 0.67287 | -0.17899 | 1.5247 | 0.17238 |
| s1000-l500 | -0.5239 | -1.3758 | 0.32796 | 0.37987 |
| s500-l500 | -0.11525 | -0.96712 | 0.73661 | 0.9848 |
| s500-s1000 | 0.40865 | -0.44322 | 1.2605 | 0.59505 |
| gp2:l1000-gp1:l1000 | -0.028491 | -1.4558 | 1.3988 | 1 |
| gp1:l500-gp1:l1000 | 0.78507 | -0.64226 | 2.2124 | 0.68625 |
| gp2:l500-gp1:l1000 | 0.7627 | -0.66463 | 2.19 | 0.71694 |
| gp1:s1000-gp1:l1000 | 0.23727 | -1.1901 | 1.6646 | 0.99957 |
| gp2:s1000-gp1:l1000 | 0.26269 | -1.1646 | 1.69 | 0.99915 |
| gp1:s500-gp1:l1000 | 0.72866 | -0.69867 | 2.156 | 0.7615 |
| gp2:s500-gp1:l1000 | 0.5886 | -0.83873 | 2.0159 | 0.90578 |
| gp1:l500-gp2:l1000 | 0.81356 | -0.61377 | 2.2409 | 0.64595 |
| gp2:l500-gp2:l1000 | 0.79119 | -0.63614 | 2.2185 | 0.6777 |
| gp1:s1000-gp2:l1000 | 0.26576 | -1.1616 | 1.6931 | 0.99909 |
| gp2:s1000-gp2:l1000 | 0.29118 | -1.1361 | 1.7185 | 0.99836 |
| gp1:s500-gp2:l1000 | 0.75715 | -0.67018 | 2.1845 | 0.7244 |
| gp2:s500-gp2:l1000 | 0.61709 | -0.81024 | 2.0444 | 0.88231 |
| gp2:l500-gp1:l500 | -0.02237 | -1.4497 | 1.405 | 1 |
| gp1:s1000-gp1:l500 | -0.5478 | -1.9751 | 0.87953 | 0.93387 |
| gp2:s1000-gp1:l500 | -0.52237 | -1.9497 | 0.90496 | 0.94819 |
| gp1:s500-gp1:l500 | -0.056411 | -1.4837 | 1.3709 | 1 |
| gp2:s500-gp1:l500 | -0.19647 | -1.6238 | 1.2309 | 0.99988 |
| gp1:s1000-gp2:l500 | -0.52543 | -1.9528 | 0.9019 | 0.94659 |
| gp2:s1000-gp2:l500 | -0.5 | -1.9273 | 0.92733 | 0.95888 |
| gp1:s500-gp2:l500 | -0.034041 | -1.4614 | 1.3933 | 1 |
| gp2:s500-gp2:l500 | -0.1741 | -1.6014 | 1.2532 | 0.99995 |
| gp2:s1000-gp1:s1000 | 0.025421 | -1.4019 | 1.4528 | 1 |
| gp1:s500-gp1:s1000 | 0.49138 | -0.93595 | 1.9187 | 0.96255 |
| gp2:s500-gp1:s1000 | 0.35133 | -1.076 | 1.7787 | 0.99466 |
| gp1:s500-gp2:s1000 | 0.46596 | -0.96137 | 1.8933 | 0.97199 |
| gp2:s500-gp2:s1000 | 0.32591 | -1.1014 | 1.7532 | 0.99665 |
| gp2:s500-gp1:s500 | -0.14006 | -1.5674 | 1.2873 | 0.99999 |
| Levenes Test for Homogeneity of Variance | |||
| Df | F value | Pr(>F) | |
| Group | 7 | 0.58229 | 0.76897 |
| 104 | |||