Free Statistics

of Irreproducible Research!

Author's title

Author*Unverified author*
R Software Modulerwasp_multipleregression.wasp
Title produced by softwareMultiple Regression
Date of computationSun, 17 Apr 2011 22:56:49 +0000
Cite this page as followsStatistical Computations at FreeStatistics.org, Office for Research Development and Education, URL https://freestatistics.org/blog/index.php?v=date/2011/Apr/18/t1303080843dzi683nqwrfvwnf.htm/, Retrieved Wed, 08 May 2024 11:13:51 +0000
Statistical Computations at FreeStatistics.org, Office for Research Development and Education, URL https://freestatistics.org/blog/index.php?pk=120611, Retrieved Wed, 08 May 2024 11:13:51 +0000
QR Codes:

Original text written by user:
IsPrivate?No (this computation is public)
User-defined keywords
Estimated Impact185
Family? (F = Feedback message, R = changed R code, M = changed R Module, P = changed Parameters, D = changed Data)
-       [Multiple Regression] [earning merck] [2011-04-17 22:56:49] [d41d8cd98f00b204e9800998ecf8427e] [Current]
Feedback Forum

Post a new message
Dataseries X:
0.79	4.372157	0.358171	0.768038
0.9	4.37581	0.402526	0.778505
0.83	4.378543	0.201355	0.756444
0.74	4.38421	0.210216	0.761823
0.88	4.390016	0.201257	0.761285
0.8	4.394889	0.194135	0.771903
0.856	4.4004	0.203109	0.789904
0.9	4.402502	0.215335	0.771369
0.8	4.406353	0.186933	0.771341
0.76	4.409155	0.212281	0.765422
0.82	4.415841	0.300082	0.756006
0.85	4.42116	0.316122	0.741814
0.5	4.427843	0.24835	0.751497
0.51	4.431814	0.24658	0.778627
0.73	4.437513	0.252709	0.799937
0.79	4.439901	0.286081	0.774228
0.64	4.441522	0.288254	0.771279
0.68	4.445791	0.326279	0.787727
0.62	4.449679	0.320449	0.762896
0.62	4.454067	0.27137	0.776688
0.72	4.461934	0.253831	0.770499
0.85	4.46565	0.288447	0.812129
0.81	4.47138	0.303094	0.796086
0.72	4.476353	0.327162	0.781913
0.67	4.482516	0.35257	0.811975
0.83	4.488015	0.275083	0.364749
0.83	4.491572	0.284799	0.368819
0.8	4.495281	0.26807	0.81384
0.81	4.499013	0.277758	0.820645
0.79	4.505014	0.288119	0.352631
0.77	4.512458	0.291262	0.344194
0.72	4.517143	0.298976	0.391427
0.82	4.520863	0.275749	0.405785
0.85	4.526598	0.247584	0.394203
0.79	4.534546	0.24387	0.378895
0.72	4.53802	0.242759	0.427009
0.77	4.547529	0.25426	0.433414
0.8	4.549285	0.270391	0.466915
0.74	4.552936	0.284539	0.453939
0.65	4.553422	0.237426	0.481904
0.68	4.558144	0.249957	0.467294
0.65	4.557134	0.247617	0.454965
0.63	4.558865	0.241152	0.448804
0.55	4.563113	0.25159	0.500405
0.59	4.566379	0.217016	0.481728
0.575	4.569327	0.098371	0.477096
0.55	4.570893	0.140313	0.465967
0.487	4.574841	0.106751	0.50759
0.52	4.578616	0.131664	0.49542
0.495	4.587183	0.134684	0.501743
0.48	4.592299	0.099122	0.499578
0.42	4.598265	0.096562	0.542387
0.435	4.604053	0.116527	0.532769
0.415	4.609274	0.132874	0.534754
0.4	4.615192	0.129996	0.507085
0.35	4.622587	0.116976	0.533487


Summary of computational transaction
Raw Inputview raw input (R code)
Raw Outputview raw output of R engine
Computing time9 seconds
R Server'Gwilym Jenkins' @ www.wessa.org

\begin{tabular}{lllllllll}
\hline
Summary of computational transaction \tabularnewline
Raw Input & view raw input (R code)  \tabularnewline
Raw Output & view raw output of R engine  \tabularnewline
Computing time & 9 seconds \tabularnewline
R Server & 'Gwilym Jenkins' @ www.wessa.org \tabularnewline
\hline
\end{tabular}
%Source: https://freestatistics.org/blog/index.php?pk=120611&T=0

[TABLE]
[ROW][C]Summary of computational transaction[/C][/ROW]
[ROW][C]Raw Input[/C][C]view raw input (R code) [/C][/ROW]
[ROW][C]Raw Output[/C][C]view raw output of R engine [/C][/ROW]
[ROW][C]Computing time[/C][C]9 seconds[/C][/ROW]
[ROW][C]R Server[/C][C]'Gwilym Jenkins' @ www.wessa.org[/C][/ROW]
[/TABLE]
Source: https://freestatistics.org/blog/index.php?pk=120611&T=0

Globally Unique Identifier (entire table): ba.freestatistics.org/blog/index.php?pk=120611&T=0

As an alternative you can also use a QR Code:  

The GUIDs for individual cells are displayed in the table below:

Summary of computational transaction
Raw Inputview raw input (R code)
Raw Outputview raw output of R engine
Computing time9 seconds
R Server'Gwilym Jenkins' @ www.wessa.org


Multiple Linear Regression - Estimated Regression Equation
basiceps[t] = -23.9293930240113 + 5.70542661862854gdp[t] + 0.406023757176962`D/E`[t] -0.304011213321105GM[t] -0.0331158042092614t + e[t]

\begin{tabular}{lllllllll}
\hline
Multiple Linear Regression - Estimated Regression Equation \tabularnewline
basiceps[t] =  -23.9293930240113 +  5.70542661862854gdp[t] +  0.406023757176962`D/E`[t] -0.304011213321105GM[t] -0.0331158042092614t  + e[t] \tabularnewline
\hline
\end{tabular}
%Source: https://freestatistics.org/blog/index.php?pk=120611&T=1

[TABLE]
[ROW][C]Multiple Linear Regression - Estimated Regression Equation[/C][/ROW]
[ROW][C]basiceps[t] =  -23.9293930240113 +  5.70542661862854gdp[t] +  0.406023757176962`D/E`[t] -0.304011213321105GM[t] -0.0331158042092614t  + e[t][/C][/ROW]
[/TABLE]
Source: https://freestatistics.org/blog/index.php?pk=120611&T=1

Globally Unique Identifier (entire table): ba.freestatistics.org/blog/index.php?pk=120611&T=1

As an alternative you can also use a QR Code:  

The GUIDs for individual cells are displayed in the table below:

Multiple Linear Regression - Estimated Regression Equation
basiceps[t] = -23.9293930240113 + 5.70542661862854gdp[t] + 0.406023757176962`D/E`[t] -0.304011213321105GM[t] -0.0331158042092614t + e[t]


Multiple Linear Regression - Ordinary Least Squares
VariableParameterS.D.T-STATH0: parameter = 02-tail p-value1-tail p-value
(Intercept)-23.929393024011313.45014-1.77910.081180.04059
gdp5.705426618628543.0768331.85430.069480.03474
`D/E`0.4060237571769620.2167511.87320.0667730.033387
GM-0.3040112133211050.110187-2.7590.0080310.004015
t-0.03311580420926140.013768-2.40530.0198250.009912

\begin{tabular}{lllllllll}
\hline
Multiple Linear Regression - Ordinary Least Squares \tabularnewline
Variable & Parameter & S.D. & T-STATH0: parameter = 0 & 2-tail p-value & 1-tail p-value \tabularnewline
(Intercept) & -23.9293930240113 & 13.45014 & -1.7791 & 0.08118 & 0.04059 \tabularnewline
gdp & 5.70542661862854 & 3.076833 & 1.8543 & 0.06948 & 0.03474 \tabularnewline
`D/E` & 0.406023757176962 & 0.216751 & 1.8732 & 0.066773 & 0.033387 \tabularnewline
GM & -0.304011213321105 & 0.110187 & -2.759 & 0.008031 & 0.004015 \tabularnewline
t & -0.0331158042092614 & 0.013768 & -2.4053 & 0.019825 & 0.009912 \tabularnewline
\hline
\end{tabular}
%Source: https://freestatistics.org/blog/index.php?pk=120611&T=2

[TABLE]
[ROW][C]Multiple Linear Regression - Ordinary Least Squares[/C][/ROW]
[ROW][C]Variable[/C][C]Parameter[/C][C]S.D.[/C][C]T-STATH0: parameter = 0[/C][C]2-tail p-value[/C][C]1-tail p-value[/C][/ROW]
[ROW][C](Intercept)[/C][C]-23.9293930240113[/C][C]13.45014[/C][C]-1.7791[/C][C]0.08118[/C][C]0.04059[/C][/ROW]
[ROW][C]gdp[/C][C]5.70542661862854[/C][C]3.076833[/C][C]1.8543[/C][C]0.06948[/C][C]0.03474[/C][/ROW]
[ROW][C]`D/E`[/C][C]0.406023757176962[/C][C]0.216751[/C][C]1.8732[/C][C]0.066773[/C][C]0.033387[/C][/ROW]
[ROW][C]GM[/C][C]-0.304011213321105[/C][C]0.110187[/C][C]-2.759[/C][C]0.008031[/C][C]0.004015[/C][/ROW]
[ROW][C]t[/C][C]-0.0331158042092614[/C][C]0.013768[/C][C]-2.4053[/C][C]0.019825[/C][C]0.009912[/C][/ROW]
[/TABLE]
Source: https://freestatistics.org/blog/index.php?pk=120611&T=2

Globally Unique Identifier (entire table): ba.freestatistics.org/blog/index.php?pk=120611&T=2

As an alternative you can also use a QR Code:  

The GUIDs for individual cells are displayed in the table below:

Multiple Linear Regression - Ordinary Least Squares
VariableParameterS.D.T-STATH0: parameter = 02-tail p-value1-tail p-value
(Intercept)-23.929393024011313.45014-1.77910.081180.04059
gdp5.705426618628543.0768331.85430.069480.03474
`D/E`0.4060237571769620.2167511.87320.0667730.033387
GM-0.3040112133211050.110187-2.7590.0080310.004015
t-0.03311580420926140.013768-2.40530.0198250.009912


Multiple Linear Regression - Regression Statistics
Multiple R0.830537538535335
R-squared0.689792602916333
Adjusted R-squared0.665462610988203
F-TEST (value)28.3515343923639
F-TEST (DF numerator)4
F-TEST (DF denominator)51
p-value2.02482475231136e-12
Multiple Linear Regression - Residual Statistics
Residual Standard Deviation0.0848051288500866
Sum Squared Residuals0.36678740384327

\begin{tabular}{lllllllll}
\hline
Multiple Linear Regression - Regression Statistics \tabularnewline
Multiple R & 0.830537538535335 \tabularnewline
R-squared & 0.689792602916333 \tabularnewline
Adjusted R-squared & 0.665462610988203 \tabularnewline
F-TEST (value) & 28.3515343923639 \tabularnewline
F-TEST (DF numerator) & 4 \tabularnewline
F-TEST (DF denominator) & 51 \tabularnewline
p-value & 2.02482475231136e-12 \tabularnewline
Multiple Linear Regression - Residual Statistics \tabularnewline
Residual Standard Deviation & 0.0848051288500866 \tabularnewline
Sum Squared Residuals & 0.36678740384327 \tabularnewline
\hline
\end{tabular}
%Source: https://freestatistics.org/blog/index.php?pk=120611&T=3

[TABLE]
[ROW][C]Multiple Linear Regression - Regression Statistics[/C][/ROW]
[ROW][C]Multiple R[/C][C]0.830537538535335[/C][/ROW]
[ROW][C]R-squared[/C][C]0.689792602916333[/C][/ROW]
[ROW][C]Adjusted R-squared[/C][C]0.665462610988203[/C][/ROW]
[ROW][C]F-TEST (value)[/C][C]28.3515343923639[/C][/ROW]
[ROW][C]F-TEST (DF numerator)[/C][C]4[/C][/ROW]
[ROW][C]F-TEST (DF denominator)[/C][C]51[/C][/ROW]
[ROW][C]p-value[/C][C]2.02482475231136e-12[/C][/ROW]
[ROW][C]Multiple Linear Regression - Residual Statistics[/C][/ROW]
[ROW][C]Residual Standard Deviation[/C][C]0.0848051288500866[/C][/ROW]
[ROW][C]Sum Squared Residuals[/C][C]0.36678740384327[/C][/ROW]
[/TABLE]
Source: https://freestatistics.org/blog/index.php?pk=120611&T=3

Globally Unique Identifier (entire table): ba.freestatistics.org/blog/index.php?pk=120611&T=3

As an alternative you can also use a QR Code:  

The GUIDs for individual cells are displayed in the table below:

Multiple Linear Regression - Regression Statistics
Multiple R0.830537538535335
R-squared0.689792602916333
Adjusted R-squared0.665462610988203
F-TEST (value)28.3515343923639
F-TEST (DF numerator)4
F-TEST (DF denominator)51
p-value2.02482475231136e-12
Multiple Linear Regression - Residual Statistics
Residual Standard Deviation0.0848051288500866
Sum Squared Residuals0.36678740384327


Multiple Linear Regression - Actuals, Interpolation, and Residuals
Time or IndexActualsInterpolationForecastResidualsPrediction Error
10.790.894445871277677-0.104445871277677
20.90.8969990888859860.00300091111401407
30.830.8045028017474610.0254971982525388
40.740.805682150381863-0.0656821503818628
50.880.8022180443125760.0777819556874244
60.80.7907850917542330.0092149082457671
70.8560.7872830449861480.0687169550138521
80.90.7767589418233950.123241058176605
90.80.7540913610851050.0459086389148948
100.760.749053494829810.0109465051701899
110.820.7925960344812260.0274039655187736
120.850.8006545426610220.0493454573389778
130.50.775207321894069-0.275207321894069
140.510.755781280519776-0.245781280519776
150.730.751190743261943-0.0211907432619431
160.790.7530651469257480.0369348530742524
170.640.730976657957713-0.0909766579577131
180.680.732655996913325-0.0526559969133246
190.620.726904675330925-0.106904675330925
200.620.694704120491596-0.0747041204915959
210.720.7012331822132030.0187668177867968
220.850.6907176748866450.159282325113355
230.810.7011182470688050.108881752931195
240.720.7104564601481170.00954353985188322
250.670.713680266716961-0.0436802667169608
260.830.8164387594999080.0135612405000921
270.830.8063247589596220.0236752410403783
280.80.6522866364816720.147713363518328
290.810.642328246266010.16767175373399
300.790.7899390233345146.09766654858148e-05
310.770.803135490149919-0.0331354901499185
320.720.785522315273001-0.0655223152730008
330.820.7598349912762260.0601650087237738
340.850.7515252074765930.098474792523407
350.790.7669019654515550.0230980345484453
360.720.738528525403457-0.0185285254034574
370.770.7623881103207030.00761188967929737
380.80.7356559248233060.0643440751766939
390.740.733059906819250.00694009318075026
400.650.675086269094241-0.0250862690942414
410.680.678440976905950.00155902309404949
420.650.6423607504691110.00763924953088872
430.630.618369109231820.0116308907681797
440.550.598040750657327-0.0480407506573266
450.590.5751990218350680.014800978164932
460.5750.5121383065673660.062861693432634
470.550.5083699896594410.0416300103405593
480.4870.4714983816700890.015501618329911
490.520.4737356492748180.0462643507251817
500.4950.4888021637521890.00619783624781115
510.480.4710944895479450.00890551045205517
520.420.457963423695985-0.0379634236959848
530.4350.46890087291711-0.0339008729171104
540.4150.471606909183836-0.0566069091838363
550.40.479498969591847-0.0794989695918467
560.350.475261861854795-0.125261861854795

\begin{tabular}{lllllllll}
\hline
Multiple Linear Regression - Actuals, Interpolation, and Residuals \tabularnewline
Time or Index & Actuals & InterpolationForecast & ResidualsPrediction Error \tabularnewline
1 & 0.79 & 0.894445871277677 & -0.104445871277677 \tabularnewline
2 & 0.9 & 0.896999088885986 & 0.00300091111401407 \tabularnewline
3 & 0.83 & 0.804502801747461 & 0.0254971982525388 \tabularnewline
4 & 0.74 & 0.805682150381863 & -0.0656821503818628 \tabularnewline
5 & 0.88 & 0.802218044312576 & 0.0777819556874244 \tabularnewline
6 & 0.8 & 0.790785091754233 & 0.0092149082457671 \tabularnewline
7 & 0.856 & 0.787283044986148 & 0.0687169550138521 \tabularnewline
8 & 0.9 & 0.776758941823395 & 0.123241058176605 \tabularnewline
9 & 0.8 & 0.754091361085105 & 0.0459086389148948 \tabularnewline
10 & 0.76 & 0.74905349482981 & 0.0109465051701899 \tabularnewline
11 & 0.82 & 0.792596034481226 & 0.0274039655187736 \tabularnewline
12 & 0.85 & 0.800654542661022 & 0.0493454573389778 \tabularnewline
13 & 0.5 & 0.775207321894069 & -0.275207321894069 \tabularnewline
14 & 0.51 & 0.755781280519776 & -0.245781280519776 \tabularnewline
15 & 0.73 & 0.751190743261943 & -0.0211907432619431 \tabularnewline
16 & 0.79 & 0.753065146925748 & 0.0369348530742524 \tabularnewline
17 & 0.64 & 0.730976657957713 & -0.0909766579577131 \tabularnewline
18 & 0.68 & 0.732655996913325 & -0.0526559969133246 \tabularnewline
19 & 0.62 & 0.726904675330925 & -0.106904675330925 \tabularnewline
20 & 0.62 & 0.694704120491596 & -0.0747041204915959 \tabularnewline
21 & 0.72 & 0.701233182213203 & 0.0187668177867968 \tabularnewline
22 & 0.85 & 0.690717674886645 & 0.159282325113355 \tabularnewline
23 & 0.81 & 0.701118247068805 & 0.108881752931195 \tabularnewline
24 & 0.72 & 0.710456460148117 & 0.00954353985188322 \tabularnewline
25 & 0.67 & 0.713680266716961 & -0.0436802667169608 \tabularnewline
26 & 0.83 & 0.816438759499908 & 0.0135612405000921 \tabularnewline
27 & 0.83 & 0.806324758959622 & 0.0236752410403783 \tabularnewline
28 & 0.8 & 0.652286636481672 & 0.147713363518328 \tabularnewline
29 & 0.81 & 0.64232824626601 & 0.16767175373399 \tabularnewline
30 & 0.79 & 0.789939023334514 & 6.09766654858148e-05 \tabularnewline
31 & 0.77 & 0.803135490149919 & -0.0331354901499185 \tabularnewline
32 & 0.72 & 0.785522315273001 & -0.0655223152730008 \tabularnewline
33 & 0.82 & 0.759834991276226 & 0.0601650087237738 \tabularnewline
34 & 0.85 & 0.751525207476593 & 0.098474792523407 \tabularnewline
35 & 0.79 & 0.766901965451555 & 0.0230980345484453 \tabularnewline
36 & 0.72 & 0.738528525403457 & -0.0185285254034574 \tabularnewline
37 & 0.77 & 0.762388110320703 & 0.00761188967929737 \tabularnewline
38 & 0.8 & 0.735655924823306 & 0.0643440751766939 \tabularnewline
39 & 0.74 & 0.73305990681925 & 0.00694009318075026 \tabularnewline
40 & 0.65 & 0.675086269094241 & -0.0250862690942414 \tabularnewline
41 & 0.68 & 0.67844097690595 & 0.00155902309404949 \tabularnewline
42 & 0.65 & 0.642360750469111 & 0.00763924953088872 \tabularnewline
43 & 0.63 & 0.61836910923182 & 0.0116308907681797 \tabularnewline
44 & 0.55 & 0.598040750657327 & -0.0480407506573266 \tabularnewline
45 & 0.59 & 0.575199021835068 & 0.014800978164932 \tabularnewline
46 & 0.575 & 0.512138306567366 & 0.062861693432634 \tabularnewline
47 & 0.55 & 0.508369989659441 & 0.0416300103405593 \tabularnewline
48 & 0.487 & 0.471498381670089 & 0.015501618329911 \tabularnewline
49 & 0.52 & 0.473735649274818 & 0.0462643507251817 \tabularnewline
50 & 0.495 & 0.488802163752189 & 0.00619783624781115 \tabularnewline
51 & 0.48 & 0.471094489547945 & 0.00890551045205517 \tabularnewline
52 & 0.42 & 0.457963423695985 & -0.0379634236959848 \tabularnewline
53 & 0.435 & 0.46890087291711 & -0.0339008729171104 \tabularnewline
54 & 0.415 & 0.471606909183836 & -0.0566069091838363 \tabularnewline
55 & 0.4 & 0.479498969591847 & -0.0794989695918467 \tabularnewline
56 & 0.35 & 0.475261861854795 & -0.125261861854795 \tabularnewline
\hline
\end{tabular}
%Source: https://freestatistics.org/blog/index.php?pk=120611&T=4

[TABLE]
[ROW][C]Multiple Linear Regression - Actuals, Interpolation, and Residuals[/C][/ROW]
[ROW][C]Time or Index[/C][C]Actuals[/C][C]InterpolationForecast[/C][C]ResidualsPrediction Error[/C][/ROW]
[ROW][C]1[/C][C]0.79[/C][C]0.894445871277677[/C][C]-0.104445871277677[/C][/ROW]
[ROW][C]2[/C][C]0.9[/C][C]0.896999088885986[/C][C]0.00300091111401407[/C][/ROW]
[ROW][C]3[/C][C]0.83[/C][C]0.804502801747461[/C][C]0.0254971982525388[/C][/ROW]
[ROW][C]4[/C][C]0.74[/C][C]0.805682150381863[/C][C]-0.0656821503818628[/C][/ROW]
[ROW][C]5[/C][C]0.88[/C][C]0.802218044312576[/C][C]0.0777819556874244[/C][/ROW]
[ROW][C]6[/C][C]0.8[/C][C]0.790785091754233[/C][C]0.0092149082457671[/C][/ROW]
[ROW][C]7[/C][C]0.856[/C][C]0.787283044986148[/C][C]0.0687169550138521[/C][/ROW]
[ROW][C]8[/C][C]0.9[/C][C]0.776758941823395[/C][C]0.123241058176605[/C][/ROW]
[ROW][C]9[/C][C]0.8[/C][C]0.754091361085105[/C][C]0.0459086389148948[/C][/ROW]
[ROW][C]10[/C][C]0.76[/C][C]0.74905349482981[/C][C]0.0109465051701899[/C][/ROW]
[ROW][C]11[/C][C]0.82[/C][C]0.792596034481226[/C][C]0.0274039655187736[/C][/ROW]
[ROW][C]12[/C][C]0.85[/C][C]0.800654542661022[/C][C]0.0493454573389778[/C][/ROW]
[ROW][C]13[/C][C]0.5[/C][C]0.775207321894069[/C][C]-0.275207321894069[/C][/ROW]
[ROW][C]14[/C][C]0.51[/C][C]0.755781280519776[/C][C]-0.245781280519776[/C][/ROW]
[ROW][C]15[/C][C]0.73[/C][C]0.751190743261943[/C][C]-0.0211907432619431[/C][/ROW]
[ROW][C]16[/C][C]0.79[/C][C]0.753065146925748[/C][C]0.0369348530742524[/C][/ROW]
[ROW][C]17[/C][C]0.64[/C][C]0.730976657957713[/C][C]-0.0909766579577131[/C][/ROW]
[ROW][C]18[/C][C]0.68[/C][C]0.732655996913325[/C][C]-0.0526559969133246[/C][/ROW]
[ROW][C]19[/C][C]0.62[/C][C]0.726904675330925[/C][C]-0.106904675330925[/C][/ROW]
[ROW][C]20[/C][C]0.62[/C][C]0.694704120491596[/C][C]-0.0747041204915959[/C][/ROW]
[ROW][C]21[/C][C]0.72[/C][C]0.701233182213203[/C][C]0.0187668177867968[/C][/ROW]
[ROW][C]22[/C][C]0.85[/C][C]0.690717674886645[/C][C]0.159282325113355[/C][/ROW]
[ROW][C]23[/C][C]0.81[/C][C]0.701118247068805[/C][C]0.108881752931195[/C][/ROW]
[ROW][C]24[/C][C]0.72[/C][C]0.710456460148117[/C][C]0.00954353985188322[/C][/ROW]
[ROW][C]25[/C][C]0.67[/C][C]0.713680266716961[/C][C]-0.0436802667169608[/C][/ROW]
[ROW][C]26[/C][C]0.83[/C][C]0.816438759499908[/C][C]0.0135612405000921[/C][/ROW]
[ROW][C]27[/C][C]0.83[/C][C]0.806324758959622[/C][C]0.0236752410403783[/C][/ROW]
[ROW][C]28[/C][C]0.8[/C][C]0.652286636481672[/C][C]0.147713363518328[/C][/ROW]
[ROW][C]29[/C][C]0.81[/C][C]0.64232824626601[/C][C]0.16767175373399[/C][/ROW]
[ROW][C]30[/C][C]0.79[/C][C]0.789939023334514[/C][C]6.09766654858148e-05[/C][/ROW]
[ROW][C]31[/C][C]0.77[/C][C]0.803135490149919[/C][C]-0.0331354901499185[/C][/ROW]
[ROW][C]32[/C][C]0.72[/C][C]0.785522315273001[/C][C]-0.0655223152730008[/C][/ROW]
[ROW][C]33[/C][C]0.82[/C][C]0.759834991276226[/C][C]0.0601650087237738[/C][/ROW]
[ROW][C]34[/C][C]0.85[/C][C]0.751525207476593[/C][C]0.098474792523407[/C][/ROW]
[ROW][C]35[/C][C]0.79[/C][C]0.766901965451555[/C][C]0.0230980345484453[/C][/ROW]
[ROW][C]36[/C][C]0.72[/C][C]0.738528525403457[/C][C]-0.0185285254034574[/C][/ROW]
[ROW][C]37[/C][C]0.77[/C][C]0.762388110320703[/C][C]0.00761188967929737[/C][/ROW]
[ROW][C]38[/C][C]0.8[/C][C]0.735655924823306[/C][C]0.0643440751766939[/C][/ROW]
[ROW][C]39[/C][C]0.74[/C][C]0.73305990681925[/C][C]0.00694009318075026[/C][/ROW]
[ROW][C]40[/C][C]0.65[/C][C]0.675086269094241[/C][C]-0.0250862690942414[/C][/ROW]
[ROW][C]41[/C][C]0.68[/C][C]0.67844097690595[/C][C]0.00155902309404949[/C][/ROW]
[ROW][C]42[/C][C]0.65[/C][C]0.642360750469111[/C][C]0.00763924953088872[/C][/ROW]
[ROW][C]43[/C][C]0.63[/C][C]0.61836910923182[/C][C]0.0116308907681797[/C][/ROW]
[ROW][C]44[/C][C]0.55[/C][C]0.598040750657327[/C][C]-0.0480407506573266[/C][/ROW]
[ROW][C]45[/C][C]0.59[/C][C]0.575199021835068[/C][C]0.014800978164932[/C][/ROW]
[ROW][C]46[/C][C]0.575[/C][C]0.512138306567366[/C][C]0.062861693432634[/C][/ROW]
[ROW][C]47[/C][C]0.55[/C][C]0.508369989659441[/C][C]0.0416300103405593[/C][/ROW]
[ROW][C]48[/C][C]0.487[/C][C]0.471498381670089[/C][C]0.015501618329911[/C][/ROW]
[ROW][C]49[/C][C]0.52[/C][C]0.473735649274818[/C][C]0.0462643507251817[/C][/ROW]
[ROW][C]50[/C][C]0.495[/C][C]0.488802163752189[/C][C]0.00619783624781115[/C][/ROW]
[ROW][C]51[/C][C]0.48[/C][C]0.471094489547945[/C][C]0.00890551045205517[/C][/ROW]
[ROW][C]52[/C][C]0.42[/C][C]0.457963423695985[/C][C]-0.0379634236959848[/C][/ROW]
[ROW][C]53[/C][C]0.435[/C][C]0.46890087291711[/C][C]-0.0339008729171104[/C][/ROW]
[ROW][C]54[/C][C]0.415[/C][C]0.471606909183836[/C][C]-0.0566069091838363[/C][/ROW]
[ROW][C]55[/C][C]0.4[/C][C]0.479498969591847[/C][C]-0.0794989695918467[/C][/ROW]
[ROW][C]56[/C][C]0.35[/C][C]0.475261861854795[/C][C]-0.125261861854795[/C][/ROW]
[/TABLE]
Source: https://freestatistics.org/blog/index.php?pk=120611&T=4

Globally Unique Identifier (entire table): ba.freestatistics.org/blog/index.php?pk=120611&T=4

As an alternative you can also use a QR Code:  

The GUIDs for individual cells are displayed in the table below:

Multiple Linear Regression - Actuals, Interpolation, and Residuals
Time or IndexActualsInterpolationForecastResidualsPrediction Error
10.790.894445871277677-0.104445871277677
20.90.8969990888859860.00300091111401407
30.830.8045028017474610.0254971982525388
40.740.805682150381863-0.0656821503818628
50.880.8022180443125760.0777819556874244
60.80.7907850917542330.0092149082457671
70.8560.7872830449861480.0687169550138521
80.90.7767589418233950.123241058176605
90.80.7540913610851050.0459086389148948
100.760.749053494829810.0109465051701899
110.820.7925960344812260.0274039655187736
120.850.8006545426610220.0493454573389778
130.50.775207321894069-0.275207321894069
140.510.755781280519776-0.245781280519776
150.730.751190743261943-0.0211907432619431
160.790.7530651469257480.0369348530742524
170.640.730976657957713-0.0909766579577131
180.680.732655996913325-0.0526559969133246
190.620.726904675330925-0.106904675330925
200.620.694704120491596-0.0747041204915959
210.720.7012331822132030.0187668177867968
220.850.6907176748866450.159282325113355
230.810.7011182470688050.108881752931195
240.720.7104564601481170.00954353985188322
250.670.713680266716961-0.0436802667169608
260.830.8164387594999080.0135612405000921
270.830.8063247589596220.0236752410403783
280.80.6522866364816720.147713363518328
290.810.642328246266010.16767175373399
300.790.7899390233345146.09766654858148e-05
310.770.803135490149919-0.0331354901499185
320.720.785522315273001-0.0655223152730008
330.820.7598349912762260.0601650087237738
340.850.7515252074765930.098474792523407
350.790.7669019654515550.0230980345484453
360.720.738528525403457-0.0185285254034574
370.770.7623881103207030.00761188967929737
380.80.7356559248233060.0643440751766939
390.740.733059906819250.00694009318075026
400.650.675086269094241-0.0250862690942414
410.680.678440976905950.00155902309404949
420.650.6423607504691110.00763924953088872
430.630.618369109231820.0116308907681797
440.550.598040750657327-0.0480407506573266
450.590.5751990218350680.014800978164932
460.5750.5121383065673660.062861693432634
470.550.5083699896594410.0416300103405593
480.4870.4714983816700890.015501618329911
490.520.4737356492748180.0462643507251817
500.4950.4888021637521890.00619783624781115
510.480.4710944895479450.00890551045205517
520.420.457963423695985-0.0379634236959848
530.4350.46890087291711-0.0339008729171104
540.4150.471606909183836-0.0566069091838363
550.40.479498969591847-0.0794989695918467
560.350.475261861854795-0.125261861854795


Goldfeld-Quandt test for Heteroskedasticity
p-valuesAlternative Hypothesis
breakpoint indexgreater2-sidedless
80.3680928399614360.7361856799228710.631907160038564
90.3824601389517770.7649202779035550.617539861048223
100.341226606879970.682453213759940.65877339312003
110.2264362200991590.4528724401983190.77356377990084
120.1483446181329420.2966892362658840.851655381867058
130.8724729200564970.2550541598870060.127527079943503
140.9856464748850920.02870705022981670.0143535251149084
150.9822907038999820.03541859220003580.0177092961000179
160.9773938616337980.0452122767324040.022606138366202
170.9865705446848460.02685891063030880.0134294553151544
180.9845591264215330.0308817471569350.0154408735784675
190.9930692698782250.01386146024355070.00693073012177535
200.9984376603029030.003124679394193610.0015623396970968
210.9995254987089330.0009490025821329430.000474501291066471
220.9997117212972190.0005765574055628960.000288278702781448
230.9996763181081980.0006473637836038040.000323681891801902
240.9996802431847480.000639513630503190.000319756815251595
250.999982417959853.51640803016937e-051.75820401508468e-05
260.9999934072712421.31854575155473e-056.59272875777363e-06
270.9999888563588542.22872822919315e-051.11436411459658e-05
280.9999861979756992.76040486024493e-051.38020243012246e-05
290.9999814688884223.7062223156699e-051.85311115783495e-05
300.9999685802657486.28394685033558e-053.14197342516779e-05
310.9999767504721354.64990557308652e-052.32495278654326e-05
320.99999971012455.79750998889227e-072.89875499444614e-07
330.9999991075963071.78480738657014e-068.92403693285068e-07
340.9999982580649363.48387012872599e-061.74193506436299e-06
350.9999955441239838.91175203309586e-064.45587601654793e-06
360.9999992288735631.54225287434799e-067.71126437173993e-07
370.9999984788977443.04220451248575e-061.52110225624287e-06
380.9999998495088783.00982243772086e-071.50491121886043e-07
390.9999997584440634.83111873014692e-072.41555936507346e-07
400.999999148117741.70376451948906e-068.51882259744531e-07
410.99999795817324.08365360130456e-062.04182680065228e-06
420.999991286196721.74276065597068e-058.7138032798534e-06
430.9999549199578239.01600843548167e-054.50800421774084e-05
440.9999254752100960.0001490495798075337.45247899037667e-05
450.9996023203188340.0007953593623315510.000397679681165775
460.9991974074168520.001605185166296180.00080259258314809
470.995589594918740.008820810162519130.00441040508125957
480.9941051883755190.01178962324896290.00589481162448144

\begin{tabular}{lllllllll}
\hline
Goldfeld-Quandt test for Heteroskedasticity \tabularnewline
p-values & Alternative Hypothesis \tabularnewline
breakpoint index & greater & 2-sided & less \tabularnewline
8 & 0.368092839961436 & 0.736185679922871 & 0.631907160038564 \tabularnewline
9 & 0.382460138951777 & 0.764920277903555 & 0.617539861048223 \tabularnewline
10 & 0.34122660687997 & 0.68245321375994 & 0.65877339312003 \tabularnewline
11 & 0.226436220099159 & 0.452872440198319 & 0.77356377990084 \tabularnewline
12 & 0.148344618132942 & 0.296689236265884 & 0.851655381867058 \tabularnewline
13 & 0.872472920056497 & 0.255054159887006 & 0.127527079943503 \tabularnewline
14 & 0.985646474885092 & 0.0287070502298167 & 0.0143535251149084 \tabularnewline
15 & 0.982290703899982 & 0.0354185922000358 & 0.0177092961000179 \tabularnewline
16 & 0.977393861633798 & 0.045212276732404 & 0.022606138366202 \tabularnewline
17 & 0.986570544684846 & 0.0268589106303088 & 0.0134294553151544 \tabularnewline
18 & 0.984559126421533 & 0.030881747156935 & 0.0154408735784675 \tabularnewline
19 & 0.993069269878225 & 0.0138614602435507 & 0.00693073012177535 \tabularnewline
20 & 0.998437660302903 & 0.00312467939419361 & 0.0015623396970968 \tabularnewline
21 & 0.999525498708933 & 0.000949002582132943 & 0.000474501291066471 \tabularnewline
22 & 0.999711721297219 & 0.000576557405562896 & 0.000288278702781448 \tabularnewline
23 & 0.999676318108198 & 0.000647363783603804 & 0.000323681891801902 \tabularnewline
24 & 0.999680243184748 & 0.00063951363050319 & 0.000319756815251595 \tabularnewline
25 & 0.99998241795985 & 3.51640803016937e-05 & 1.75820401508468e-05 \tabularnewline
26 & 0.999993407271242 & 1.31854575155473e-05 & 6.59272875777363e-06 \tabularnewline
27 & 0.999988856358854 & 2.22872822919315e-05 & 1.11436411459658e-05 \tabularnewline
28 & 0.999986197975699 & 2.76040486024493e-05 & 1.38020243012246e-05 \tabularnewline
29 & 0.999981468888422 & 3.7062223156699e-05 & 1.85311115783495e-05 \tabularnewline
30 & 0.999968580265748 & 6.28394685033558e-05 & 3.14197342516779e-05 \tabularnewline
31 & 0.999976750472135 & 4.64990557308652e-05 & 2.32495278654326e-05 \tabularnewline
32 & 0.9999997101245 & 5.79750998889227e-07 & 2.89875499444614e-07 \tabularnewline
33 & 0.999999107596307 & 1.78480738657014e-06 & 8.92403693285068e-07 \tabularnewline
34 & 0.999998258064936 & 3.48387012872599e-06 & 1.74193506436299e-06 \tabularnewline
35 & 0.999995544123983 & 8.91175203309586e-06 & 4.45587601654793e-06 \tabularnewline
36 & 0.999999228873563 & 1.54225287434799e-06 & 7.71126437173993e-07 \tabularnewline
37 & 0.999998478897744 & 3.04220451248575e-06 & 1.52110225624287e-06 \tabularnewline
38 & 0.999999849508878 & 3.00982243772086e-07 & 1.50491121886043e-07 \tabularnewline
39 & 0.999999758444063 & 4.83111873014692e-07 & 2.41555936507346e-07 \tabularnewline
40 & 0.99999914811774 & 1.70376451948906e-06 & 8.51882259744531e-07 \tabularnewline
41 & 0.9999979581732 & 4.08365360130456e-06 & 2.04182680065228e-06 \tabularnewline
42 & 0.99999128619672 & 1.74276065597068e-05 & 8.7138032798534e-06 \tabularnewline
43 & 0.999954919957823 & 9.01600843548167e-05 & 4.50800421774084e-05 \tabularnewline
44 & 0.999925475210096 & 0.000149049579807533 & 7.45247899037667e-05 \tabularnewline
45 & 0.999602320318834 & 0.000795359362331551 & 0.000397679681165775 \tabularnewline
46 & 0.999197407416852 & 0.00160518516629618 & 0.00080259258314809 \tabularnewline
47 & 0.99558959491874 & 0.00882081016251913 & 0.00441040508125957 \tabularnewline
48 & 0.994105188375519 & 0.0117896232489629 & 0.00589481162448144 \tabularnewline
\hline
\end{tabular}
%Source: https://freestatistics.org/blog/index.php?pk=120611&T=5

[TABLE]
[ROW][C]Goldfeld-Quandt test for Heteroskedasticity[/C][/ROW]
[ROW][C]p-values[/C][C]Alternative Hypothesis[/C][/ROW]
[ROW][C]breakpoint index[/C][C]greater[/C][C]2-sided[/C][C]less[/C][/ROW]
[ROW][C]8[/C][C]0.368092839961436[/C][C]0.736185679922871[/C][C]0.631907160038564[/C][/ROW]
[ROW][C]9[/C][C]0.382460138951777[/C][C]0.764920277903555[/C][C]0.617539861048223[/C][/ROW]
[ROW][C]10[/C][C]0.34122660687997[/C][C]0.68245321375994[/C][C]0.65877339312003[/C][/ROW]
[ROW][C]11[/C][C]0.226436220099159[/C][C]0.452872440198319[/C][C]0.77356377990084[/C][/ROW]
[ROW][C]12[/C][C]0.148344618132942[/C][C]0.296689236265884[/C][C]0.851655381867058[/C][/ROW]
[ROW][C]13[/C][C]0.872472920056497[/C][C]0.255054159887006[/C][C]0.127527079943503[/C][/ROW]
[ROW][C]14[/C][C]0.985646474885092[/C][C]0.0287070502298167[/C][C]0.0143535251149084[/C][/ROW]
[ROW][C]15[/C][C]0.982290703899982[/C][C]0.0354185922000358[/C][C]0.0177092961000179[/C][/ROW]
[ROW][C]16[/C][C]0.977393861633798[/C][C]0.045212276732404[/C][C]0.022606138366202[/C][/ROW]
[ROW][C]17[/C][C]0.986570544684846[/C][C]0.0268589106303088[/C][C]0.0134294553151544[/C][/ROW]
[ROW][C]18[/C][C]0.984559126421533[/C][C]0.030881747156935[/C][C]0.0154408735784675[/C][/ROW]
[ROW][C]19[/C][C]0.993069269878225[/C][C]0.0138614602435507[/C][C]0.00693073012177535[/C][/ROW]
[ROW][C]20[/C][C]0.998437660302903[/C][C]0.00312467939419361[/C][C]0.0015623396970968[/C][/ROW]
[ROW][C]21[/C][C]0.999525498708933[/C][C]0.000949002582132943[/C][C]0.000474501291066471[/C][/ROW]
[ROW][C]22[/C][C]0.999711721297219[/C][C]0.000576557405562896[/C][C]0.000288278702781448[/C][/ROW]
[ROW][C]23[/C][C]0.999676318108198[/C][C]0.000647363783603804[/C][C]0.000323681891801902[/C][/ROW]
[ROW][C]24[/C][C]0.999680243184748[/C][C]0.00063951363050319[/C][C]0.000319756815251595[/C][/ROW]
[ROW][C]25[/C][C]0.99998241795985[/C][C]3.51640803016937e-05[/C][C]1.75820401508468e-05[/C][/ROW]
[ROW][C]26[/C][C]0.999993407271242[/C][C]1.31854575155473e-05[/C][C]6.59272875777363e-06[/C][/ROW]
[ROW][C]27[/C][C]0.999988856358854[/C][C]2.22872822919315e-05[/C][C]1.11436411459658e-05[/C][/ROW]
[ROW][C]28[/C][C]0.999986197975699[/C][C]2.76040486024493e-05[/C][C]1.38020243012246e-05[/C][/ROW]
[ROW][C]29[/C][C]0.999981468888422[/C][C]3.7062223156699e-05[/C][C]1.85311115783495e-05[/C][/ROW]
[ROW][C]30[/C][C]0.999968580265748[/C][C]6.28394685033558e-05[/C][C]3.14197342516779e-05[/C][/ROW]
[ROW][C]31[/C][C]0.999976750472135[/C][C]4.64990557308652e-05[/C][C]2.32495278654326e-05[/C][/ROW]
[ROW][C]32[/C][C]0.9999997101245[/C][C]5.79750998889227e-07[/C][C]2.89875499444614e-07[/C][/ROW]
[ROW][C]33[/C][C]0.999999107596307[/C][C]1.78480738657014e-06[/C][C]8.92403693285068e-07[/C][/ROW]
[ROW][C]34[/C][C]0.999998258064936[/C][C]3.48387012872599e-06[/C][C]1.74193506436299e-06[/C][/ROW]
[ROW][C]35[/C][C]0.999995544123983[/C][C]8.91175203309586e-06[/C][C]4.45587601654793e-06[/C][/ROW]
[ROW][C]36[/C][C]0.999999228873563[/C][C]1.54225287434799e-06[/C][C]7.71126437173993e-07[/C][/ROW]
[ROW][C]37[/C][C]0.999998478897744[/C][C]3.04220451248575e-06[/C][C]1.52110225624287e-06[/C][/ROW]
[ROW][C]38[/C][C]0.999999849508878[/C][C]3.00982243772086e-07[/C][C]1.50491121886043e-07[/C][/ROW]
[ROW][C]39[/C][C]0.999999758444063[/C][C]4.83111873014692e-07[/C][C]2.41555936507346e-07[/C][/ROW]
[ROW][C]40[/C][C]0.99999914811774[/C][C]1.70376451948906e-06[/C][C]8.51882259744531e-07[/C][/ROW]
[ROW][C]41[/C][C]0.9999979581732[/C][C]4.08365360130456e-06[/C][C]2.04182680065228e-06[/C][/ROW]
[ROW][C]42[/C][C]0.99999128619672[/C][C]1.74276065597068e-05[/C][C]8.7138032798534e-06[/C][/ROW]
[ROW][C]43[/C][C]0.999954919957823[/C][C]9.01600843548167e-05[/C][C]4.50800421774084e-05[/C][/ROW]
[ROW][C]44[/C][C]0.999925475210096[/C][C]0.000149049579807533[/C][C]7.45247899037667e-05[/C][/ROW]
[ROW][C]45[/C][C]0.999602320318834[/C][C]0.000795359362331551[/C][C]0.000397679681165775[/C][/ROW]
[ROW][C]46[/C][C]0.999197407416852[/C][C]0.00160518516629618[/C][C]0.00080259258314809[/C][/ROW]
[ROW][C]47[/C][C]0.99558959491874[/C][C]0.00882081016251913[/C][C]0.00441040508125957[/C][/ROW]
[ROW][C]48[/C][C]0.994105188375519[/C][C]0.0117896232489629[/C][C]0.00589481162448144[/C][/ROW]
[/TABLE]
Source: https://freestatistics.org/blog/index.php?pk=120611&T=5

Globally Unique Identifier (entire table): ba.freestatistics.org/blog/index.php?pk=120611&T=5

As an alternative you can also use a QR Code:  

The GUIDs for individual cells are displayed in the table below:

Goldfeld-Quandt test for Heteroskedasticity
p-valuesAlternative Hypothesis
breakpoint indexgreater2-sidedless
80.3680928399614360.7361856799228710.631907160038564
90.3824601389517770.7649202779035550.617539861048223
100.341226606879970.682453213759940.65877339312003
110.2264362200991590.4528724401983190.77356377990084
120.1483446181329420.2966892362658840.851655381867058
130.8724729200564970.2550541598870060.127527079943503
140.9856464748850920.02870705022981670.0143535251149084
150.9822907038999820.03541859220003580.0177092961000179
160.9773938616337980.0452122767324040.022606138366202
170.9865705446848460.02685891063030880.0134294553151544
180.9845591264215330.0308817471569350.0154408735784675
190.9930692698782250.01386146024355070.00693073012177535
200.9984376603029030.003124679394193610.0015623396970968
210.9995254987089330.0009490025821329430.000474501291066471
220.9997117212972190.0005765574055628960.000288278702781448
230.9996763181081980.0006473637836038040.000323681891801902
240.9996802431847480.000639513630503190.000319756815251595
250.999982417959853.51640803016937e-051.75820401508468e-05
260.9999934072712421.31854575155473e-056.59272875777363e-06
270.9999888563588542.22872822919315e-051.11436411459658e-05
280.9999861979756992.76040486024493e-051.38020243012246e-05
290.9999814688884223.7062223156699e-051.85311115783495e-05
300.9999685802657486.28394685033558e-053.14197342516779e-05
310.9999767504721354.64990557308652e-052.32495278654326e-05
320.99999971012455.79750998889227e-072.89875499444614e-07
330.9999991075963071.78480738657014e-068.92403693285068e-07
340.9999982580649363.48387012872599e-061.74193506436299e-06
350.9999955441239838.91175203309586e-064.45587601654793e-06
360.9999992288735631.54225287434799e-067.71126437173993e-07
370.9999984788977443.04220451248575e-061.52110225624287e-06
380.9999998495088783.00982243772086e-071.50491121886043e-07
390.9999997584440634.83111873014692e-072.41555936507346e-07
400.999999148117741.70376451948906e-068.51882259744531e-07
410.99999795817324.08365360130456e-062.04182680065228e-06
420.999991286196721.74276065597068e-058.7138032798534e-06
430.9999549199578239.01600843548167e-054.50800421774084e-05
440.9999254752100960.0001490495798075337.45247899037667e-05
450.9996023203188340.0007953593623315510.000397679681165775
460.9991974074168520.001605185166296180.00080259258314809
470.995589594918740.008820810162519130.00441040508125957
480.9941051883755190.01178962324896290.00589481162448144


Meta Analysis of Goldfeld-Quandt test for Heteroskedasticity
Description# significant tests% significant testsOK/NOK
1% type I error level280.682926829268293NOK
5% type I error level350.853658536585366NOK
10% type I error level350.853658536585366NOK

\begin{tabular}{lllllllll}
\hline
Meta Analysis of Goldfeld-Quandt test for Heteroskedasticity \tabularnewline
Description & # significant tests & % significant tests & OK/NOK \tabularnewline
1% type I error level & 28 & 0.682926829268293 & NOK \tabularnewline
5% type I error level & 35 & 0.853658536585366 & NOK \tabularnewline
10% type I error level & 35 & 0.853658536585366 & NOK \tabularnewline
\hline
\end{tabular}
%Source: https://freestatistics.org/blog/index.php?pk=120611&T=6

[TABLE]
[ROW][C]Meta Analysis of Goldfeld-Quandt test for Heteroskedasticity[/C][/ROW]
[ROW][C]Description[/C][C]# significant tests[/C][C]% significant tests[/C][C]OK/NOK[/C][/ROW]
[ROW][C]1% type I error level[/C][C]28[/C][C]0.682926829268293[/C][C]NOK[/C][/ROW]
[ROW][C]5% type I error level[/C][C]35[/C][C]0.853658536585366[/C][C]NOK[/C][/ROW]
[ROW][C]10% type I error level[/C][C]35[/C][C]0.853658536585366[/C][C]NOK[/C][/ROW]
[/TABLE]
Source: https://freestatistics.org/blog/index.php?pk=120611&T=6

Globally Unique Identifier (entire table): ba.freestatistics.org/blog/index.php?pk=120611&T=6

As an alternative you can also use a QR Code:  

The GUIDs for individual cells are displayed in the table below:

Meta Analysis of Goldfeld-Quandt test for Heteroskedasticity
Description# significant tests% significant testsOK/NOK
1% type I error level280.682926829268293NOK
5% type I error level350.853658536585366NOK
10% type I error level350.853658536585366NOK


Parameters (Session):
par1 = 1 ; par2 = Do not include Seasonal Dummies ; par3 = Linear Trend ;
Parameters (R input):
par1 = 1 ; par2 = Do not include Seasonal Dummies ; par3 = Linear Trend ;
R code (references can be found in the software module):
library(lattice)
library(lmtest)
n25 <- 25 #minimum number of obs. for Goldfeld-Quandt test
par1 <- as.numeric(par1)
x <- t(y)
k <- length(x[1,])
n <- length(x[,1])
x1 <- cbind(x[,par1], x[,1:k!=par1])
mycolnames <- c(colnames(x)[par1], colnames(x)[1:k!=par1])
colnames(x1) <- mycolnames #colnames(x)[par1]
x <- x1
if (par3 == 'First Differences'){
x2 <- array(0, dim=c(n-1,k), dimnames=list(1:(n-1), paste('(1-B)',colnames(x),sep='')))
for (i in 1:n-1) {
for (j in 1:k) {
x2[i,j] <- x[i+1,j] - x[i,j]
}
}
x <- x2
}
if (par2 == 'Include Monthly Dummies'){
x2 <- array(0, dim=c(n,11), dimnames=list(1:n, paste('M', seq(1:11), sep ='')))
for (i in 1:11){
x2[seq(i,n,12),i] <- 1
}
x <- cbind(x, x2)
}
if (par2 == 'Include Quarterly Dummies'){
x2 <- array(0, dim=c(n,3), dimnames=list(1:n, paste('Q', seq(1:3), sep ='')))
for (i in 1:3){
x2[seq(i,n,4),i] <- 1
}
x <- cbind(x, x2)
}
k <- length(x[1,])
if (par3 == 'Linear Trend'){
x <- cbind(x, c(1:n))
colnames(x)[k+1] <- 't'
}
x
k <- length(x[1,])
df <- as.data.frame(x)
(mylm <- lm(df))
(mysum <- summary(mylm))
if (n > n25) {
kp3 <- k + 3
nmkm3 <- n - k - 3
gqarr <- array(NA, dim=c(nmkm3-kp3+1,3))
numgqtests <- 0
numsignificant1 <- 0
numsignificant5 <- 0
numsignificant10 <- 0
for (mypoint in kp3:nmkm3) {
j <- 0
numgqtests <- numgqtests + 1
for (myalt in c('greater', 'two.sided', 'less')) {
j <- j + 1
gqarr[mypoint-kp3+1,j] <- gqtest(mylm, point=mypoint, alternative=myalt)$p.value
}
if (gqarr[mypoint-kp3+1,2] < 0.01) numsignificant1 <- numsignificant1 + 1
if (gqarr[mypoint-kp3+1,2] < 0.05) numsignificant5 <- numsignificant5 + 1
if (gqarr[mypoint-kp3+1,2] < 0.10) numsignificant10 <- numsignificant10 + 1
}
gqarr
}
bitmap(file='test0.png')
plot(x[,1], type='l', main='Actuals and Interpolation', ylab='value of Actuals and Interpolation (dots)', xlab='time or index')
points(x[,1]-mysum$resid)
grid()
dev.off()
bitmap(file='test1.png')
plot(mysum$resid, type='b', pch=19, main='Residuals', ylab='value of Residuals', xlab='time or index')
grid()
dev.off()
bitmap(file='test2.png')
hist(mysum$resid, main='Residual Histogram', xlab='values of Residuals')
grid()
dev.off()
bitmap(file='test3.png')
densityplot(~mysum$resid,col='black',main='Residual Density Plot', xlab='values of Residuals')
dev.off()
bitmap(file='test4.png')
qqnorm(mysum$resid, main='Residual Normal Q-Q Plot')
qqline(mysum$resid)
grid()
dev.off()
(myerror <- as.ts(mysum$resid))
bitmap(file='test5.png')
dum <- cbind(lag(myerror,k=1),myerror)
dum
dum1 <- dum[2:length(myerror),]
dum1
z <- as.data.frame(dum1)
z
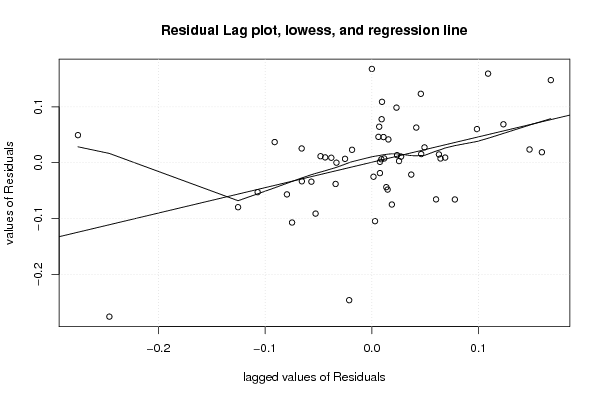
plot(z,main=paste('Residual Lag plot, lowess, and regression line'), ylab='values of Residuals', xlab='lagged values of Residuals')
lines(lowess(z))
abline(lm(z))
grid()
dev.off()
bitmap(file='test6.png')
acf(mysum$resid, lag.max=length(mysum$resid)/2, main='Residual Autocorrelation Function')
grid()
dev.off()
bitmap(file='test7.png')
pacf(mysum$resid, lag.max=length(mysum$resid)/2, main='Residual Partial Autocorrelation Function')
grid()
dev.off()
bitmap(file='test8.png')
opar <- par(mfrow = c(2,2), oma = c(0, 0, 1.1, 0))
plot(mylm, las = 1, sub='Residual Diagnostics')
par(opar)
dev.off()
if (n > n25) {
bitmap(file='test9.png')
plot(kp3:nmkm3,gqarr[,2], main='Goldfeld-Quandt test',ylab='2-sided p-value',xlab='breakpoint')
grid()
dev.off()
}
load(file='createtable')
a<-table.start()
a<-table.row.start(a)
a<-table.element(a, 'Multiple Linear Regression - Estimated Regression Equation', 1, TRUE)
a<-table.row.end(a)
myeq <- colnames(x)[1]
myeq <- paste(myeq, '[t] = ', sep='')
for (i in 1:k){
if (mysum$coefficients[i,1] > 0) myeq <- paste(myeq, '+', '')
myeq <- paste(myeq, mysum$coefficients[i,1], sep=' ')
if (rownames(mysum$coefficients)[i] != '(Intercept)') {
myeq <- paste(myeq, rownames(mysum$coefficients)[i], sep='')
if (rownames(mysum$coefficients)[i] != 't') myeq <- paste(myeq, '[t]', sep='')
}
}
myeq <- paste(myeq, ' + e[t]')
a<-table.row.start(a)
a<-table.element(a, myeq)
a<-table.row.end(a)
a<-table.end(a)
table.save(a,file='mytable1.tab')
a<-table.start()
a<-table.row.start(a)
a<-table.element(a,hyperlink('ols1.htm','Multiple Linear Regression - Ordinary Least Squares',''), 6, TRUE)
a<-table.row.end(a)
a<-table.row.start(a)
a<-table.element(a,'Variable',header=TRUE)
a<-table.element(a,'Parameter',header=TRUE)
a<-table.element(a,'S.D.',header=TRUE)
a<-table.element(a,'T-STAT
H0: parameter = 0',header=TRUE)
a<-table.element(a,'2-tail p-value',header=TRUE)
a<-table.element(a,'1-tail p-value',header=TRUE)
a<-table.row.end(a)
for (i in 1:k){
a<-table.row.start(a)
a<-table.element(a,rownames(mysum$coefficients)[i],header=TRUE)
a<-table.element(a,mysum$coefficients[i,1])
a<-table.element(a, round(mysum$coefficients[i,2],6))
a<-table.element(a, round(mysum$coefficients[i,3],4))
a<-table.element(a, round(mysum$coefficients[i,4],6))
a<-table.element(a, round(mysum$coefficients[i,4]/2,6))
a<-table.row.end(a)
}
a<-table.end(a)
table.save(a,file='mytable2.tab')
a<-table.start()
a<-table.row.start(a)
a<-table.element(a, 'Multiple Linear Regression - Regression Statistics', 2, TRUE)
a<-table.row.end(a)
a<-table.row.start(a)
a<-table.element(a, 'Multiple R',1,TRUE)
a<-table.element(a, sqrt(mysum$r.squared))
a<-table.row.end(a)
a<-table.row.start(a)
a<-table.element(a, 'R-squared',1,TRUE)
a<-table.element(a, mysum$r.squared)
a<-table.row.end(a)
a<-table.row.start(a)
a<-table.element(a, 'Adjusted R-squared',1,TRUE)
a<-table.element(a, mysum$adj.r.squared)
a<-table.row.end(a)
a<-table.row.start(a)
a<-table.element(a, 'F-TEST (value)',1,TRUE)
a<-table.element(a, mysum$fstatistic[1])
a<-table.row.end(a)
a<-table.row.start(a)
a<-table.element(a, 'F-TEST (DF numerator)',1,TRUE)
a<-table.element(a, mysum$fstatistic[2])
a<-table.row.end(a)
a<-table.row.start(a)
a<-table.element(a, 'F-TEST (DF denominator)',1,TRUE)
a<-table.element(a, mysum$fstatistic[3])
a<-table.row.end(a)
a<-table.row.start(a)
a<-table.element(a, 'p-value',1,TRUE)
a<-table.element(a, 1-pf(mysum$fstatistic[1],mysum$fstatistic[2],mysum$fstatistic[3]))
a<-table.row.end(a)
a<-table.row.start(a)
a<-table.element(a, 'Multiple Linear Regression - Residual Statistics', 2, TRUE)
a<-table.row.end(a)
a<-table.row.start(a)
a<-table.element(a, 'Residual Standard Deviation',1,TRUE)
a<-table.element(a, mysum$sigma)
a<-table.row.end(a)
a<-table.row.start(a)
a<-table.element(a, 'Sum Squared Residuals',1,TRUE)
a<-table.element(a, sum(myerror*myerror))
a<-table.row.end(a)
a<-table.end(a)
table.save(a,file='mytable3.tab')
a<-table.start()
a<-table.row.start(a)
a<-table.element(a, 'Multiple Linear Regression - Actuals, Interpolation, and Residuals', 4, TRUE)
a<-table.row.end(a)
a<-table.row.start(a)
a<-table.element(a, 'Time or Index', 1, TRUE)
a<-table.element(a, 'Actuals', 1, TRUE)
a<-table.element(a, 'Interpolation
Forecast', 1, TRUE)
a<-table.element(a, 'Residuals
Prediction Error', 1, TRUE)
a<-table.row.end(a)
for (i in 1:n) {
a<-table.row.start(a)
a<-table.element(a,i, 1, TRUE)
a<-table.element(a,x[i])
a<-table.element(a,x[i]-mysum$resid[i])
a<-table.element(a,mysum$resid[i])
a<-table.row.end(a)
}
a<-table.end(a)
table.save(a,file='mytable4.tab')
if (n > n25) {
a<-table.start()
a<-table.row.start(a)
a<-table.element(a,'Goldfeld-Quandt test for Heteroskedasticity',4,TRUE)
a<-table.row.end(a)
a<-table.row.start(a)
a<-table.element(a,'p-values',header=TRUE)
a<-table.element(a,'Alternative Hypothesis',3,header=TRUE)
a<-table.row.end(a)
a<-table.row.start(a)
a<-table.element(a,'breakpoint index',header=TRUE)
a<-table.element(a,'greater',header=TRUE)
a<-table.element(a,'2-sided',header=TRUE)
a<-table.element(a,'less',header=TRUE)
a<-table.row.end(a)
for (mypoint in kp3:nmkm3) {
a<-table.row.start(a)
a<-table.element(a,mypoint,header=TRUE)
a<-table.element(a,gqarr[mypoint-kp3+1,1])
a<-table.element(a,gqarr[mypoint-kp3+1,2])
a<-table.element(a,gqarr[mypoint-kp3+1,3])
a<-table.row.end(a)
}
a<-table.end(a)
table.save(a,file='mytable5.tab')
a<-table.start()
a<-table.row.start(a)
a<-table.element(a,'Meta Analysis of Goldfeld-Quandt test for Heteroskedasticity',4,TRUE)
a<-table.row.end(a)
a<-table.row.start(a)
a<-table.element(a,'Description',header=TRUE)
a<-table.element(a,'# significant tests',header=TRUE)
a<-table.element(a,'% significant tests',header=TRUE)
a<-table.element(a,'OK/NOK',header=TRUE)
a<-table.row.end(a)
a<-table.row.start(a)
a<-table.element(a,'1% type I error level',header=TRUE)
a<-table.element(a,numsignificant1)
a<-table.element(a,numsignificant1/numgqtests)
if (numsignificant1/numgqtests < 0.01) dum <- 'OK' else dum <- 'NOK'
a<-table.element(a,dum)
a<-table.row.end(a)
a<-table.row.start(a)
a<-table.element(a,'5% type I error level',header=TRUE)
a<-table.element(a,numsignificant5)
a<-table.element(a,numsignificant5/numgqtests)
if (numsignificant5/numgqtests < 0.05) dum <- 'OK' else dum <- 'NOK'
a<-table.element(a,dum)
a<-table.row.end(a)
a<-table.row.start(a)
a<-table.element(a,'10% type I error level',header=TRUE)
a<-table.element(a,numsignificant10)
a<-table.element(a,numsignificant10/numgqtests)
if (numsignificant10/numgqtests < 0.1) dum <- 'OK' else dum <- 'NOK'
a<-table.element(a,dum)
a<-table.row.end(a)
a<-table.end(a)
table.save(a,file='mytable6.tab')
}