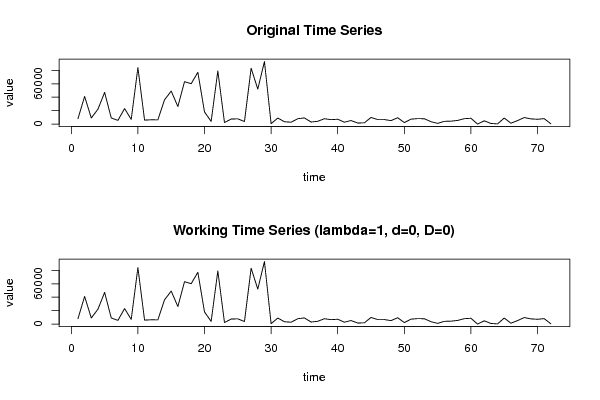
Free Statistics

of Irreproducible Research!

Author's title

Author*Unverified author*
R Software Modulerwasp_autocorrelation.wasp
Title produced by software(Partial) Autocorrelation Function
Date of computationWed, 13 Apr 2011 17:45:58 +0000
Cite this page as followsStatistical Computations at FreeStatistics.org, Office for Research Development and Education, URL https://freestatistics.org/blog/index.php?v=date/2011/Apr/13/t1302716538zz8z6ukbvs6y15l.htm/, Retrieved Wed, 08 May 2024 12:03:40 +0000
Statistical Computations at FreeStatistics.org, Office for Research Development and Education, URL https://freestatistics.org/blog/index.php?pk=120579, Retrieved Wed, 08 May 2024 12:03:40 +0000
QR Codes:

Original text written by user:
IsPrivate?No (this computation is public)
User-defined keywordsKDGP2W12
Estimated Impact191
Family? (F = Feedback message, R = changed R code, M = changed R Module, P = changed Parameters, D = changed Data)
-       [(Partial) Autocorrelation Function] [] [2011-04-13 17:45:58] [f0cd0ad4d4cb2a25864ed1f6cd7bfd87] [Current]
Feedback Forum

Post a new message
Dataseries X:
7989
41102
9123
22109
47115
9105
5496
23102
6994
84101
5884
6383
6292
36109
49127
26116
63120
60115
77117
18110
3999
79105
2286
7487
7789
3788
83108
52100
93102
598
8983
3488
2780
7974
9171
3071
4166
7968
6580
7183
2779
5273
1568
1860
9853
6757
6745
5144
9444
2248
7349
8149
7949
3545
1043
4038
4335
5432
8027
8626
24
4829
931
232
9034
1337
5138
9736
7730
7133
8126
424


Summary of computational transaction
Raw Inputview raw input (R code)
Raw Outputview raw output of R engine
Computing time2 seconds
R Server'Herman Ole Andreas Wold' @ www.yougetit.org

\begin{tabular}{lllllllll}
\hline
Summary of computational transaction \tabularnewline
Raw Input & view raw input (R code)  \tabularnewline
Raw Output & view raw output of R engine  \tabularnewline
Computing time & 2 seconds \tabularnewline
R Server & 'Herman Ole Andreas Wold' @ www.yougetit.org \tabularnewline
\hline
\end{tabular}
%Source: https://freestatistics.org/blog/index.php?pk=120579&T=0

[TABLE]
[ROW][C]Summary of computational transaction[/C][/ROW]
[ROW][C]Raw Input[/C][C]view raw input (R code) [/C][/ROW]
[ROW][C]Raw Output[/C][C]view raw output of R engine [/C][/ROW]
[ROW][C]Computing time[/C][C]2 seconds[/C][/ROW]
[ROW][C]R Server[/C][C]'Herman Ole Andreas Wold' @ www.yougetit.org[/C][/ROW]
[/TABLE]
Source: https://freestatistics.org/blog/index.php?pk=120579&T=0

Globally Unique Identifier (entire table): ba.freestatistics.org/blog/index.php?pk=120579&T=0

As an alternative you can also use a QR Code:  

The GUIDs for individual cells are displayed in the table below:

Summary of computational transaction
Raw Inputview raw input (R code)
Raw Outputview raw output of R engine
Computing time2 seconds
R Server'Herman Ole Andreas Wold' @ www.yougetit.org


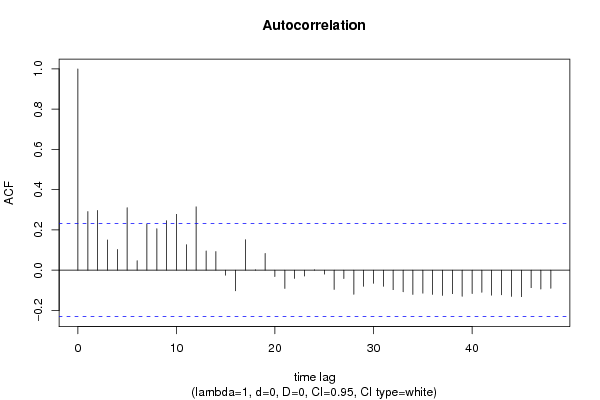
Autocorrelation Function
Time lag kACF(k)T-STATP-value
10.2909962.46920.007958
20.2968732.5190.006994
30.14981.27110.103894
40.1026120.87070.193409
50.3106472.63590.005135
60.0466790.39610.346606
70.2287691.94120.028076
80.2056551.7450.042622
90.2454982.08310.020396
100.2773482.35340.010669
110.1262211.0710.14387
120.3147462.67070.004676
130.0950160.80620.21138
140.0921840.78220.218328
15-0.024784-0.21030.417015
16-0.102079-0.86620.194638
170.1514421.2850.101451
180.0015030.01280.49493
190.0831310.70540.241422
20-0.031725-0.26920.394273
21-0.090566-0.76850.222359
22-0.040936-0.34740.364671
23-0.028884-0.24510.403542
240.0009470.0080.496807
25-0.019498-0.16540.434527
26-0.095338-0.8090.210598
27-0.041606-0.3530.362547
28-0.119335-1.01260.157322
29-0.080239-0.68080.249075
30-0.064658-0.54860.292474
31-0.079834-0.67740.250156
32-0.096799-0.82140.207074
33-0.107557-0.91270.182235
34-0.120235-1.02020.155517
35-0.114059-0.96780.168185
36-0.120391-1.02160.155207
37-0.125436-1.06440.145362
38-0.116631-0.98960.162831
39-0.129909-1.10230.136998
40-0.116237-0.98630.163644
41-0.109748-0.93120.177419
42-0.124006-1.05220.148107
43-0.122589-1.04020.150863
44-0.1304-1.10650.136101
45-0.131365-1.11470.13435
46-0.086848-0.73690.231781
47-0.0938-0.79590.214346
48-0.090269-0.7660.223102

\begin{tabular}{lllllllll}
\hline
Autocorrelation Function \tabularnewline
Time lag k & ACF(k) & T-STAT & P-value \tabularnewline
1 & 0.290996 & 2.4692 & 0.007958 \tabularnewline
2 & 0.296873 & 2.519 & 0.006994 \tabularnewline
3 & 0.1498 & 1.2711 & 0.103894 \tabularnewline
4 & 0.102612 & 0.8707 & 0.193409 \tabularnewline
5 & 0.310647 & 2.6359 & 0.005135 \tabularnewline
6 & 0.046679 & 0.3961 & 0.346606 \tabularnewline
7 & 0.228769 & 1.9412 & 0.028076 \tabularnewline
8 & 0.205655 & 1.745 & 0.042622 \tabularnewline
9 & 0.245498 & 2.0831 & 0.020396 \tabularnewline
10 & 0.277348 & 2.3534 & 0.010669 \tabularnewline
11 & 0.126221 & 1.071 & 0.14387 \tabularnewline
12 & 0.314746 & 2.6707 & 0.004676 \tabularnewline
13 & 0.095016 & 0.8062 & 0.21138 \tabularnewline
14 & 0.092184 & 0.7822 & 0.218328 \tabularnewline
15 & -0.024784 & -0.2103 & 0.417015 \tabularnewline
16 & -0.102079 & -0.8662 & 0.194638 \tabularnewline
17 & 0.151442 & 1.285 & 0.101451 \tabularnewline
18 & 0.001503 & 0.0128 & 0.49493 \tabularnewline
19 & 0.083131 & 0.7054 & 0.241422 \tabularnewline
20 & -0.031725 & -0.2692 & 0.394273 \tabularnewline
21 & -0.090566 & -0.7685 & 0.222359 \tabularnewline
22 & -0.040936 & -0.3474 & 0.364671 \tabularnewline
23 & -0.028884 & -0.2451 & 0.403542 \tabularnewline
24 & 0.000947 & 0.008 & 0.496807 \tabularnewline
25 & -0.019498 & -0.1654 & 0.434527 \tabularnewline
26 & -0.095338 & -0.809 & 0.210598 \tabularnewline
27 & -0.041606 & -0.353 & 0.362547 \tabularnewline
28 & -0.119335 & -1.0126 & 0.157322 \tabularnewline
29 & -0.080239 & -0.6808 & 0.249075 \tabularnewline
30 & -0.064658 & -0.5486 & 0.292474 \tabularnewline
31 & -0.079834 & -0.6774 & 0.250156 \tabularnewline
32 & -0.096799 & -0.8214 & 0.207074 \tabularnewline
33 & -0.107557 & -0.9127 & 0.182235 \tabularnewline
34 & -0.120235 & -1.0202 & 0.155517 \tabularnewline
35 & -0.114059 & -0.9678 & 0.168185 \tabularnewline
36 & -0.120391 & -1.0216 & 0.155207 \tabularnewline
37 & -0.125436 & -1.0644 & 0.145362 \tabularnewline
38 & -0.116631 & -0.9896 & 0.162831 \tabularnewline
39 & -0.129909 & -1.1023 & 0.136998 \tabularnewline
40 & -0.116237 & -0.9863 & 0.163644 \tabularnewline
41 & -0.109748 & -0.9312 & 0.177419 \tabularnewline
42 & -0.124006 & -1.0522 & 0.148107 \tabularnewline
43 & -0.122589 & -1.0402 & 0.150863 \tabularnewline
44 & -0.1304 & -1.1065 & 0.136101 \tabularnewline
45 & -0.131365 & -1.1147 & 0.13435 \tabularnewline
46 & -0.086848 & -0.7369 & 0.231781 \tabularnewline
47 & -0.0938 & -0.7959 & 0.214346 \tabularnewline
48 & -0.090269 & -0.766 & 0.223102 \tabularnewline
\hline
\end{tabular}
%Source: https://freestatistics.org/blog/index.php?pk=120579&T=1

[TABLE]
[ROW][C]Autocorrelation Function[/C][/ROW]
[ROW][C]Time lag k[/C][C]ACF(k)[/C][C]T-STAT[/C][C]P-value[/C][/ROW]
[ROW][C]1[/C][C]0.290996[/C][C]2.4692[/C][C]0.007958[/C][/ROW]
[ROW][C]2[/C][C]0.296873[/C][C]2.519[/C][C]0.006994[/C][/ROW]
[ROW][C]3[/C][C]0.1498[/C][C]1.2711[/C][C]0.103894[/C][/ROW]
[ROW][C]4[/C][C]0.102612[/C][C]0.8707[/C][C]0.193409[/C][/ROW]
[ROW][C]5[/C][C]0.310647[/C][C]2.6359[/C][C]0.005135[/C][/ROW]
[ROW][C]6[/C][C]0.046679[/C][C]0.3961[/C][C]0.346606[/C][/ROW]
[ROW][C]7[/C][C]0.228769[/C][C]1.9412[/C][C]0.028076[/C][/ROW]
[ROW][C]8[/C][C]0.205655[/C][C]1.745[/C][C]0.042622[/C][/ROW]
[ROW][C]9[/C][C]0.245498[/C][C]2.0831[/C][C]0.020396[/C][/ROW]
[ROW][C]10[/C][C]0.277348[/C][C]2.3534[/C][C]0.010669[/C][/ROW]
[ROW][C]11[/C][C]0.126221[/C][C]1.071[/C][C]0.14387[/C][/ROW]
[ROW][C]12[/C][C]0.314746[/C][C]2.6707[/C][C]0.004676[/C][/ROW]
[ROW][C]13[/C][C]0.095016[/C][C]0.8062[/C][C]0.21138[/C][/ROW]
[ROW][C]14[/C][C]0.092184[/C][C]0.7822[/C][C]0.218328[/C][/ROW]
[ROW][C]15[/C][C]-0.024784[/C][C]-0.2103[/C][C]0.417015[/C][/ROW]
[ROW][C]16[/C][C]-0.102079[/C][C]-0.8662[/C][C]0.194638[/C][/ROW]
[ROW][C]17[/C][C]0.151442[/C][C]1.285[/C][C]0.101451[/C][/ROW]
[ROW][C]18[/C][C]0.001503[/C][C]0.0128[/C][C]0.49493[/C][/ROW]
[ROW][C]19[/C][C]0.083131[/C][C]0.7054[/C][C]0.241422[/C][/ROW]
[ROW][C]20[/C][C]-0.031725[/C][C]-0.2692[/C][C]0.394273[/C][/ROW]
[ROW][C]21[/C][C]-0.090566[/C][C]-0.7685[/C][C]0.222359[/C][/ROW]
[ROW][C]22[/C][C]-0.040936[/C][C]-0.3474[/C][C]0.364671[/C][/ROW]
[ROW][C]23[/C][C]-0.028884[/C][C]-0.2451[/C][C]0.403542[/C][/ROW]
[ROW][C]24[/C][C]0.000947[/C][C]0.008[/C][C]0.496807[/C][/ROW]
[ROW][C]25[/C][C]-0.019498[/C][C]-0.1654[/C][C]0.434527[/C][/ROW]
[ROW][C]26[/C][C]-0.095338[/C][C]-0.809[/C][C]0.210598[/C][/ROW]
[ROW][C]27[/C][C]-0.041606[/C][C]-0.353[/C][C]0.362547[/C][/ROW]
[ROW][C]28[/C][C]-0.119335[/C][C]-1.0126[/C][C]0.157322[/C][/ROW]
[ROW][C]29[/C][C]-0.080239[/C][C]-0.6808[/C][C]0.249075[/C][/ROW]
[ROW][C]30[/C][C]-0.064658[/C][C]-0.5486[/C][C]0.292474[/C][/ROW]
[ROW][C]31[/C][C]-0.079834[/C][C]-0.6774[/C][C]0.250156[/C][/ROW]
[ROW][C]32[/C][C]-0.096799[/C][C]-0.8214[/C][C]0.207074[/C][/ROW]
[ROW][C]33[/C][C]-0.107557[/C][C]-0.9127[/C][C]0.182235[/C][/ROW]
[ROW][C]34[/C][C]-0.120235[/C][C]-1.0202[/C][C]0.155517[/C][/ROW]
[ROW][C]35[/C][C]-0.114059[/C][C]-0.9678[/C][C]0.168185[/C][/ROW]
[ROW][C]36[/C][C]-0.120391[/C][C]-1.0216[/C][C]0.155207[/C][/ROW]
[ROW][C]37[/C][C]-0.125436[/C][C]-1.0644[/C][C]0.145362[/C][/ROW]
[ROW][C]38[/C][C]-0.116631[/C][C]-0.9896[/C][C]0.162831[/C][/ROW]
[ROW][C]39[/C][C]-0.129909[/C][C]-1.1023[/C][C]0.136998[/C][/ROW]
[ROW][C]40[/C][C]-0.116237[/C][C]-0.9863[/C][C]0.163644[/C][/ROW]
[ROW][C]41[/C][C]-0.109748[/C][C]-0.9312[/C][C]0.177419[/C][/ROW]
[ROW][C]42[/C][C]-0.124006[/C][C]-1.0522[/C][C]0.148107[/C][/ROW]
[ROW][C]43[/C][C]-0.122589[/C][C]-1.0402[/C][C]0.150863[/C][/ROW]
[ROW][C]44[/C][C]-0.1304[/C][C]-1.1065[/C][C]0.136101[/C][/ROW]
[ROW][C]45[/C][C]-0.131365[/C][C]-1.1147[/C][C]0.13435[/C][/ROW]
[ROW][C]46[/C][C]-0.086848[/C][C]-0.7369[/C][C]0.231781[/C][/ROW]
[ROW][C]47[/C][C]-0.0938[/C][C]-0.7959[/C][C]0.214346[/C][/ROW]
[ROW][C]48[/C][C]-0.090269[/C][C]-0.766[/C][C]0.223102[/C][/ROW]
[/TABLE]
Source: https://freestatistics.org/blog/index.php?pk=120579&T=1

Globally Unique Identifier (entire table): ba.freestatistics.org/blog/index.php?pk=120579&T=1

As an alternative you can also use a QR Code:  

The GUIDs for individual cells are displayed in the table below:

Autocorrelation Function
Time lag kACF(k)T-STATP-value
10.2909962.46920.007958
20.2968732.5190.006994
30.14981.27110.103894
40.1026120.87070.193409
50.3106472.63590.005135
60.0466790.39610.346606
70.2287691.94120.028076
80.2056551.7450.042622
90.2454982.08310.020396
100.2773482.35340.010669
110.1262211.0710.14387
120.3147462.67070.004676
130.0950160.80620.21138
140.0921840.78220.218328
15-0.024784-0.21030.417015
16-0.102079-0.86620.194638
170.1514421.2850.101451
180.0015030.01280.49493
190.0831310.70540.241422
20-0.031725-0.26920.394273
21-0.090566-0.76850.222359
22-0.040936-0.34740.364671
23-0.028884-0.24510.403542
240.0009470.0080.496807
25-0.019498-0.16540.434527
26-0.095338-0.8090.210598
27-0.041606-0.3530.362547
28-0.119335-1.01260.157322
29-0.080239-0.68080.249075
30-0.064658-0.54860.292474
31-0.079834-0.67740.250156
32-0.096799-0.82140.207074
33-0.107557-0.91270.182235
34-0.120235-1.02020.155517
35-0.114059-0.96780.168185
36-0.120391-1.02160.155207
37-0.125436-1.06440.145362
38-0.116631-0.98960.162831
39-0.129909-1.10230.136998
40-0.116237-0.98630.163644
41-0.109748-0.93120.177419
42-0.124006-1.05220.148107
43-0.122589-1.04020.150863
44-0.1304-1.10650.136101
45-0.131365-1.11470.13435
46-0.086848-0.73690.231781
47-0.0938-0.79590.214346
48-0.090269-0.7660.223102


Partial Autocorrelation Function
Time lag kPACF(k)T-STATP-value
10.2909962.46920.007958
20.2318251.96710.026513
30.0184470.15650.438026
4-0.003695-0.03140.487536
50.2878922.44280.008513
6-0.127986-1.0860.140552
70.1340111.13710.129629
80.1550891.3160.096178
90.115580.98070.165006
100.060260.51130.305346
110.0196270.16650.4341
120.1876461.59220.057857
13-0.108191-0.9180.180834
14-0.094992-0.8060.211439
15-0.140706-1.19390.118212
16-0.152485-1.29390.099921
170.0714590.60640.273094
18-0.045569-0.38670.350073
19-0.071657-0.6080.272541
20-0.103013-0.87410.192487
21-0.127675-1.08340.141132
22-0.135486-1.14960.127049
230.1475991.25240.107234
240.0049650.04210.483257
250.0695310.590.278524
26-0.051644-0.43820.331272
270.0928030.78750.216798
28-0.027524-0.23350.407999
29-0.030636-0.260.39782
300.0863560.73280.233044
310.002570.02180.491332
32-0.068603-0.58210.281154
330.0712470.60460.273688
34-0.061137-0.51880.302757
35-0.131671-1.11730.133797
36-0.088148-0.7480.228459
37-0.101461-0.86090.196069
38-0.001781-0.01510.493993
39-0.012656-0.10740.45739
40-0.020671-0.17540.430631
41-0.003998-0.03390.486517
42-0.11336-0.96190.169663
430.0031250.02650.489458
44-0.001982-0.01680.493314
450.052150.44250.329725
460.1321731.12150.132896
470.0387680.3290.371572
480.003070.0260.489645

\begin{tabular}{lllllllll}
\hline
Partial Autocorrelation Function \tabularnewline
Time lag k & PACF(k) & T-STAT & P-value \tabularnewline
1 & 0.290996 & 2.4692 & 0.007958 \tabularnewline
2 & 0.231825 & 1.9671 & 0.026513 \tabularnewline
3 & 0.018447 & 0.1565 & 0.438026 \tabularnewline
4 & -0.003695 & -0.0314 & 0.487536 \tabularnewline
5 & 0.287892 & 2.4428 & 0.008513 \tabularnewline
6 & -0.127986 & -1.086 & 0.140552 \tabularnewline
7 & 0.134011 & 1.1371 & 0.129629 \tabularnewline
8 & 0.155089 & 1.316 & 0.096178 \tabularnewline
9 & 0.11558 & 0.9807 & 0.165006 \tabularnewline
10 & 0.06026 & 0.5113 & 0.305346 \tabularnewline
11 & 0.019627 & 0.1665 & 0.4341 \tabularnewline
12 & 0.187646 & 1.5922 & 0.057857 \tabularnewline
13 & -0.108191 & -0.918 & 0.180834 \tabularnewline
14 & -0.094992 & -0.806 & 0.211439 \tabularnewline
15 & -0.140706 & -1.1939 & 0.118212 \tabularnewline
16 & -0.152485 & -1.2939 & 0.099921 \tabularnewline
17 & 0.071459 & 0.6064 & 0.273094 \tabularnewline
18 & -0.045569 & -0.3867 & 0.350073 \tabularnewline
19 & -0.071657 & -0.608 & 0.272541 \tabularnewline
20 & -0.103013 & -0.8741 & 0.192487 \tabularnewline
21 & -0.127675 & -1.0834 & 0.141132 \tabularnewline
22 & -0.135486 & -1.1496 & 0.127049 \tabularnewline
23 & 0.147599 & 1.2524 & 0.107234 \tabularnewline
24 & 0.004965 & 0.0421 & 0.483257 \tabularnewline
25 & 0.069531 & 0.59 & 0.278524 \tabularnewline
26 & -0.051644 & -0.4382 & 0.331272 \tabularnewline
27 & 0.092803 & 0.7875 & 0.216798 \tabularnewline
28 & -0.027524 & -0.2335 & 0.407999 \tabularnewline
29 & -0.030636 & -0.26 & 0.39782 \tabularnewline
30 & 0.086356 & 0.7328 & 0.233044 \tabularnewline
31 & 0.00257 & 0.0218 & 0.491332 \tabularnewline
32 & -0.068603 & -0.5821 & 0.281154 \tabularnewline
33 & 0.071247 & 0.6046 & 0.273688 \tabularnewline
34 & -0.061137 & -0.5188 & 0.302757 \tabularnewline
35 & -0.131671 & -1.1173 & 0.133797 \tabularnewline
36 & -0.088148 & -0.748 & 0.228459 \tabularnewline
37 & -0.101461 & -0.8609 & 0.196069 \tabularnewline
38 & -0.001781 & -0.0151 & 0.493993 \tabularnewline
39 & -0.012656 & -0.1074 & 0.45739 \tabularnewline
40 & -0.020671 & -0.1754 & 0.430631 \tabularnewline
41 & -0.003998 & -0.0339 & 0.486517 \tabularnewline
42 & -0.11336 & -0.9619 & 0.169663 \tabularnewline
43 & 0.003125 & 0.0265 & 0.489458 \tabularnewline
44 & -0.001982 & -0.0168 & 0.493314 \tabularnewline
45 & 0.05215 & 0.4425 & 0.329725 \tabularnewline
46 & 0.132173 & 1.1215 & 0.132896 \tabularnewline
47 & 0.038768 & 0.329 & 0.371572 \tabularnewline
48 & 0.00307 & 0.026 & 0.489645 \tabularnewline
\hline
\end{tabular}
%Source: https://freestatistics.org/blog/index.php?pk=120579&T=2

[TABLE]
[ROW][C]Partial Autocorrelation Function[/C][/ROW]
[ROW][C]Time lag k[/C][C]PACF(k)[/C][C]T-STAT[/C][C]P-value[/C][/ROW]
[ROW][C]1[/C][C]0.290996[/C][C]2.4692[/C][C]0.007958[/C][/ROW]
[ROW][C]2[/C][C]0.231825[/C][C]1.9671[/C][C]0.026513[/C][/ROW]
[ROW][C]3[/C][C]0.018447[/C][C]0.1565[/C][C]0.438026[/C][/ROW]
[ROW][C]4[/C][C]-0.003695[/C][C]-0.0314[/C][C]0.487536[/C][/ROW]
[ROW][C]5[/C][C]0.287892[/C][C]2.4428[/C][C]0.008513[/C][/ROW]
[ROW][C]6[/C][C]-0.127986[/C][C]-1.086[/C][C]0.140552[/C][/ROW]
[ROW][C]7[/C][C]0.134011[/C][C]1.1371[/C][C]0.129629[/C][/ROW]
[ROW][C]8[/C][C]0.155089[/C][C]1.316[/C][C]0.096178[/C][/ROW]
[ROW][C]9[/C][C]0.11558[/C][C]0.9807[/C][C]0.165006[/C][/ROW]
[ROW][C]10[/C][C]0.06026[/C][C]0.5113[/C][C]0.305346[/C][/ROW]
[ROW][C]11[/C][C]0.019627[/C][C]0.1665[/C][C]0.4341[/C][/ROW]
[ROW][C]12[/C][C]0.187646[/C][C]1.5922[/C][C]0.057857[/C][/ROW]
[ROW][C]13[/C][C]-0.108191[/C][C]-0.918[/C][C]0.180834[/C][/ROW]
[ROW][C]14[/C][C]-0.094992[/C][C]-0.806[/C][C]0.211439[/C][/ROW]
[ROW][C]15[/C][C]-0.140706[/C][C]-1.1939[/C][C]0.118212[/C][/ROW]
[ROW][C]16[/C][C]-0.152485[/C][C]-1.2939[/C][C]0.099921[/C][/ROW]
[ROW][C]17[/C][C]0.071459[/C][C]0.6064[/C][C]0.273094[/C][/ROW]
[ROW][C]18[/C][C]-0.045569[/C][C]-0.3867[/C][C]0.350073[/C][/ROW]
[ROW][C]19[/C][C]-0.071657[/C][C]-0.608[/C][C]0.272541[/C][/ROW]
[ROW][C]20[/C][C]-0.103013[/C][C]-0.8741[/C][C]0.192487[/C][/ROW]
[ROW][C]21[/C][C]-0.127675[/C][C]-1.0834[/C][C]0.141132[/C][/ROW]
[ROW][C]22[/C][C]-0.135486[/C][C]-1.1496[/C][C]0.127049[/C][/ROW]
[ROW][C]23[/C][C]0.147599[/C][C]1.2524[/C][C]0.107234[/C][/ROW]
[ROW][C]24[/C][C]0.004965[/C][C]0.0421[/C][C]0.483257[/C][/ROW]
[ROW][C]25[/C][C]0.069531[/C][C]0.59[/C][C]0.278524[/C][/ROW]
[ROW][C]26[/C][C]-0.051644[/C][C]-0.4382[/C][C]0.331272[/C][/ROW]
[ROW][C]27[/C][C]0.092803[/C][C]0.7875[/C][C]0.216798[/C][/ROW]
[ROW][C]28[/C][C]-0.027524[/C][C]-0.2335[/C][C]0.407999[/C][/ROW]
[ROW][C]29[/C][C]-0.030636[/C][C]-0.26[/C][C]0.39782[/C][/ROW]
[ROW][C]30[/C][C]0.086356[/C][C]0.7328[/C][C]0.233044[/C][/ROW]
[ROW][C]31[/C][C]0.00257[/C][C]0.0218[/C][C]0.491332[/C][/ROW]
[ROW][C]32[/C][C]-0.068603[/C][C]-0.5821[/C][C]0.281154[/C][/ROW]
[ROW][C]33[/C][C]0.071247[/C][C]0.6046[/C][C]0.273688[/C][/ROW]
[ROW][C]34[/C][C]-0.061137[/C][C]-0.5188[/C][C]0.302757[/C][/ROW]
[ROW][C]35[/C][C]-0.131671[/C][C]-1.1173[/C][C]0.133797[/C][/ROW]
[ROW][C]36[/C][C]-0.088148[/C][C]-0.748[/C][C]0.228459[/C][/ROW]
[ROW][C]37[/C][C]-0.101461[/C][C]-0.8609[/C][C]0.196069[/C][/ROW]
[ROW][C]38[/C][C]-0.001781[/C][C]-0.0151[/C][C]0.493993[/C][/ROW]
[ROW][C]39[/C][C]-0.012656[/C][C]-0.1074[/C][C]0.45739[/C][/ROW]
[ROW][C]40[/C][C]-0.020671[/C][C]-0.1754[/C][C]0.430631[/C][/ROW]
[ROW][C]41[/C][C]-0.003998[/C][C]-0.0339[/C][C]0.486517[/C][/ROW]
[ROW][C]42[/C][C]-0.11336[/C][C]-0.9619[/C][C]0.169663[/C][/ROW]
[ROW][C]43[/C][C]0.003125[/C][C]0.0265[/C][C]0.489458[/C][/ROW]
[ROW][C]44[/C][C]-0.001982[/C][C]-0.0168[/C][C]0.493314[/C][/ROW]
[ROW][C]45[/C][C]0.05215[/C][C]0.4425[/C][C]0.329725[/C][/ROW]
[ROW][C]46[/C][C]0.132173[/C][C]1.1215[/C][C]0.132896[/C][/ROW]
[ROW][C]47[/C][C]0.038768[/C][C]0.329[/C][C]0.371572[/C][/ROW]
[ROW][C]48[/C][C]0.00307[/C][C]0.026[/C][C]0.489645[/C][/ROW]
[/TABLE]
Source: https://freestatistics.org/blog/index.php?pk=120579&T=2

Globally Unique Identifier (entire table): ba.freestatistics.org/blog/index.php?pk=120579&T=2

As an alternative you can also use a QR Code:  

The GUIDs for individual cells are displayed in the table below:

Partial Autocorrelation Function
Time lag kPACF(k)T-STATP-value
10.2909962.46920.007958
20.2318251.96710.026513
30.0184470.15650.438026
4-0.003695-0.03140.487536
50.2878922.44280.008513
6-0.127986-1.0860.140552
70.1340111.13710.129629
80.1550891.3160.096178
90.115580.98070.165006
100.060260.51130.305346
110.0196270.16650.4341
120.1876461.59220.057857
13-0.108191-0.9180.180834
14-0.094992-0.8060.211439
15-0.140706-1.19390.118212
16-0.152485-1.29390.099921
170.0714590.60640.273094
18-0.045569-0.38670.350073
19-0.071657-0.6080.272541
20-0.103013-0.87410.192487
21-0.127675-1.08340.141132
22-0.135486-1.14960.127049
230.1475991.25240.107234
240.0049650.04210.483257
250.0695310.590.278524
26-0.051644-0.43820.331272
270.0928030.78750.216798
28-0.027524-0.23350.407999
29-0.030636-0.260.39782
300.0863560.73280.233044
310.002570.02180.491332
32-0.068603-0.58210.281154
330.0712470.60460.273688
34-0.061137-0.51880.302757
35-0.131671-1.11730.133797
36-0.088148-0.7480.228459
37-0.101461-0.86090.196069
38-0.001781-0.01510.493993
39-0.012656-0.10740.45739
40-0.020671-0.17540.430631
41-0.003998-0.03390.486517
42-0.11336-0.96190.169663
430.0031250.02650.489458
44-0.001982-0.01680.493314
450.052150.44250.329725
460.1321731.12150.132896
470.0387680.3290.371572
480.003070.0260.489645


Parameters (Session):
par1 = 48 ; par2 = 1 ; par3 = 0 ; par4 = 0 ; par5 = 12 ; par6 = White Noise ; par7 = 0.95 ;
Parameters (R input):
par1 = 48 ; par2 = 1 ; par3 = 0 ; par4 = 0 ; par5 = 12 ; par6 = White Noise ; par7 = 0.95 ; par8 = ;
R code (references can be found in the software module):
if (par1 == 'Default') {
par1 = 10*log10(length(x))
} else {
par1 <- as.numeric(par1)
}
par2 <- as.numeric(par2)
par3 <- as.numeric(par3)
par4 <- as.numeric(par4)
par5 <- as.numeric(par5)
if (par6 == 'White Noise') par6 <- 'white' else par6 <- 'ma'
par7 <- as.numeric(par7)
if (par8 != '') par8 <- as.numeric(par8)
ox <- x
if (par8 == '') {
if (par2 == 0) {
x <- log(x)
} else {
x <- (x ^ par2 - 1) / par2
}
} else {
x <- log(x,base=par8)
}
if (par3 > 0) x <- diff(x,lag=1,difference=par3)
if (par4 > 0) x <- diff(x,lag=par5,difference=par4)
bitmap(file='picts.png')
op <- par(mfrow=c(2,1))
plot(ox,type='l',main='Original Time Series',xlab='time',ylab='value')
if (par8=='') {
mytitle <- paste('Working Time Series (lambda=',par2,', d=',par3,', D=',par4,')',sep='')
mysub <- paste('(lambda=',par2,', d=',par3,', D=',par4,', CI=', par7, ', CI type=',par6,')',sep='')
} else {
mytitle <- paste('Working Time Series (base=',par8,', d=',par3,', D=',par4,')',sep='')
mysub <- paste('(base=',par8,', d=',par3,', D=',par4,', CI=', par7, ', CI type=',par6,')',sep='')
}
plot(x,type='l', main=mytitle,xlab='time',ylab='value')
par(op)
dev.off()
bitmap(file='pic1.png')
racf <- acf(x, par1, main='Autocorrelation', xlab='time lag', ylab='ACF', ci.type=par6, ci=par7, sub=mysub)
dev.off()
bitmap(file='pic2.png')
rpacf <- pacf(x,par1,main='Partial Autocorrelation',xlab='lags',ylab='PACF',sub=mysub)
dev.off()
(myacf <- c(racf$acf))
(mypacf <- c(rpacf$acf))
lengthx <- length(x)
sqrtn <- sqrt(lengthx)
load(file='createtable')
a<-table.start()
a<-table.row.start(a)
a<-table.element(a,'Autocorrelation Function',4,TRUE)
a<-table.row.end(a)
a<-table.row.start(a)
a<-table.element(a,'Time lag k',header=TRUE)
a<-table.element(a,hyperlink('basics.htm','ACF(k)','click here for more information about the Autocorrelation Function'),header=TRUE)
a<-table.element(a,'T-STAT',header=TRUE)
a<-table.element(a,'P-value',header=TRUE)
a<-table.row.end(a)
for (i in 2:(par1+1)) {
a<-table.row.start(a)
a<-table.element(a,i-1,header=TRUE)
a<-table.element(a,round(myacf[i],6))
mytstat <- myacf[i]*sqrtn
a<-table.element(a,round(mytstat,4))
a<-table.element(a,round(1-pt(abs(mytstat),lengthx),6))
a<-table.row.end(a)
}
a<-table.end(a)
table.save(a,file='mytable.tab')
a<-table.start()
a<-table.row.start(a)
a<-table.element(a,'Partial Autocorrelation Function',4,TRUE)
a<-table.row.end(a)
a<-table.row.start(a)
a<-table.element(a,'Time lag k',header=TRUE)
a<-table.element(a,hyperlink('basics.htm','PACF(k)','click here for more information about the Partial Autocorrelation Function'),header=TRUE)
a<-table.element(a,'T-STAT',header=TRUE)
a<-table.element(a,'P-value',header=TRUE)
a<-table.row.end(a)
for (i in 1:par1) {
a<-table.row.start(a)
a<-table.element(a,i,header=TRUE)
a<-table.element(a,round(mypacf[i],6))
mytstat <- mypacf[i]*sqrtn
a<-table.element(a,round(mytstat,4))
a<-table.element(a,round(1-pt(abs(mytstat),lengthx),6))
a<-table.row.end(a)
}
a<-table.end(a)
table.save(a,file='mytable1.tab')