Free Statistics

of Irreproducible Research!

Author's title

Author*Unverified author*
R Software Modulerwasp_autocorrelation.wasp
Title produced by software(Partial) Autocorrelation Function
Date of computationTue, 12 Apr 2011 20:58:35 +0000
Cite this page as followsStatistical Computations at FreeStatistics.org, Office for Research Development and Education, URL https://freestatistics.org/blog/index.php?v=date/2011/Apr/12/t13026417008v3ioc7t3pqmx2z.htm/, Retrieved Thu, 09 May 2024 03:32:38 +0000
Statistical Computations at FreeStatistics.org, Office for Research Development and Education, URL https://freestatistics.org/blog/index.php?pk=120566, Retrieved Thu, 09 May 2024 03:32:38 +0000
QR Codes:

Original text written by user:
IsPrivate?No (this computation is public)
User-defined keywordsKDGP2W12
Estimated Impact125
Family? (F = Feedback message, R = changed R code, M = changed R Module, P = changed Parameters, D = changed Data)
-     [(Partial) Autocorrelation Function] [Autocorrelation -...] [2011-04-12 20:14:58] [fdcbad17201bb4b30a5932c6e61b925d]
-   PD  [(Partial) Autocorrelation Function] [autocorrelation -...] [2011-04-12 20:43:58] [fdcbad17201bb4b30a5932c6e61b925d]
- R P       [(Partial) Autocorrelation Function] [autocorrelation 2...] [2011-04-12 20:58:35] [70eb62609fa967e8827cfcb09ffdb915] [Current]
Feedback Forum

Post a new message
Dataseries X:
131676
135050
129070
137792
139762
142917
144198
142648
152170
136022
138142
138135
135027
132911
133976
137012
119610
118106
120383
133185
131416
134248
134397
127728
131837
125955
134187
143291
145074
149812
144668
147253
145568
155564
155872
156323
158010
155598
154785
157294
162938
157283
166074
169282
172552
174055
175409
173696
171283
173322
170717
174229
175339
173511
175839
173816
173990
174777
174819
176726
176199
180952
176663
182346
180605
182497
187856
190020
190108
193288
193230
199068
195076
191563
191067
186665
185508
184371
183046
175714
175768
171029
170465
170102
156389
124291
99360
86675
85056
128236
164257
162401
152779
156005
153387
153190
148840
144211
145953
145542
150271
147489
143824
134754
131736
126304
125511
125495
130133
126257
110323
98417
105749
120665
124075
127245
146731
144979
148210
144670
142970
142524
146142
146522
148128
148798
150181
152388
155694
160662
155520
158262
154338
158196
160371
154856
150636
145899
141242
140834
141119
139104
134437
129425
123155
119273
120472
121523
121983
123658
124794
124827
120382
117395
115790
114283
117271
117448
118764
120550
123554
125412
124182
119828
115361
114226
115214
115864
114276
113469
114883
114172
111225
112149
115618
118002
121382
120663


Summary of computational transaction
Raw Inputview raw input (R code)
Raw Outputview raw output of R engine
Computing time3 seconds
R Server'Gwilym Jenkins' @ www.wessa.org

\begin{tabular}{lllllllll}
\hline
Summary of computational transaction \tabularnewline
Raw Input & view raw input (R code)  \tabularnewline
Raw Output & view raw output of R engine  \tabularnewline
Computing time & 3 seconds \tabularnewline
R Server & 'Gwilym Jenkins' @ www.wessa.org \tabularnewline
\hline
\end{tabular}
%Source: https://freestatistics.org/blog/index.php?pk=120566&T=0

[TABLE]
[ROW][C]Summary of computational transaction[/C][/ROW]
[ROW][C]Raw Input[/C][C]view raw input (R code) [/C][/ROW]
[ROW][C]Raw Output[/C][C]view raw output of R engine [/C][/ROW]
[ROW][C]Computing time[/C][C]3 seconds[/C][/ROW]
[ROW][C]R Server[/C][C]'Gwilym Jenkins' @ www.wessa.org[/C][/ROW]
[/TABLE]
Source: https://freestatistics.org/blog/index.php?pk=120566&T=0

Globally Unique Identifier (entire table): ba.freestatistics.org/blog/index.php?pk=120566&T=0

As an alternative you can also use a QR Code:  

The GUIDs for individual cells are displayed in the table below:

Summary of computational transaction
Raw Inputview raw input (R code)
Raw Outputview raw output of R engine
Computing time3 seconds
R Server'Gwilym Jenkins' @ www.wessa.org


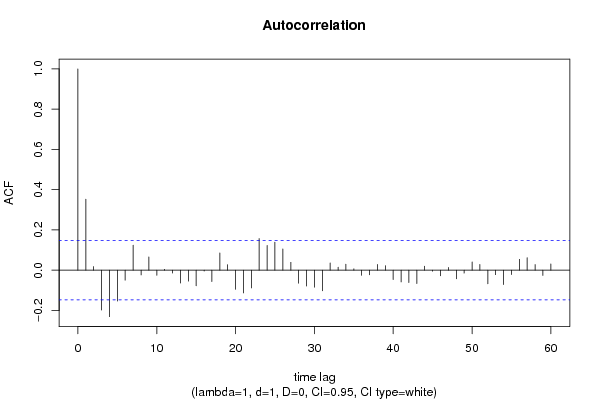
Autocorrelation Function
Time lag kACF(k)T-STATP-value
10.3524174.68863e-06
20.0178470.23740.406296
3-0.198198-2.63690.004556
4-0.230974-3.07290.001228
5-0.15361-2.04370.021235
6-0.0494-0.65720.255946
70.124061.65050.050306
8-0.02332-0.31030.378366
90.0653490.86940.192899
10-0.025543-0.33980.367193
110.0041960.05580.47777
12-0.014496-0.19290.423645
13-0.064057-0.85220.197621
14-0.054288-0.72230.235546
15-0.077337-1.02890.152465
16-0.004367-0.05810.47687
17-0.056044-0.74560.228443
180.0858321.14190.127516
190.0266710.35480.361567
20-0.094678-1.25960.104733
21-0.112881-1.50180.067468
22-0.088021-1.1710.121578
230.1566882.08460.019271
240.1223761.62810.05264
250.13921.85190.03285
260.1052761.40060.081541
270.0387110.5150.30359
28-0.064427-0.85710.196262
29-0.079087-1.05220.147076
30-0.084306-1.12160.131771
31-0.101952-1.35640.088352
320.0360320.47940.31613
330.0145360.19340.423436
340.0291160.38740.349476
350.0065720.08740.465213
36-0.02494-0.33180.370214
37-0.022541-0.29990.382306
380.0282010.37520.353982
390.0222790.29640.383636
40-0.046285-0.61580.269415
41-0.058386-0.77680.219165
42-0.061662-0.82040.206556
43-0.066394-0.88330.189131
440.0191540.25480.399578
45-0.004807-0.0640.474539
46-0.028132-0.37430.354327
470.0135060.17970.428804
48-0.042807-0.56950.284866
49-0.014538-0.19340.42343
500.0404640.53830.295511
510.0284150.3780.352929
52-0.067406-0.89680.185529
53-0.022359-0.29750.38323
54-0.071259-0.9480.172201
55-0.021521-0.28630.387487
560.0535740.71280.238468
570.0620840.8260.204965
580.0277230.36880.356346
59-0.025853-0.3440.365645
600.0311460.41440.33955

\begin{tabular}{lllllllll}
\hline
Autocorrelation Function \tabularnewline
Time lag k & ACF(k) & T-STAT & P-value \tabularnewline
1 & 0.352417 & 4.6886 & 3e-06 \tabularnewline
2 & 0.017847 & 0.2374 & 0.406296 \tabularnewline
3 & -0.198198 & -2.6369 & 0.004556 \tabularnewline
4 & -0.230974 & -3.0729 & 0.001228 \tabularnewline
5 & -0.15361 & -2.0437 & 0.021235 \tabularnewline
6 & -0.0494 & -0.6572 & 0.255946 \tabularnewline
7 & 0.12406 & 1.6505 & 0.050306 \tabularnewline
8 & -0.02332 & -0.3103 & 0.378366 \tabularnewline
9 & 0.065349 & 0.8694 & 0.192899 \tabularnewline
10 & -0.025543 & -0.3398 & 0.367193 \tabularnewline
11 & 0.004196 & 0.0558 & 0.47777 \tabularnewline
12 & -0.014496 & -0.1929 & 0.423645 \tabularnewline
13 & -0.064057 & -0.8522 & 0.197621 \tabularnewline
14 & -0.054288 & -0.7223 & 0.235546 \tabularnewline
15 & -0.077337 & -1.0289 & 0.152465 \tabularnewline
16 & -0.004367 & -0.0581 & 0.47687 \tabularnewline
17 & -0.056044 & -0.7456 & 0.228443 \tabularnewline
18 & 0.085832 & 1.1419 & 0.127516 \tabularnewline
19 & 0.026671 & 0.3548 & 0.361567 \tabularnewline
20 & -0.094678 & -1.2596 & 0.104733 \tabularnewline
21 & -0.112881 & -1.5018 & 0.067468 \tabularnewline
22 & -0.088021 & -1.171 & 0.121578 \tabularnewline
23 & 0.156688 & 2.0846 & 0.019271 \tabularnewline
24 & 0.122376 & 1.6281 & 0.05264 \tabularnewline
25 & 0.1392 & 1.8519 & 0.03285 \tabularnewline
26 & 0.105276 & 1.4006 & 0.081541 \tabularnewline
27 & 0.038711 & 0.515 & 0.30359 \tabularnewline
28 & -0.064427 & -0.8571 & 0.196262 \tabularnewline
29 & -0.079087 & -1.0522 & 0.147076 \tabularnewline
30 & -0.084306 & -1.1216 & 0.131771 \tabularnewline
31 & -0.101952 & -1.3564 & 0.088352 \tabularnewline
32 & 0.036032 & 0.4794 & 0.31613 \tabularnewline
33 & 0.014536 & 0.1934 & 0.423436 \tabularnewline
34 & 0.029116 & 0.3874 & 0.349476 \tabularnewline
35 & 0.006572 & 0.0874 & 0.465213 \tabularnewline
36 & -0.02494 & -0.3318 & 0.370214 \tabularnewline
37 & -0.022541 & -0.2999 & 0.382306 \tabularnewline
38 & 0.028201 & 0.3752 & 0.353982 \tabularnewline
39 & 0.022279 & 0.2964 & 0.383636 \tabularnewline
40 & -0.046285 & -0.6158 & 0.269415 \tabularnewline
41 & -0.058386 & -0.7768 & 0.219165 \tabularnewline
42 & -0.061662 & -0.8204 & 0.206556 \tabularnewline
43 & -0.066394 & -0.8833 & 0.189131 \tabularnewline
44 & 0.019154 & 0.2548 & 0.399578 \tabularnewline
45 & -0.004807 & -0.064 & 0.474539 \tabularnewline
46 & -0.028132 & -0.3743 & 0.354327 \tabularnewline
47 & 0.013506 & 0.1797 & 0.428804 \tabularnewline
48 & -0.042807 & -0.5695 & 0.284866 \tabularnewline
49 & -0.014538 & -0.1934 & 0.42343 \tabularnewline
50 & 0.040464 & 0.5383 & 0.295511 \tabularnewline
51 & 0.028415 & 0.378 & 0.352929 \tabularnewline
52 & -0.067406 & -0.8968 & 0.185529 \tabularnewline
53 & -0.022359 & -0.2975 & 0.38323 \tabularnewline
54 & -0.071259 & -0.948 & 0.172201 \tabularnewline
55 & -0.021521 & -0.2863 & 0.387487 \tabularnewline
56 & 0.053574 & 0.7128 & 0.238468 \tabularnewline
57 & 0.062084 & 0.826 & 0.204965 \tabularnewline
58 & 0.027723 & 0.3688 & 0.356346 \tabularnewline
59 & -0.025853 & -0.344 & 0.365645 \tabularnewline
60 & 0.031146 & 0.4144 & 0.33955 \tabularnewline
\hline
\end{tabular}
%Source: https://freestatistics.org/blog/index.php?pk=120566&T=1

[TABLE]
[ROW][C]Autocorrelation Function[/C][/ROW]
[ROW][C]Time lag k[/C][C]ACF(k)[/C][C]T-STAT[/C][C]P-value[/C][/ROW]
[ROW][C]1[/C][C]0.352417[/C][C]4.6886[/C][C]3e-06[/C][/ROW]
[ROW][C]2[/C][C]0.017847[/C][C]0.2374[/C][C]0.406296[/C][/ROW]
[ROW][C]3[/C][C]-0.198198[/C][C]-2.6369[/C][C]0.004556[/C][/ROW]
[ROW][C]4[/C][C]-0.230974[/C][C]-3.0729[/C][C]0.001228[/C][/ROW]
[ROW][C]5[/C][C]-0.15361[/C][C]-2.0437[/C][C]0.021235[/C][/ROW]
[ROW][C]6[/C][C]-0.0494[/C][C]-0.6572[/C][C]0.255946[/C][/ROW]
[ROW][C]7[/C][C]0.12406[/C][C]1.6505[/C][C]0.050306[/C][/ROW]
[ROW][C]8[/C][C]-0.02332[/C][C]-0.3103[/C][C]0.378366[/C][/ROW]
[ROW][C]9[/C][C]0.065349[/C][C]0.8694[/C][C]0.192899[/C][/ROW]
[ROW][C]10[/C][C]-0.025543[/C][C]-0.3398[/C][C]0.367193[/C][/ROW]
[ROW][C]11[/C][C]0.004196[/C][C]0.0558[/C][C]0.47777[/C][/ROW]
[ROW][C]12[/C][C]-0.014496[/C][C]-0.1929[/C][C]0.423645[/C][/ROW]
[ROW][C]13[/C][C]-0.064057[/C][C]-0.8522[/C][C]0.197621[/C][/ROW]
[ROW][C]14[/C][C]-0.054288[/C][C]-0.7223[/C][C]0.235546[/C][/ROW]
[ROW][C]15[/C][C]-0.077337[/C][C]-1.0289[/C][C]0.152465[/C][/ROW]
[ROW][C]16[/C][C]-0.004367[/C][C]-0.0581[/C][C]0.47687[/C][/ROW]
[ROW][C]17[/C][C]-0.056044[/C][C]-0.7456[/C][C]0.228443[/C][/ROW]
[ROW][C]18[/C][C]0.085832[/C][C]1.1419[/C][C]0.127516[/C][/ROW]
[ROW][C]19[/C][C]0.026671[/C][C]0.3548[/C][C]0.361567[/C][/ROW]
[ROW][C]20[/C][C]-0.094678[/C][C]-1.2596[/C][C]0.104733[/C][/ROW]
[ROW][C]21[/C][C]-0.112881[/C][C]-1.5018[/C][C]0.067468[/C][/ROW]
[ROW][C]22[/C][C]-0.088021[/C][C]-1.171[/C][C]0.121578[/C][/ROW]
[ROW][C]23[/C][C]0.156688[/C][C]2.0846[/C][C]0.019271[/C][/ROW]
[ROW][C]24[/C][C]0.122376[/C][C]1.6281[/C][C]0.05264[/C][/ROW]
[ROW][C]25[/C][C]0.1392[/C][C]1.8519[/C][C]0.03285[/C][/ROW]
[ROW][C]26[/C][C]0.105276[/C][C]1.4006[/C][C]0.081541[/C][/ROW]
[ROW][C]27[/C][C]0.038711[/C][C]0.515[/C][C]0.30359[/C][/ROW]
[ROW][C]28[/C][C]-0.064427[/C][C]-0.8571[/C][C]0.196262[/C][/ROW]
[ROW][C]29[/C][C]-0.079087[/C][C]-1.0522[/C][C]0.147076[/C][/ROW]
[ROW][C]30[/C][C]-0.084306[/C][C]-1.1216[/C][C]0.131771[/C][/ROW]
[ROW][C]31[/C][C]-0.101952[/C][C]-1.3564[/C][C]0.088352[/C][/ROW]
[ROW][C]32[/C][C]0.036032[/C][C]0.4794[/C][C]0.31613[/C][/ROW]
[ROW][C]33[/C][C]0.014536[/C][C]0.1934[/C][C]0.423436[/C][/ROW]
[ROW][C]34[/C][C]0.029116[/C][C]0.3874[/C][C]0.349476[/C][/ROW]
[ROW][C]35[/C][C]0.006572[/C][C]0.0874[/C][C]0.465213[/C][/ROW]
[ROW][C]36[/C][C]-0.02494[/C][C]-0.3318[/C][C]0.370214[/C][/ROW]
[ROW][C]37[/C][C]-0.022541[/C][C]-0.2999[/C][C]0.382306[/C][/ROW]
[ROW][C]38[/C][C]0.028201[/C][C]0.3752[/C][C]0.353982[/C][/ROW]
[ROW][C]39[/C][C]0.022279[/C][C]0.2964[/C][C]0.383636[/C][/ROW]
[ROW][C]40[/C][C]-0.046285[/C][C]-0.6158[/C][C]0.269415[/C][/ROW]
[ROW][C]41[/C][C]-0.058386[/C][C]-0.7768[/C][C]0.219165[/C][/ROW]
[ROW][C]42[/C][C]-0.061662[/C][C]-0.8204[/C][C]0.206556[/C][/ROW]
[ROW][C]43[/C][C]-0.066394[/C][C]-0.8833[/C][C]0.189131[/C][/ROW]
[ROW][C]44[/C][C]0.019154[/C][C]0.2548[/C][C]0.399578[/C][/ROW]
[ROW][C]45[/C][C]-0.004807[/C][C]-0.064[/C][C]0.474539[/C][/ROW]
[ROW][C]46[/C][C]-0.028132[/C][C]-0.3743[/C][C]0.354327[/C][/ROW]
[ROW][C]47[/C][C]0.013506[/C][C]0.1797[/C][C]0.428804[/C][/ROW]
[ROW][C]48[/C][C]-0.042807[/C][C]-0.5695[/C][C]0.284866[/C][/ROW]
[ROW][C]49[/C][C]-0.014538[/C][C]-0.1934[/C][C]0.42343[/C][/ROW]
[ROW][C]50[/C][C]0.040464[/C][C]0.5383[/C][C]0.295511[/C][/ROW]
[ROW][C]51[/C][C]0.028415[/C][C]0.378[/C][C]0.352929[/C][/ROW]
[ROW][C]52[/C][C]-0.067406[/C][C]-0.8968[/C][C]0.185529[/C][/ROW]
[ROW][C]53[/C][C]-0.022359[/C][C]-0.2975[/C][C]0.38323[/C][/ROW]
[ROW][C]54[/C][C]-0.071259[/C][C]-0.948[/C][C]0.172201[/C][/ROW]
[ROW][C]55[/C][C]-0.021521[/C][C]-0.2863[/C][C]0.387487[/C][/ROW]
[ROW][C]56[/C][C]0.053574[/C][C]0.7128[/C][C]0.238468[/C][/ROW]
[ROW][C]57[/C][C]0.062084[/C][C]0.826[/C][C]0.204965[/C][/ROW]
[ROW][C]58[/C][C]0.027723[/C][C]0.3688[/C][C]0.356346[/C][/ROW]
[ROW][C]59[/C][C]-0.025853[/C][C]-0.344[/C][C]0.365645[/C][/ROW]
[ROW][C]60[/C][C]0.031146[/C][C]0.4144[/C][C]0.33955[/C][/ROW]
[/TABLE]
Source: https://freestatistics.org/blog/index.php?pk=120566&T=1

Globally Unique Identifier (entire table): ba.freestatistics.org/blog/index.php?pk=120566&T=1

As an alternative you can also use a QR Code:  

The GUIDs for individual cells are displayed in the table below:

Autocorrelation Function
Time lag kACF(k)T-STATP-value
10.3524174.68863e-06
20.0178470.23740.406296
3-0.198198-2.63690.004556
4-0.230974-3.07290.001228
5-0.15361-2.04370.021235
6-0.0494-0.65720.255946
70.124061.65050.050306
8-0.02332-0.31030.378366
90.0653490.86940.192899
10-0.025543-0.33980.367193
110.0041960.05580.47777
12-0.014496-0.19290.423645
13-0.064057-0.85220.197621
14-0.054288-0.72230.235546
15-0.077337-1.02890.152465
16-0.004367-0.05810.47687
17-0.056044-0.74560.228443
180.0858321.14190.127516
190.0266710.35480.361567
20-0.094678-1.25960.104733
21-0.112881-1.50180.067468
22-0.088021-1.1710.121578
230.1566882.08460.019271
240.1223761.62810.05264
250.13921.85190.03285
260.1052761.40060.081541
270.0387110.5150.30359
28-0.064427-0.85710.196262
29-0.079087-1.05220.147076
30-0.084306-1.12160.131771
31-0.101952-1.35640.088352
320.0360320.47940.31613
330.0145360.19340.423436
340.0291160.38740.349476
350.0065720.08740.465213
36-0.02494-0.33180.370214
37-0.022541-0.29990.382306
380.0282010.37520.353982
390.0222790.29640.383636
40-0.046285-0.61580.269415
41-0.058386-0.77680.219165
42-0.061662-0.82040.206556
43-0.066394-0.88330.189131
440.0191540.25480.399578
45-0.004807-0.0640.474539
46-0.028132-0.37430.354327
470.0135060.17970.428804
48-0.042807-0.56950.284866
49-0.014538-0.19340.42343
500.0404640.53830.295511
510.0284150.3780.352929
52-0.067406-0.89680.185529
53-0.022359-0.29750.38323
54-0.071259-0.9480.172201
55-0.021521-0.28630.387487
560.0535740.71280.238468
570.0620840.8260.204965
580.0277230.36880.356346
59-0.025853-0.3440.365645
600.0311460.41440.33955


Partial Autocorrelation Function
Time lag kPACF(k)T-STATP-value
10.3524174.68863e-06
2-0.121433-1.61560.053986
3-0.188271-2.50480.006578
4-0.108116-1.43840.076044
5-0.05093-0.67760.249463
6-0.02469-0.32850.371468
70.1063991.41550.079334
8-0.187994-2.50110.006645
90.1222471.62640.052822
10-0.081965-1.09050.138495
110.0452530.60210.273955
12-0.026463-0.35210.362605
13-0.067921-0.90360.183711
14-0.040222-0.53510.296619
15-0.018261-0.24290.404163
16-0.037883-0.5040.307446
17-0.058841-0.78280.217388
180.0846921.12680.130686
19-0.06989-0.92980.176864
20-0.135496-1.80270.036572
21-0.044395-0.59060.277759
22-0.028924-0.38480.350422
230.2035392.70790.003717
24-0.043792-0.58260.280445
250.011470.15260.439445
260.1338041.78010.038384
270.021030.27980.389985
28-0.037769-0.50250.307977
290.0432870.57590.28271
30-0.136744-1.81930.03528
310.0310030.41250.340248
320.0496220.66020.254999
33-0.094574-1.25820.104984
34-0.005459-0.07260.47109
350.0002120.00280.498878
36-0.075901-1.00980.156985
370.0506580.6740.250607
380.0574390.76420.222889
39-0.046167-0.61420.269934
400.047040.62580.266116
41-0.127365-1.69450.045966
42-0.025594-0.34050.366938
430.0244570.32540.372637
440.0073570.09790.461069
45-0.0873-1.16150.123511
46-0.033056-0.43980.330317
47-0.002121-0.02820.488758
48-0.079073-1.0520.147118
490.0027740.03690.485303
50-0.043563-0.57960.281469
51-0.049357-0.65670.256127
52-0.095853-1.27520.101948
530.0400750.53320.297293
54-0.089869-1.19560.116721
550.0358480.47690.317
56-0.002554-0.0340.486467
57-0.000644-0.00860.496589
58-0.047837-0.63640.262661
590.0139190.18520.426649
600.0635740.84580.199403

\begin{tabular}{lllllllll}
\hline
Partial Autocorrelation Function \tabularnewline
Time lag k & PACF(k) & T-STAT & P-value \tabularnewline
1 & 0.352417 & 4.6886 & 3e-06 \tabularnewline
2 & -0.121433 & -1.6156 & 0.053986 \tabularnewline
3 & -0.188271 & -2.5048 & 0.006578 \tabularnewline
4 & -0.108116 & -1.4384 & 0.076044 \tabularnewline
5 & -0.05093 & -0.6776 & 0.249463 \tabularnewline
6 & -0.02469 & -0.3285 & 0.371468 \tabularnewline
7 & 0.106399 & 1.4155 & 0.079334 \tabularnewline
8 & -0.187994 & -2.5011 & 0.006645 \tabularnewline
9 & 0.122247 & 1.6264 & 0.052822 \tabularnewline
10 & -0.081965 & -1.0905 & 0.138495 \tabularnewline
11 & 0.045253 & 0.6021 & 0.273955 \tabularnewline
12 & -0.026463 & -0.3521 & 0.362605 \tabularnewline
13 & -0.067921 & -0.9036 & 0.183711 \tabularnewline
14 & -0.040222 & -0.5351 & 0.296619 \tabularnewline
15 & -0.018261 & -0.2429 & 0.404163 \tabularnewline
16 & -0.037883 & -0.504 & 0.307446 \tabularnewline
17 & -0.058841 & -0.7828 & 0.217388 \tabularnewline
18 & 0.084692 & 1.1268 & 0.130686 \tabularnewline
19 & -0.06989 & -0.9298 & 0.176864 \tabularnewline
20 & -0.135496 & -1.8027 & 0.036572 \tabularnewline
21 & -0.044395 & -0.5906 & 0.277759 \tabularnewline
22 & -0.028924 & -0.3848 & 0.350422 \tabularnewline
23 & 0.203539 & 2.7079 & 0.003717 \tabularnewline
24 & -0.043792 & -0.5826 & 0.280445 \tabularnewline
25 & 0.01147 & 0.1526 & 0.439445 \tabularnewline
26 & 0.133804 & 1.7801 & 0.038384 \tabularnewline
27 & 0.02103 & 0.2798 & 0.389985 \tabularnewline
28 & -0.037769 & -0.5025 & 0.307977 \tabularnewline
29 & 0.043287 & 0.5759 & 0.28271 \tabularnewline
30 & -0.136744 & -1.8193 & 0.03528 \tabularnewline
31 & 0.031003 & 0.4125 & 0.340248 \tabularnewline
32 & 0.049622 & 0.6602 & 0.254999 \tabularnewline
33 & -0.094574 & -1.2582 & 0.104984 \tabularnewline
34 & -0.005459 & -0.0726 & 0.47109 \tabularnewline
35 & 0.000212 & 0.0028 & 0.498878 \tabularnewline
36 & -0.075901 & -1.0098 & 0.156985 \tabularnewline
37 & 0.050658 & 0.674 & 0.250607 \tabularnewline
38 & 0.057439 & 0.7642 & 0.222889 \tabularnewline
39 & -0.046167 & -0.6142 & 0.269934 \tabularnewline
40 & 0.04704 & 0.6258 & 0.266116 \tabularnewline
41 & -0.127365 & -1.6945 & 0.045966 \tabularnewline
42 & -0.025594 & -0.3405 & 0.366938 \tabularnewline
43 & 0.024457 & 0.3254 & 0.372637 \tabularnewline
44 & 0.007357 & 0.0979 & 0.461069 \tabularnewline
45 & -0.0873 & -1.1615 & 0.123511 \tabularnewline
46 & -0.033056 & -0.4398 & 0.330317 \tabularnewline
47 & -0.002121 & -0.0282 & 0.488758 \tabularnewline
48 & -0.079073 & -1.052 & 0.147118 \tabularnewline
49 & 0.002774 & 0.0369 & 0.485303 \tabularnewline
50 & -0.043563 & -0.5796 & 0.281469 \tabularnewline
51 & -0.049357 & -0.6567 & 0.256127 \tabularnewline
52 & -0.095853 & -1.2752 & 0.101948 \tabularnewline
53 & 0.040075 & 0.5332 & 0.297293 \tabularnewline
54 & -0.089869 & -1.1956 & 0.116721 \tabularnewline
55 & 0.035848 & 0.4769 & 0.317 \tabularnewline
56 & -0.002554 & -0.034 & 0.486467 \tabularnewline
57 & -0.000644 & -0.0086 & 0.496589 \tabularnewline
58 & -0.047837 & -0.6364 & 0.262661 \tabularnewline
59 & 0.013919 & 0.1852 & 0.426649 \tabularnewline
60 & 0.063574 & 0.8458 & 0.199403 \tabularnewline
\hline
\end{tabular}
%Source: https://freestatistics.org/blog/index.php?pk=120566&T=2

[TABLE]
[ROW][C]Partial Autocorrelation Function[/C][/ROW]
[ROW][C]Time lag k[/C][C]PACF(k)[/C][C]T-STAT[/C][C]P-value[/C][/ROW]
[ROW][C]1[/C][C]0.352417[/C][C]4.6886[/C][C]3e-06[/C][/ROW]
[ROW][C]2[/C][C]-0.121433[/C][C]-1.6156[/C][C]0.053986[/C][/ROW]
[ROW][C]3[/C][C]-0.188271[/C][C]-2.5048[/C][C]0.006578[/C][/ROW]
[ROW][C]4[/C][C]-0.108116[/C][C]-1.4384[/C][C]0.076044[/C][/ROW]
[ROW][C]5[/C][C]-0.05093[/C][C]-0.6776[/C][C]0.249463[/C][/ROW]
[ROW][C]6[/C][C]-0.02469[/C][C]-0.3285[/C][C]0.371468[/C][/ROW]
[ROW][C]7[/C][C]0.106399[/C][C]1.4155[/C][C]0.079334[/C][/ROW]
[ROW][C]8[/C][C]-0.187994[/C][C]-2.5011[/C][C]0.006645[/C][/ROW]
[ROW][C]9[/C][C]0.122247[/C][C]1.6264[/C][C]0.052822[/C][/ROW]
[ROW][C]10[/C][C]-0.081965[/C][C]-1.0905[/C][C]0.138495[/C][/ROW]
[ROW][C]11[/C][C]0.045253[/C][C]0.6021[/C][C]0.273955[/C][/ROW]
[ROW][C]12[/C][C]-0.026463[/C][C]-0.3521[/C][C]0.362605[/C][/ROW]
[ROW][C]13[/C][C]-0.067921[/C][C]-0.9036[/C][C]0.183711[/C][/ROW]
[ROW][C]14[/C][C]-0.040222[/C][C]-0.5351[/C][C]0.296619[/C][/ROW]
[ROW][C]15[/C][C]-0.018261[/C][C]-0.2429[/C][C]0.404163[/C][/ROW]
[ROW][C]16[/C][C]-0.037883[/C][C]-0.504[/C][C]0.307446[/C][/ROW]
[ROW][C]17[/C][C]-0.058841[/C][C]-0.7828[/C][C]0.217388[/C][/ROW]
[ROW][C]18[/C][C]0.084692[/C][C]1.1268[/C][C]0.130686[/C][/ROW]
[ROW][C]19[/C][C]-0.06989[/C][C]-0.9298[/C][C]0.176864[/C][/ROW]
[ROW][C]20[/C][C]-0.135496[/C][C]-1.8027[/C][C]0.036572[/C][/ROW]
[ROW][C]21[/C][C]-0.044395[/C][C]-0.5906[/C][C]0.277759[/C][/ROW]
[ROW][C]22[/C][C]-0.028924[/C][C]-0.3848[/C][C]0.350422[/C][/ROW]
[ROW][C]23[/C][C]0.203539[/C][C]2.7079[/C][C]0.003717[/C][/ROW]
[ROW][C]24[/C][C]-0.043792[/C][C]-0.5826[/C][C]0.280445[/C][/ROW]
[ROW][C]25[/C][C]0.01147[/C][C]0.1526[/C][C]0.439445[/C][/ROW]
[ROW][C]26[/C][C]0.133804[/C][C]1.7801[/C][C]0.038384[/C][/ROW]
[ROW][C]27[/C][C]0.02103[/C][C]0.2798[/C][C]0.389985[/C][/ROW]
[ROW][C]28[/C][C]-0.037769[/C][C]-0.5025[/C][C]0.307977[/C][/ROW]
[ROW][C]29[/C][C]0.043287[/C][C]0.5759[/C][C]0.28271[/C][/ROW]
[ROW][C]30[/C][C]-0.136744[/C][C]-1.8193[/C][C]0.03528[/C][/ROW]
[ROW][C]31[/C][C]0.031003[/C][C]0.4125[/C][C]0.340248[/C][/ROW]
[ROW][C]32[/C][C]0.049622[/C][C]0.6602[/C][C]0.254999[/C][/ROW]
[ROW][C]33[/C][C]-0.094574[/C][C]-1.2582[/C][C]0.104984[/C][/ROW]
[ROW][C]34[/C][C]-0.005459[/C][C]-0.0726[/C][C]0.47109[/C][/ROW]
[ROW][C]35[/C][C]0.000212[/C][C]0.0028[/C][C]0.498878[/C][/ROW]
[ROW][C]36[/C][C]-0.075901[/C][C]-1.0098[/C][C]0.156985[/C][/ROW]
[ROW][C]37[/C][C]0.050658[/C][C]0.674[/C][C]0.250607[/C][/ROW]
[ROW][C]38[/C][C]0.057439[/C][C]0.7642[/C][C]0.222889[/C][/ROW]
[ROW][C]39[/C][C]-0.046167[/C][C]-0.6142[/C][C]0.269934[/C][/ROW]
[ROW][C]40[/C][C]0.04704[/C][C]0.6258[/C][C]0.266116[/C][/ROW]
[ROW][C]41[/C][C]-0.127365[/C][C]-1.6945[/C][C]0.045966[/C][/ROW]
[ROW][C]42[/C][C]-0.025594[/C][C]-0.3405[/C][C]0.366938[/C][/ROW]
[ROW][C]43[/C][C]0.024457[/C][C]0.3254[/C][C]0.372637[/C][/ROW]
[ROW][C]44[/C][C]0.007357[/C][C]0.0979[/C][C]0.461069[/C][/ROW]
[ROW][C]45[/C][C]-0.0873[/C][C]-1.1615[/C][C]0.123511[/C][/ROW]
[ROW][C]46[/C][C]-0.033056[/C][C]-0.4398[/C][C]0.330317[/C][/ROW]
[ROW][C]47[/C][C]-0.002121[/C][C]-0.0282[/C][C]0.488758[/C][/ROW]
[ROW][C]48[/C][C]-0.079073[/C][C]-1.052[/C][C]0.147118[/C][/ROW]
[ROW][C]49[/C][C]0.002774[/C][C]0.0369[/C][C]0.485303[/C][/ROW]
[ROW][C]50[/C][C]-0.043563[/C][C]-0.5796[/C][C]0.281469[/C][/ROW]
[ROW][C]51[/C][C]-0.049357[/C][C]-0.6567[/C][C]0.256127[/C][/ROW]
[ROW][C]52[/C][C]-0.095853[/C][C]-1.2752[/C][C]0.101948[/C][/ROW]
[ROW][C]53[/C][C]0.040075[/C][C]0.5332[/C][C]0.297293[/C][/ROW]
[ROW][C]54[/C][C]-0.089869[/C][C]-1.1956[/C][C]0.116721[/C][/ROW]
[ROW][C]55[/C][C]0.035848[/C][C]0.4769[/C][C]0.317[/C][/ROW]
[ROW][C]56[/C][C]-0.002554[/C][C]-0.034[/C][C]0.486467[/C][/ROW]
[ROW][C]57[/C][C]-0.000644[/C][C]-0.0086[/C][C]0.496589[/C][/ROW]
[ROW][C]58[/C][C]-0.047837[/C][C]-0.6364[/C][C]0.262661[/C][/ROW]
[ROW][C]59[/C][C]0.013919[/C][C]0.1852[/C][C]0.426649[/C][/ROW]
[ROW][C]60[/C][C]0.063574[/C][C]0.8458[/C][C]0.199403[/C][/ROW]
[/TABLE]
Source: https://freestatistics.org/blog/index.php?pk=120566&T=2

Globally Unique Identifier (entire table): ba.freestatistics.org/blog/index.php?pk=120566&T=2

As an alternative you can also use a QR Code:  

The GUIDs for individual cells are displayed in the table below:

Partial Autocorrelation Function
Time lag kPACF(k)T-STATP-value
10.3524174.68863e-06
2-0.121433-1.61560.053986
3-0.188271-2.50480.006578
4-0.108116-1.43840.076044
5-0.05093-0.67760.249463
6-0.02469-0.32850.371468
70.1063991.41550.079334
8-0.187994-2.50110.006645
90.1222471.62640.052822
10-0.081965-1.09050.138495
110.0452530.60210.273955
12-0.026463-0.35210.362605
13-0.067921-0.90360.183711
14-0.040222-0.53510.296619
15-0.018261-0.24290.404163
16-0.037883-0.5040.307446
17-0.058841-0.78280.217388
180.0846921.12680.130686
19-0.06989-0.92980.176864
20-0.135496-1.80270.036572
21-0.044395-0.59060.277759
22-0.028924-0.38480.350422
230.2035392.70790.003717
24-0.043792-0.58260.280445
250.011470.15260.439445
260.1338041.78010.038384
270.021030.27980.389985
28-0.037769-0.50250.307977
290.0432870.57590.28271
30-0.136744-1.81930.03528
310.0310030.41250.340248
320.0496220.66020.254999
33-0.094574-1.25820.104984
34-0.005459-0.07260.47109
350.0002120.00280.498878
36-0.075901-1.00980.156985
370.0506580.6740.250607
380.0574390.76420.222889
39-0.046167-0.61420.269934
400.047040.62580.266116
41-0.127365-1.69450.045966
42-0.025594-0.34050.366938
430.0244570.32540.372637
440.0073570.09790.461069
45-0.0873-1.16150.123511
46-0.033056-0.43980.330317
47-0.002121-0.02820.488758
48-0.079073-1.0520.147118
490.0027740.03690.485303
50-0.043563-0.57960.281469
51-0.049357-0.65670.256127
52-0.095853-1.27520.101948
530.0400750.53320.297293
54-0.089869-1.19560.116721
550.0358480.47690.317
56-0.002554-0.0340.486467
57-0.000644-0.00860.496589
58-0.047837-0.63640.262661
590.0139190.18520.426649
600.0635740.84580.199403


Parameters (Session):
par1 = 60 ; par2 = 1 ; par3 = 1 ; par4 = 0 ; par5 = 1 ; par6 = White Noise ; par7 = 0.95 ;
Parameters (R input):
par1 = 60 ; par2 = 1 ; par3 = 1 ; par4 = 0 ; par5 = 1 ; par6 = White Noise ; par7 = 0.95 ; par8 = ;
R code (references can be found in the software module):
if (par1 == 'Default') {
par1 = 10*log10(length(x))
} else {
par1 <- as.numeric(par1)
}
par2 <- as.numeric(par2)
par3 <- as.numeric(par3)
par4 <- as.numeric(par4)
par5 <- as.numeric(par5)
if (par6 == 'White Noise') par6 <- 'white' else par6 <- 'ma'
par7 <- as.numeric(par7)
if (par8 != '') par8 <- as.numeric(par8)
ox <- x
if (par8 == '') {
if (par2 == 0) {
x <- log(x)
} else {
x <- (x ^ par2 - 1) / par2
}
} else {
x <- log(x,base=par8)
}
if (par3 > 0) x <- diff(x,lag=1,difference=par3)
if (par4 > 0) x <- diff(x,lag=par5,difference=par4)
bitmap(file='picts.png')
op <- par(mfrow=c(2,1))
plot(ox,type='l',main='Original Time Series',xlab='time',ylab='value')
if (par8=='') {
mytitle <- paste('Working Time Series (lambda=',par2,', d=',par3,', D=',par4,')',sep='')
mysub <- paste('(lambda=',par2,', d=',par3,', D=',par4,', CI=', par7, ', CI type=',par6,')',sep='')
} else {
mytitle <- paste('Working Time Series (base=',par8,', d=',par3,', D=',par4,')',sep='')
mysub <- paste('(base=',par8,', d=',par3,', D=',par4,', CI=', par7, ', CI type=',par6,')',sep='')
}
plot(x,type='l', main=mytitle,xlab='time',ylab='value')
par(op)
dev.off()
bitmap(file='pic1.png')
racf <- acf(x, par1, main='Autocorrelation', xlab='time lag', ylab='ACF', ci.type=par6, ci=par7, sub=mysub)
dev.off()
bitmap(file='pic2.png')
rpacf <- pacf(x,par1,main='Partial Autocorrelation',xlab='lags',ylab='PACF',sub=mysub)
dev.off()
(myacf <- c(racf$acf))
(mypacf <- c(rpacf$acf))
lengthx <- length(x)
sqrtn <- sqrt(lengthx)
load(file='createtable')
a<-table.start()
a<-table.row.start(a)
a<-table.element(a,'Autocorrelation Function',4,TRUE)
a<-table.row.end(a)
a<-table.row.start(a)
a<-table.element(a,'Time lag k',header=TRUE)
a<-table.element(a,hyperlink('basics.htm','ACF(k)','click here for more information about the Autocorrelation Function'),header=TRUE)
a<-table.element(a,'T-STAT',header=TRUE)
a<-table.element(a,'P-value',header=TRUE)
a<-table.row.end(a)
for (i in 2:(par1+1)) {
a<-table.row.start(a)
a<-table.element(a,i-1,header=TRUE)
a<-table.element(a,round(myacf[i],6))
mytstat <- myacf[i]*sqrtn
a<-table.element(a,round(mytstat,4))
a<-table.element(a,round(1-pt(abs(mytstat),lengthx),6))
a<-table.row.end(a)
}
a<-table.end(a)
table.save(a,file='mytable.tab')
a<-table.start()
a<-table.row.start(a)
a<-table.element(a,'Partial Autocorrelation Function',4,TRUE)
a<-table.row.end(a)
a<-table.row.start(a)
a<-table.element(a,'Time lag k',header=TRUE)
a<-table.element(a,hyperlink('basics.htm','PACF(k)','click here for more information about the Partial Autocorrelation Function'),header=TRUE)
a<-table.element(a,'T-STAT',header=TRUE)
a<-table.element(a,'P-value',header=TRUE)
a<-table.row.end(a)
for (i in 1:par1) {
a<-table.row.start(a)
a<-table.element(a,i,header=TRUE)
a<-table.element(a,round(mypacf[i],6))
mytstat <- mypacf[i]*sqrtn
a<-table.element(a,round(mytstat,4))
a<-table.element(a,round(1-pt(abs(mytstat),lengthx),6))
a<-table.row.end(a)
}
a<-table.end(a)
table.save(a,file='mytable1.tab')