Free Statistics

of Irreproducible Research!

Author's title

Author*Unverified author*
R Software Modulerwasp_autocorrelation.wasp
Title produced by software(Partial) Autocorrelation Function
Date of computationTue, 12 Apr 2011 18:33:35 +0000
Cite this page as followsStatistical Computations at FreeStatistics.org, Office for Research Development and Education, URL https://freestatistics.org/blog/index.php?v=date/2011/Apr/12/t1302633096xqu14r6sagj8f0k.htm/, Retrieved Thu, 09 May 2024 10:57:09 +0000
Statistical Computations at FreeStatistics.org, Office for Research Development and Education, URL https://freestatistics.org/blog/index.php?pk=120556, Retrieved Thu, 09 May 2024 10:57:09 +0000
QR Codes:

Original text written by user:
IsPrivate?No (this computation is public)
User-defined keywordsKDGP2W12
Estimated Impact112
Family? (F = Feedback message, R = changed R code, M = changed R Module, P = changed Parameters, D = changed Data)
-       [(Partial) Autocorrelation Function] [Opgave 6bis oef2 ...] [2011-04-12 18:33:35] [439e035dc5bc96f212031d0688fc7c62] [Current]
Feedback Forum

Post a new message
Dataseries X:
112
118
129
99
116
168
118
129
205
147
150
267
126
129
124
97
102
127
222
214
118
141
154
226
89
77
82
97
127
121
117
117
106
112
134
169
75
108
115
85
101
108
109
124
105
95
135
164
88
85
112
87
91
87
87
142
95
108
139
159
61
82
124
93
108
75
87
103
90
108
123
129
57
65
67
71
76
67
110
118
99
85
107
141
58
65
70
86
93
74
87
73
101
100
96
157
63
115
70
66
67
83
79
77
102
116
100
135
71
60
89
74
73
91
86
74
87
87
109
137
43
69
73
77
69
76
78
70
83
65
110
132
54
55
66
65
60
65
96
55
71
63
74
106
34
47
56
53
53
55
67
52
46
51
58
91
33
40
46
45
41
55
57
54
46
52
48
77
77
35
42
48
44
45
0
0
46
51
63
84
30
39
45
52
28
40
62


Summary of computational transaction
Raw Inputview raw input (R code)
Raw Outputview raw output of R engine
Computing time2 seconds
R Server'George Udny Yule' @ 216.218.223.82

\begin{tabular}{lllllllll}
\hline
Summary of computational transaction \tabularnewline
Raw Input & view raw input (R code)  \tabularnewline
Raw Output & view raw output of R engine  \tabularnewline
Computing time & 2 seconds \tabularnewline
R Server & 'George Udny Yule' @ 216.218.223.82 \tabularnewline
\hline
\end{tabular}
%Source: https://freestatistics.org/blog/index.php?pk=120556&T=0

[TABLE]
[ROW][C]Summary of computational transaction[/C][/ROW]
[ROW][C]Raw Input[/C][C]view raw input (R code) [/C][/ROW]
[ROW][C]Raw Output[/C][C]view raw output of R engine [/C][/ROW]
[ROW][C]Computing time[/C][C]2 seconds[/C][/ROW]
[ROW][C]R Server[/C][C]'George Udny Yule' @ 216.218.223.82[/C][/ROW]
[/TABLE]
Source: https://freestatistics.org/blog/index.php?pk=120556&T=0

Globally Unique Identifier (entire table): ba.freestatistics.org/blog/index.php?pk=120556&T=0

As an alternative you can also use a QR Code:  

The GUIDs for individual cells are displayed in the table below:

Summary of computational transaction
Raw Inputview raw input (R code)
Raw Outputview raw output of R engine
Computing time2 seconds
R Server'George Udny Yule' @ 216.218.223.82


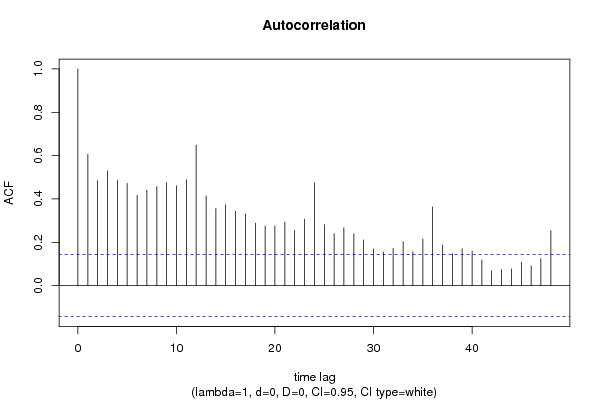
Autocorrelation Function
Time lag kACF(k)T-STATP-value
10.6057628.28370
20.4846066.62690
30.530557.25520
40.4860076.6460
50.4711476.44280
60.4170765.70340
70.4401286.01870
80.4570426.250
90.475376.50060
100.4606536.29930
110.4887116.6830
120.6481348.86310
130.4138695.65960
140.3553314.85911e-06
150.3735345.1080
160.3426194.68523e-06
170.3301774.51516e-06
180.2876443.93355.9e-05
190.2737863.7440.000121
200.2751733.76290.000112
210.2929614.00624.4e-05
220.2542253.47650.000316
230.3060294.18492.2e-05
240.4753136.49980
250.2810113.84288.3e-05
260.2405733.28980.000599
270.2667293.64750.000172
280.2388843.26670.000647
290.2103812.87690.002241
300.1691572.31320.0109
310.1546992.11550.017857
320.1712422.34170.010124
330.2020832.76340.003146
340.1561942.13590.016993
350.2145782.93430.001881
360.3626544.95921e-06
370.1868132.55460.005713
380.1478642.0220.022301
390.1700912.3260.010546
400.1589192.17320.015512
410.1181591.61580.053911
420.0686110.93820.174667
430.0736441.00710.157601
440.0763881.04460.148781
450.1079781.47660.070736
460.0906651.23980.108296
470.1239711.69530.045844
480.2539573.47280.00032

\begin{tabular}{lllllllll}
\hline
Autocorrelation Function \tabularnewline
Time lag k & ACF(k) & T-STAT & P-value \tabularnewline
1 & 0.605762 & 8.2837 & 0 \tabularnewline
2 & 0.484606 & 6.6269 & 0 \tabularnewline
3 & 0.53055 & 7.2552 & 0 \tabularnewline
4 & 0.486007 & 6.646 & 0 \tabularnewline
5 & 0.471147 & 6.4428 & 0 \tabularnewline
6 & 0.417076 & 5.7034 & 0 \tabularnewline
7 & 0.440128 & 6.0187 & 0 \tabularnewline
8 & 0.457042 & 6.25 & 0 \tabularnewline
9 & 0.47537 & 6.5006 & 0 \tabularnewline
10 & 0.460653 & 6.2993 & 0 \tabularnewline
11 & 0.488711 & 6.683 & 0 \tabularnewline
12 & 0.648134 & 8.8631 & 0 \tabularnewline
13 & 0.413869 & 5.6596 & 0 \tabularnewline
14 & 0.355331 & 4.8591 & 1e-06 \tabularnewline
15 & 0.373534 & 5.108 & 0 \tabularnewline
16 & 0.342619 & 4.6852 & 3e-06 \tabularnewline
17 & 0.330177 & 4.5151 & 6e-06 \tabularnewline
18 & 0.287644 & 3.9335 & 5.9e-05 \tabularnewline
19 & 0.273786 & 3.744 & 0.000121 \tabularnewline
20 & 0.275173 & 3.7629 & 0.000112 \tabularnewline
21 & 0.292961 & 4.0062 & 4.4e-05 \tabularnewline
22 & 0.254225 & 3.4765 & 0.000316 \tabularnewline
23 & 0.306029 & 4.1849 & 2.2e-05 \tabularnewline
24 & 0.475313 & 6.4998 & 0 \tabularnewline
25 & 0.281011 & 3.8428 & 8.3e-05 \tabularnewline
26 & 0.240573 & 3.2898 & 0.000599 \tabularnewline
27 & 0.266729 & 3.6475 & 0.000172 \tabularnewline
28 & 0.238884 & 3.2667 & 0.000647 \tabularnewline
29 & 0.210381 & 2.8769 & 0.002241 \tabularnewline
30 & 0.169157 & 2.3132 & 0.0109 \tabularnewline
31 & 0.154699 & 2.1155 & 0.017857 \tabularnewline
32 & 0.171242 & 2.3417 & 0.010124 \tabularnewline
33 & 0.202083 & 2.7634 & 0.003146 \tabularnewline
34 & 0.156194 & 2.1359 & 0.016993 \tabularnewline
35 & 0.214578 & 2.9343 & 0.001881 \tabularnewline
36 & 0.362654 & 4.9592 & 1e-06 \tabularnewline
37 & 0.186813 & 2.5546 & 0.005713 \tabularnewline
38 & 0.147864 & 2.022 & 0.022301 \tabularnewline
39 & 0.170091 & 2.326 & 0.010546 \tabularnewline
40 & 0.158919 & 2.1732 & 0.015512 \tabularnewline
41 & 0.118159 & 1.6158 & 0.053911 \tabularnewline
42 & 0.068611 & 0.9382 & 0.174667 \tabularnewline
43 & 0.073644 & 1.0071 & 0.157601 \tabularnewline
44 & 0.076388 & 1.0446 & 0.148781 \tabularnewline
45 & 0.107978 & 1.4766 & 0.070736 \tabularnewline
46 & 0.090665 & 1.2398 & 0.108296 \tabularnewline
47 & 0.123971 & 1.6953 & 0.045844 \tabularnewline
48 & 0.253957 & 3.4728 & 0.00032 \tabularnewline
\hline
\end{tabular}
%Source: https://freestatistics.org/blog/index.php?pk=120556&T=1

[TABLE]
[ROW][C]Autocorrelation Function[/C][/ROW]
[ROW][C]Time lag k[/C][C]ACF(k)[/C][C]T-STAT[/C][C]P-value[/C][/ROW]
[ROW][C]1[/C][C]0.605762[/C][C]8.2837[/C][C]0[/C][/ROW]
[ROW][C]2[/C][C]0.484606[/C][C]6.6269[/C][C]0[/C][/ROW]
[ROW][C]3[/C][C]0.53055[/C][C]7.2552[/C][C]0[/C][/ROW]
[ROW][C]4[/C][C]0.486007[/C][C]6.646[/C][C]0[/C][/ROW]
[ROW][C]5[/C][C]0.471147[/C][C]6.4428[/C][C]0[/C][/ROW]
[ROW][C]6[/C][C]0.417076[/C][C]5.7034[/C][C]0[/C][/ROW]
[ROW][C]7[/C][C]0.440128[/C][C]6.0187[/C][C]0[/C][/ROW]
[ROW][C]8[/C][C]0.457042[/C][C]6.25[/C][C]0[/C][/ROW]
[ROW][C]9[/C][C]0.47537[/C][C]6.5006[/C][C]0[/C][/ROW]
[ROW][C]10[/C][C]0.460653[/C][C]6.2993[/C][C]0[/C][/ROW]
[ROW][C]11[/C][C]0.488711[/C][C]6.683[/C][C]0[/C][/ROW]
[ROW][C]12[/C][C]0.648134[/C][C]8.8631[/C][C]0[/C][/ROW]
[ROW][C]13[/C][C]0.413869[/C][C]5.6596[/C][C]0[/C][/ROW]
[ROW][C]14[/C][C]0.355331[/C][C]4.8591[/C][C]1e-06[/C][/ROW]
[ROW][C]15[/C][C]0.373534[/C][C]5.108[/C][C]0[/C][/ROW]
[ROW][C]16[/C][C]0.342619[/C][C]4.6852[/C][C]3e-06[/C][/ROW]
[ROW][C]17[/C][C]0.330177[/C][C]4.5151[/C][C]6e-06[/C][/ROW]
[ROW][C]18[/C][C]0.287644[/C][C]3.9335[/C][C]5.9e-05[/C][/ROW]
[ROW][C]19[/C][C]0.273786[/C][C]3.744[/C][C]0.000121[/C][/ROW]
[ROW][C]20[/C][C]0.275173[/C][C]3.7629[/C][C]0.000112[/C][/ROW]
[ROW][C]21[/C][C]0.292961[/C][C]4.0062[/C][C]4.4e-05[/C][/ROW]
[ROW][C]22[/C][C]0.254225[/C][C]3.4765[/C][C]0.000316[/C][/ROW]
[ROW][C]23[/C][C]0.306029[/C][C]4.1849[/C][C]2.2e-05[/C][/ROW]
[ROW][C]24[/C][C]0.475313[/C][C]6.4998[/C][C]0[/C][/ROW]
[ROW][C]25[/C][C]0.281011[/C][C]3.8428[/C][C]8.3e-05[/C][/ROW]
[ROW][C]26[/C][C]0.240573[/C][C]3.2898[/C][C]0.000599[/C][/ROW]
[ROW][C]27[/C][C]0.266729[/C][C]3.6475[/C][C]0.000172[/C][/ROW]
[ROW][C]28[/C][C]0.238884[/C][C]3.2667[/C][C]0.000647[/C][/ROW]
[ROW][C]29[/C][C]0.210381[/C][C]2.8769[/C][C]0.002241[/C][/ROW]
[ROW][C]30[/C][C]0.169157[/C][C]2.3132[/C][C]0.0109[/C][/ROW]
[ROW][C]31[/C][C]0.154699[/C][C]2.1155[/C][C]0.017857[/C][/ROW]
[ROW][C]32[/C][C]0.171242[/C][C]2.3417[/C][C]0.010124[/C][/ROW]
[ROW][C]33[/C][C]0.202083[/C][C]2.7634[/C][C]0.003146[/C][/ROW]
[ROW][C]34[/C][C]0.156194[/C][C]2.1359[/C][C]0.016993[/C][/ROW]
[ROW][C]35[/C][C]0.214578[/C][C]2.9343[/C][C]0.001881[/C][/ROW]
[ROW][C]36[/C][C]0.362654[/C][C]4.9592[/C][C]1e-06[/C][/ROW]
[ROW][C]37[/C][C]0.186813[/C][C]2.5546[/C][C]0.005713[/C][/ROW]
[ROW][C]38[/C][C]0.147864[/C][C]2.022[/C][C]0.022301[/C][/ROW]
[ROW][C]39[/C][C]0.170091[/C][C]2.326[/C][C]0.010546[/C][/ROW]
[ROW][C]40[/C][C]0.158919[/C][C]2.1732[/C][C]0.015512[/C][/ROW]
[ROW][C]41[/C][C]0.118159[/C][C]1.6158[/C][C]0.053911[/C][/ROW]
[ROW][C]42[/C][C]0.068611[/C][C]0.9382[/C][C]0.174667[/C][/ROW]
[ROW][C]43[/C][C]0.073644[/C][C]1.0071[/C][C]0.157601[/C][/ROW]
[ROW][C]44[/C][C]0.076388[/C][C]1.0446[/C][C]0.148781[/C][/ROW]
[ROW][C]45[/C][C]0.107978[/C][C]1.4766[/C][C]0.070736[/C][/ROW]
[ROW][C]46[/C][C]0.090665[/C][C]1.2398[/C][C]0.108296[/C][/ROW]
[ROW][C]47[/C][C]0.123971[/C][C]1.6953[/C][C]0.045844[/C][/ROW]
[ROW][C]48[/C][C]0.253957[/C][C]3.4728[/C][C]0.00032[/C][/ROW]
[/TABLE]
Source: https://freestatistics.org/blog/index.php?pk=120556&T=1

Globally Unique Identifier (entire table): ba.freestatistics.org/blog/index.php?pk=120556&T=1

As an alternative you can also use a QR Code:  

The GUIDs for individual cells are displayed in the table below:

Autocorrelation Function
Time lag kACF(k)T-STATP-value
10.6057628.28370
20.4846066.62690
30.530557.25520
40.4860076.6460
50.4711476.44280
60.4170765.70340
70.4401286.01870
80.4570426.250
90.475376.50060
100.4606536.29930
110.4887116.6830
120.6481348.86310
130.4138695.65960
140.3553314.85911e-06
150.3735345.1080
160.3426194.68523e-06
170.3301774.51516e-06
180.2876443.93355.9e-05
190.2737863.7440.000121
200.2751733.76290.000112
210.2929614.00624.4e-05
220.2542253.47650.000316
230.3060294.18492.2e-05
240.4753136.49980
250.2810113.84288.3e-05
260.2405733.28980.000599
270.2667293.64750.000172
280.2388843.26670.000647
290.2103812.87690.002241
300.1691572.31320.0109
310.1546992.11550.017857
320.1712422.34170.010124
330.2020832.76340.003146
340.1561942.13590.016993
350.2145782.93430.001881
360.3626544.95921e-06
370.1868132.55460.005713
380.1478642.0220.022301
390.1700912.3260.010546
400.1589192.17320.015512
410.1181591.61580.053911
420.0686110.93820.174667
430.0736441.00710.157601
440.0763881.04460.148781
450.1079781.47660.070736
460.0906651.23980.108296
470.1239711.69530.045844
480.2539573.47280.00032


Partial Autocorrelation Function
Time lag kPACF(k)T-STATP-value
10.6057628.28370
20.1858592.54160.005923
30.2928224.00434.5e-05
40.0997911.36460.087007
50.128671.75950.04006
6-0.005018-0.06860.472681
70.1235921.69010.046338
80.0889771.21670.112618
90.1458581.99460.023771
100.0545260.74560.228413
110.1398341.91220.02869
120.3688425.04381e-06
13-0.295593-4.04223.9e-05
14-0.041588-0.56870.285118
15-0.14494-1.9820.024471
16-0.014447-0.19760.421799
17-0.06662-0.9110.181729
18-0.009358-0.1280.449154
19-0.107334-1.46780.071923
20-0.05761-0.78780.215905
21-0.025955-0.35490.361523
22-0.094333-1.290.099324
230.1301721.78010.038344
240.2705573.69980.000142
25-0.021279-0.2910.385694
260.0382420.5230.300813
27-0.00917-0.12540.450173
28-0.00678-0.09270.463115
29-0.053912-0.73720.230951
300.0092450.12640.449766
31-0.038982-0.53310.29731
320.0089740.12270.451232
33-0.001512-0.02070.491764
34-0.102836-1.40630.080654
350.0202230.27650.391216
360.0900641.23160.109822
37-0.040873-0.55890.288441
38-0.019803-0.27080.393424
39-0.00829-0.11340.454932
400.0146010.19970.420982
41-0.068939-0.94270.173517
42-0.041733-0.57070.284447
430.0113580.15530.438367
44-0.035341-0.48330.314729
450.0288290.39420.34693
460.0496350.67870.24907
47-0.00919-0.12570.450063
480.0728460.99610.160232

\begin{tabular}{lllllllll}
\hline
Partial Autocorrelation Function \tabularnewline
Time lag k & PACF(k) & T-STAT & P-value \tabularnewline
1 & 0.605762 & 8.2837 & 0 \tabularnewline
2 & 0.185859 & 2.5416 & 0.005923 \tabularnewline
3 & 0.292822 & 4.0043 & 4.5e-05 \tabularnewline
4 & 0.099791 & 1.3646 & 0.087007 \tabularnewline
5 & 0.12867 & 1.7595 & 0.04006 \tabularnewline
6 & -0.005018 & -0.0686 & 0.472681 \tabularnewline
7 & 0.123592 & 1.6901 & 0.046338 \tabularnewline
8 & 0.088977 & 1.2167 & 0.112618 \tabularnewline
9 & 0.145858 & 1.9946 & 0.023771 \tabularnewline
10 & 0.054526 & 0.7456 & 0.228413 \tabularnewline
11 & 0.139834 & 1.9122 & 0.02869 \tabularnewline
12 & 0.368842 & 5.0438 & 1e-06 \tabularnewline
13 & -0.295593 & -4.0422 & 3.9e-05 \tabularnewline
14 & -0.041588 & -0.5687 & 0.285118 \tabularnewline
15 & -0.14494 & -1.982 & 0.024471 \tabularnewline
16 & -0.014447 & -0.1976 & 0.421799 \tabularnewline
17 & -0.06662 & -0.911 & 0.181729 \tabularnewline
18 & -0.009358 & -0.128 & 0.449154 \tabularnewline
19 & -0.107334 & -1.4678 & 0.071923 \tabularnewline
20 & -0.05761 & -0.7878 & 0.215905 \tabularnewline
21 & -0.025955 & -0.3549 & 0.361523 \tabularnewline
22 & -0.094333 & -1.29 & 0.099324 \tabularnewline
23 & 0.130172 & 1.7801 & 0.038344 \tabularnewline
24 & 0.270557 & 3.6998 & 0.000142 \tabularnewline
25 & -0.021279 & -0.291 & 0.385694 \tabularnewline
26 & 0.038242 & 0.523 & 0.300813 \tabularnewline
27 & -0.00917 & -0.1254 & 0.450173 \tabularnewline
28 & -0.00678 & -0.0927 & 0.463115 \tabularnewline
29 & -0.053912 & -0.7372 & 0.230951 \tabularnewline
30 & 0.009245 & 0.1264 & 0.449766 \tabularnewline
31 & -0.038982 & -0.5331 & 0.29731 \tabularnewline
32 & 0.008974 & 0.1227 & 0.451232 \tabularnewline
33 & -0.001512 & -0.0207 & 0.491764 \tabularnewline
34 & -0.102836 & -1.4063 & 0.080654 \tabularnewline
35 & 0.020223 & 0.2765 & 0.391216 \tabularnewline
36 & 0.090064 & 1.2316 & 0.109822 \tabularnewline
37 & -0.040873 & -0.5589 & 0.288441 \tabularnewline
38 & -0.019803 & -0.2708 & 0.393424 \tabularnewline
39 & -0.00829 & -0.1134 & 0.454932 \tabularnewline
40 & 0.014601 & 0.1997 & 0.420982 \tabularnewline
41 & -0.068939 & -0.9427 & 0.173517 \tabularnewline
42 & -0.041733 & -0.5707 & 0.284447 \tabularnewline
43 & 0.011358 & 0.1553 & 0.438367 \tabularnewline
44 & -0.035341 & -0.4833 & 0.314729 \tabularnewline
45 & 0.028829 & 0.3942 & 0.34693 \tabularnewline
46 & 0.049635 & 0.6787 & 0.24907 \tabularnewline
47 & -0.00919 & -0.1257 & 0.450063 \tabularnewline
48 & 0.072846 & 0.9961 & 0.160232 \tabularnewline
\hline
\end{tabular}
%Source: https://freestatistics.org/blog/index.php?pk=120556&T=2

[TABLE]
[ROW][C]Partial Autocorrelation Function[/C][/ROW]
[ROW][C]Time lag k[/C][C]PACF(k)[/C][C]T-STAT[/C][C]P-value[/C][/ROW]
[ROW][C]1[/C][C]0.605762[/C][C]8.2837[/C][C]0[/C][/ROW]
[ROW][C]2[/C][C]0.185859[/C][C]2.5416[/C][C]0.005923[/C][/ROW]
[ROW][C]3[/C][C]0.292822[/C][C]4.0043[/C][C]4.5e-05[/C][/ROW]
[ROW][C]4[/C][C]0.099791[/C][C]1.3646[/C][C]0.087007[/C][/ROW]
[ROW][C]5[/C][C]0.12867[/C][C]1.7595[/C][C]0.04006[/C][/ROW]
[ROW][C]6[/C][C]-0.005018[/C][C]-0.0686[/C][C]0.472681[/C][/ROW]
[ROW][C]7[/C][C]0.123592[/C][C]1.6901[/C][C]0.046338[/C][/ROW]
[ROW][C]8[/C][C]0.088977[/C][C]1.2167[/C][C]0.112618[/C][/ROW]
[ROW][C]9[/C][C]0.145858[/C][C]1.9946[/C][C]0.023771[/C][/ROW]
[ROW][C]10[/C][C]0.054526[/C][C]0.7456[/C][C]0.228413[/C][/ROW]
[ROW][C]11[/C][C]0.139834[/C][C]1.9122[/C][C]0.02869[/C][/ROW]
[ROW][C]12[/C][C]0.368842[/C][C]5.0438[/C][C]1e-06[/C][/ROW]
[ROW][C]13[/C][C]-0.295593[/C][C]-4.0422[/C][C]3.9e-05[/C][/ROW]
[ROW][C]14[/C][C]-0.041588[/C][C]-0.5687[/C][C]0.285118[/C][/ROW]
[ROW][C]15[/C][C]-0.14494[/C][C]-1.982[/C][C]0.024471[/C][/ROW]
[ROW][C]16[/C][C]-0.014447[/C][C]-0.1976[/C][C]0.421799[/C][/ROW]
[ROW][C]17[/C][C]-0.06662[/C][C]-0.911[/C][C]0.181729[/C][/ROW]
[ROW][C]18[/C][C]-0.009358[/C][C]-0.128[/C][C]0.449154[/C][/ROW]
[ROW][C]19[/C][C]-0.107334[/C][C]-1.4678[/C][C]0.071923[/C][/ROW]
[ROW][C]20[/C][C]-0.05761[/C][C]-0.7878[/C][C]0.215905[/C][/ROW]
[ROW][C]21[/C][C]-0.025955[/C][C]-0.3549[/C][C]0.361523[/C][/ROW]
[ROW][C]22[/C][C]-0.094333[/C][C]-1.29[/C][C]0.099324[/C][/ROW]
[ROW][C]23[/C][C]0.130172[/C][C]1.7801[/C][C]0.038344[/C][/ROW]
[ROW][C]24[/C][C]0.270557[/C][C]3.6998[/C][C]0.000142[/C][/ROW]
[ROW][C]25[/C][C]-0.021279[/C][C]-0.291[/C][C]0.385694[/C][/ROW]
[ROW][C]26[/C][C]0.038242[/C][C]0.523[/C][C]0.300813[/C][/ROW]
[ROW][C]27[/C][C]-0.00917[/C][C]-0.1254[/C][C]0.450173[/C][/ROW]
[ROW][C]28[/C][C]-0.00678[/C][C]-0.0927[/C][C]0.463115[/C][/ROW]
[ROW][C]29[/C][C]-0.053912[/C][C]-0.7372[/C][C]0.230951[/C][/ROW]
[ROW][C]30[/C][C]0.009245[/C][C]0.1264[/C][C]0.449766[/C][/ROW]
[ROW][C]31[/C][C]-0.038982[/C][C]-0.5331[/C][C]0.29731[/C][/ROW]
[ROW][C]32[/C][C]0.008974[/C][C]0.1227[/C][C]0.451232[/C][/ROW]
[ROW][C]33[/C][C]-0.001512[/C][C]-0.0207[/C][C]0.491764[/C][/ROW]
[ROW][C]34[/C][C]-0.102836[/C][C]-1.4063[/C][C]0.080654[/C][/ROW]
[ROW][C]35[/C][C]0.020223[/C][C]0.2765[/C][C]0.391216[/C][/ROW]
[ROW][C]36[/C][C]0.090064[/C][C]1.2316[/C][C]0.109822[/C][/ROW]
[ROW][C]37[/C][C]-0.040873[/C][C]-0.5589[/C][C]0.288441[/C][/ROW]
[ROW][C]38[/C][C]-0.019803[/C][C]-0.2708[/C][C]0.393424[/C][/ROW]
[ROW][C]39[/C][C]-0.00829[/C][C]-0.1134[/C][C]0.454932[/C][/ROW]
[ROW][C]40[/C][C]0.014601[/C][C]0.1997[/C][C]0.420982[/C][/ROW]
[ROW][C]41[/C][C]-0.068939[/C][C]-0.9427[/C][C]0.173517[/C][/ROW]
[ROW][C]42[/C][C]-0.041733[/C][C]-0.5707[/C][C]0.284447[/C][/ROW]
[ROW][C]43[/C][C]0.011358[/C][C]0.1553[/C][C]0.438367[/C][/ROW]
[ROW][C]44[/C][C]-0.035341[/C][C]-0.4833[/C][C]0.314729[/C][/ROW]
[ROW][C]45[/C][C]0.028829[/C][C]0.3942[/C][C]0.34693[/C][/ROW]
[ROW][C]46[/C][C]0.049635[/C][C]0.6787[/C][C]0.24907[/C][/ROW]
[ROW][C]47[/C][C]-0.00919[/C][C]-0.1257[/C][C]0.450063[/C][/ROW]
[ROW][C]48[/C][C]0.072846[/C][C]0.9961[/C][C]0.160232[/C][/ROW]
[/TABLE]
Source: https://freestatistics.org/blog/index.php?pk=120556&T=2

Globally Unique Identifier (entire table): ba.freestatistics.org/blog/index.php?pk=120556&T=2

As an alternative you can also use a QR Code:  

The GUIDs for individual cells are displayed in the table below:

Partial Autocorrelation Function
Time lag kPACF(k)T-STATP-value
10.6057628.28370
20.1858592.54160.005923
30.2928224.00434.5e-05
40.0997911.36460.087007
50.128671.75950.04006
6-0.005018-0.06860.472681
70.1235921.69010.046338
80.0889771.21670.112618
90.1458581.99460.023771
100.0545260.74560.228413
110.1398341.91220.02869
120.3688425.04381e-06
13-0.295593-4.04223.9e-05
14-0.041588-0.56870.285118
15-0.14494-1.9820.024471
16-0.014447-0.19760.421799
17-0.06662-0.9110.181729
18-0.009358-0.1280.449154
19-0.107334-1.46780.071923
20-0.05761-0.78780.215905
21-0.025955-0.35490.361523
22-0.094333-1.290.099324
230.1301721.78010.038344
240.2705573.69980.000142
25-0.021279-0.2910.385694
260.0382420.5230.300813
27-0.00917-0.12540.450173
28-0.00678-0.09270.463115
29-0.053912-0.73720.230951
300.0092450.12640.449766
31-0.038982-0.53310.29731
320.0089740.12270.451232
33-0.001512-0.02070.491764
34-0.102836-1.40630.080654
350.0202230.27650.391216
360.0900641.23160.109822
37-0.040873-0.55890.288441
38-0.019803-0.27080.393424
39-0.00829-0.11340.454932
400.0146010.19970.420982
41-0.068939-0.94270.173517
42-0.041733-0.57070.284447
430.0113580.15530.438367
44-0.035341-0.48330.314729
450.0288290.39420.34693
460.0496350.67870.24907
47-0.00919-0.12570.450063
480.0728460.99610.160232


Parameters (Session):
par1 = 48 ; par2 = 1 ; par3 = 0 ; par4 = 0 ; par5 = 12 ; par6 = White Noise ; par7 = 0.95 ;
Parameters (R input):
par1 = 48 ; par2 = 1 ; par3 = 0 ; par4 = 0 ; par5 = 12 ; par6 = White Noise ; par7 = 0.95 ; par8 = ;
R code (references can be found in the software module):
if (par1 == 'Default') {
par1 = 10*log10(length(x))
} else {
par1 <- as.numeric(par1)
}
par2 <- as.numeric(par2)
par3 <- as.numeric(par3)
par4 <- as.numeric(par4)
par5 <- as.numeric(par5)
if (par6 == 'White Noise') par6 <- 'white' else par6 <- 'ma'
par7 <- as.numeric(par7)
if (par8 != '') par8 <- as.numeric(par8)
ox <- x
if (par8 == '') {
if (par2 == 0) {
x <- log(x)
} else {
x <- (x ^ par2 - 1) / par2
}
} else {
x <- log(x,base=par8)
}
if (par3 > 0) x <- diff(x,lag=1,difference=par3)
if (par4 > 0) x <- diff(x,lag=par5,difference=par4)
bitmap(file='picts.png')
op <- par(mfrow=c(2,1))
plot(ox,type='l',main='Original Time Series',xlab='time',ylab='value')
if (par8=='') {
mytitle <- paste('Working Time Series (lambda=',par2,', d=',par3,', D=',par4,')',sep='')
mysub <- paste('(lambda=',par2,', d=',par3,', D=',par4,', CI=', par7, ', CI type=',par6,')',sep='')
} else {
mytitle <- paste('Working Time Series (base=',par8,', d=',par3,', D=',par4,')',sep='')
mysub <- paste('(base=',par8,', d=',par3,', D=',par4,', CI=', par7, ', CI type=',par6,')',sep='')
}
plot(x,type='l', main=mytitle,xlab='time',ylab='value')
par(op)
dev.off()
bitmap(file='pic1.png')
racf <- acf(x, par1, main='Autocorrelation', xlab='time lag', ylab='ACF', ci.type=par6, ci=par7, sub=mysub)
dev.off()
bitmap(file='pic2.png')
rpacf <- pacf(x,par1,main='Partial Autocorrelation',xlab='lags',ylab='PACF',sub=mysub)
dev.off()
(myacf <- c(racf$acf))
(mypacf <- c(rpacf$acf))
lengthx <- length(x)
sqrtn <- sqrt(lengthx)
load(file='createtable')
a<-table.start()
a<-table.row.start(a)
a<-table.element(a,'Autocorrelation Function',4,TRUE)
a<-table.row.end(a)
a<-table.row.start(a)
a<-table.element(a,'Time lag k',header=TRUE)
a<-table.element(a,hyperlink('basics.htm','ACF(k)','click here for more information about the Autocorrelation Function'),header=TRUE)
a<-table.element(a,'T-STAT',header=TRUE)
a<-table.element(a,'P-value',header=TRUE)
a<-table.row.end(a)
for (i in 2:(par1+1)) {
a<-table.row.start(a)
a<-table.element(a,i-1,header=TRUE)
a<-table.element(a,round(myacf[i],6))
mytstat <- myacf[i]*sqrtn
a<-table.element(a,round(mytstat,4))
a<-table.element(a,round(1-pt(abs(mytstat),lengthx),6))
a<-table.row.end(a)
}
a<-table.end(a)
table.save(a,file='mytable.tab')
a<-table.start()
a<-table.row.start(a)
a<-table.element(a,'Partial Autocorrelation Function',4,TRUE)
a<-table.row.end(a)
a<-table.row.start(a)
a<-table.element(a,'Time lag k',header=TRUE)
a<-table.element(a,hyperlink('basics.htm','PACF(k)','click here for more information about the Partial Autocorrelation Function'),header=TRUE)
a<-table.element(a,'T-STAT',header=TRUE)
a<-table.element(a,'P-value',header=TRUE)
a<-table.row.end(a)
for (i in 1:par1) {
a<-table.row.start(a)
a<-table.element(a,i,header=TRUE)
a<-table.element(a,round(mypacf[i],6))
mytstat <- mypacf[i]*sqrtn
a<-table.element(a,round(mytstat,4))
a<-table.element(a,round(1-pt(abs(mytstat),lengthx),6))
a<-table.row.end(a)
}
a<-table.end(a)
table.save(a,file='mytable1.tab')