Free Statistics

of Irreproducible Research!

Author's title

Author*Unverified author*
R Software Modulerwasp_autocorrelation.wasp
Title produced by software(Partial) Autocorrelation Function
Date of computationTue, 12 Apr 2011 17:52:30 +0000
Cite this page as followsStatistical Computations at FreeStatistics.org, Office for Research Development and Education, URL https://freestatistics.org/blog/index.php?v=date/2011/Apr/12/t1302630706nnd77hlxdgq57ks.htm/, Retrieved Thu, 09 May 2024 19:22:06 +0000
Statistical Computations at FreeStatistics.org, Office for Research Development and Education, URL https://freestatistics.org/blog/index.php?pk=120550, Retrieved Thu, 09 May 2024 19:22:06 +0000
QR Codes:

Original text written by user:
IsPrivate?No (this computation is public)
User-defined keywordsKDGP2W12
Estimated Impact164
Family? (F = Feedback message, R = changed R code, M = changed R Module, P = changed Parameters, D = changed Data)
-       [(Partial) Autocorrelation Function] [Opdracht 6BIS - e...] [2011-04-12 17:52:30] [0d1e0b2127d7a24abba9de0261e65ede] [Current]
Feedback Forum

Post a new message
Dataseries X:
126.304
125.511
125.495
130.133
126.257
110.323
98.417
105.749
120.665
124.075
127.245
146.731
144.979
148.210
144.670
142.970
142.524
146.142
146.522
148.128
148.798
150.181
152.388
155.694
160.662
155.520
158.262
154.338
158.196
160.371
154.856
150.636
145.899
141.242
140.834
141.119
139.104
134.437
129.425
123.155
119.273
120.472
121.523
121.983
123.658
124.794
124.827
120.382
117.395
115.790
114.283
117.271
117.448
118.764
120.550
123.554
125.412
124.182
119.828
115.361
114.226
115.214
115.864
114.276
113.469
114.883
114.172
111.225
112.149
115.618
118.002
121.382
120.663


Summary of computational transaction
Raw Inputview raw input (R code)
Raw Outputview raw output of R engine
Computing time2 seconds
R Server'Gwilym Jenkins' @ www.wessa.org

\begin{tabular}{lllllllll}
\hline
Summary of computational transaction \tabularnewline
Raw Input & view raw input (R code)  \tabularnewline
Raw Output & view raw output of R engine  \tabularnewline
Computing time & 2 seconds \tabularnewline
R Server & 'Gwilym Jenkins' @ www.wessa.org \tabularnewline
\hline
\end{tabular}
%Source: https://freestatistics.org/blog/index.php?pk=120550&T=0

[TABLE]
[ROW][C]Summary of computational transaction[/C][/ROW]
[ROW][C]Raw Input[/C][C]view raw input (R code) [/C][/ROW]
[ROW][C]Raw Output[/C][C]view raw output of R engine [/C][/ROW]
[ROW][C]Computing time[/C][C]2 seconds[/C][/ROW]
[ROW][C]R Server[/C][C]'Gwilym Jenkins' @ www.wessa.org[/C][/ROW]
[/TABLE]
Source: https://freestatistics.org/blog/index.php?pk=120550&T=0

Globally Unique Identifier (entire table): ba.freestatistics.org/blog/index.php?pk=120550&T=0

As an alternative you can also use a QR Code:  

The GUIDs for individual cells are displayed in the table below:

Summary of computational transaction
Raw Inputview raw input (R code)
Raw Outputview raw output of R engine
Computing time2 seconds
R Server'Gwilym Jenkins' @ www.wessa.org


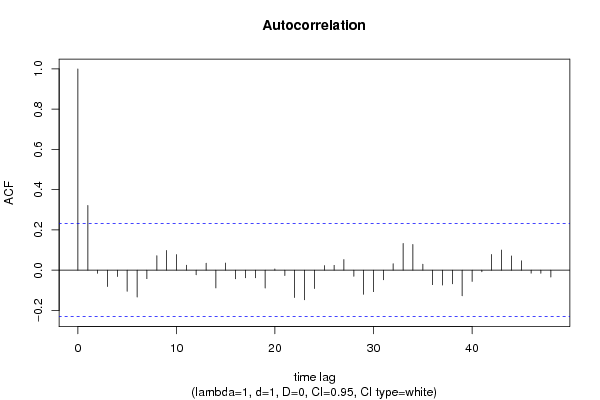
Autocorrelation Function
Time lag kACF(k)T-STATP-value
10.3214962.7280.004
2-0.015289-0.12970.44857
3-0.081069-0.68790.246864
4-0.031741-0.26930.394223
5-0.105167-0.89240.187583
6-0.133179-1.13010.131101
7-0.041913-0.35560.361574
80.0719840.61080.271625
90.0977260.82920.204857
100.0773610.65640.256821
110.0246010.20870.417618
12-0.023134-0.19630.422465
130.0345290.2930.385188
14-0.088107-0.74760.228565
150.035040.29730.383539
16-0.042403-0.35980.360026
17-0.037343-0.31690.376131
18-0.038123-0.32350.373634
19-0.08829-0.74920.228099
200.0061090.05180.479401
21-0.026352-0.22360.41185
22-0.135761-1.1520.126571
23-0.146995-1.24730.108166
24-0.090738-0.76990.221928
250.0227770.19330.423645
260.0237990.20190.420267
270.0526110.44640.328316
28-0.030095-0.25540.399584
29-0.119987-1.01810.156014
30-0.106572-0.90430.184428
31-0.047269-0.40110.34477
320.0315860.2680.394727
330.1322681.12230.132726
340.1276021.08270.141269
350.0291550.24740.402657
36-0.071751-0.60880.272276
37-0.073688-0.62530.266887
38-0.067472-0.57250.284377
39-0.12754-1.08220.141384
40-0.055894-0.47430.318368
41-0.007876-0.06680.473453
420.0783350.66470.254186
430.099550.84470.200535
440.0704930.59810.275809
450.0463470.39330.347644
46-0.014849-0.1260.450044
47-0.015211-0.12910.448831
48-0.034357-0.29150.385744

\begin{tabular}{lllllllll}
\hline
Autocorrelation Function \tabularnewline
Time lag k & ACF(k) & T-STAT & P-value \tabularnewline
1 & 0.321496 & 2.728 & 0.004 \tabularnewline
2 & -0.015289 & -0.1297 & 0.44857 \tabularnewline
3 & -0.081069 & -0.6879 & 0.246864 \tabularnewline
4 & -0.031741 & -0.2693 & 0.394223 \tabularnewline
5 & -0.105167 & -0.8924 & 0.187583 \tabularnewline
6 & -0.133179 & -1.1301 & 0.131101 \tabularnewline
7 & -0.041913 & -0.3556 & 0.361574 \tabularnewline
8 & 0.071984 & 0.6108 & 0.271625 \tabularnewline
9 & 0.097726 & 0.8292 & 0.204857 \tabularnewline
10 & 0.077361 & 0.6564 & 0.256821 \tabularnewline
11 & 0.024601 & 0.2087 & 0.417618 \tabularnewline
12 & -0.023134 & -0.1963 & 0.422465 \tabularnewline
13 & 0.034529 & 0.293 & 0.385188 \tabularnewline
14 & -0.088107 & -0.7476 & 0.228565 \tabularnewline
15 & 0.03504 & 0.2973 & 0.383539 \tabularnewline
16 & -0.042403 & -0.3598 & 0.360026 \tabularnewline
17 & -0.037343 & -0.3169 & 0.376131 \tabularnewline
18 & -0.038123 & -0.3235 & 0.373634 \tabularnewline
19 & -0.08829 & -0.7492 & 0.228099 \tabularnewline
20 & 0.006109 & 0.0518 & 0.479401 \tabularnewline
21 & -0.026352 & -0.2236 & 0.41185 \tabularnewline
22 & -0.135761 & -1.152 & 0.126571 \tabularnewline
23 & -0.146995 & -1.2473 & 0.108166 \tabularnewline
24 & -0.090738 & -0.7699 & 0.221928 \tabularnewline
25 & 0.022777 & 0.1933 & 0.423645 \tabularnewline
26 & 0.023799 & 0.2019 & 0.420267 \tabularnewline
27 & 0.052611 & 0.4464 & 0.328316 \tabularnewline
28 & -0.030095 & -0.2554 & 0.399584 \tabularnewline
29 & -0.119987 & -1.0181 & 0.156014 \tabularnewline
30 & -0.106572 & -0.9043 & 0.184428 \tabularnewline
31 & -0.047269 & -0.4011 & 0.34477 \tabularnewline
32 & 0.031586 & 0.268 & 0.394727 \tabularnewline
33 & 0.132268 & 1.1223 & 0.132726 \tabularnewline
34 & 0.127602 & 1.0827 & 0.141269 \tabularnewline
35 & 0.029155 & 0.2474 & 0.402657 \tabularnewline
36 & -0.071751 & -0.6088 & 0.272276 \tabularnewline
37 & -0.073688 & -0.6253 & 0.266887 \tabularnewline
38 & -0.067472 & -0.5725 & 0.284377 \tabularnewline
39 & -0.12754 & -1.0822 & 0.141384 \tabularnewline
40 & -0.055894 & -0.4743 & 0.318368 \tabularnewline
41 & -0.007876 & -0.0668 & 0.473453 \tabularnewline
42 & 0.078335 & 0.6647 & 0.254186 \tabularnewline
43 & 0.09955 & 0.8447 & 0.200535 \tabularnewline
44 & 0.070493 & 0.5981 & 0.275809 \tabularnewline
45 & 0.046347 & 0.3933 & 0.347644 \tabularnewline
46 & -0.014849 & -0.126 & 0.450044 \tabularnewline
47 & -0.015211 & -0.1291 & 0.448831 \tabularnewline
48 & -0.034357 & -0.2915 & 0.385744 \tabularnewline
\hline
\end{tabular}
%Source: https://freestatistics.org/blog/index.php?pk=120550&T=1

[TABLE]
[ROW][C]Autocorrelation Function[/C][/ROW]
[ROW][C]Time lag k[/C][C]ACF(k)[/C][C]T-STAT[/C][C]P-value[/C][/ROW]
[ROW][C]1[/C][C]0.321496[/C][C]2.728[/C][C]0.004[/C][/ROW]
[ROW][C]2[/C][C]-0.015289[/C][C]-0.1297[/C][C]0.44857[/C][/ROW]
[ROW][C]3[/C][C]-0.081069[/C][C]-0.6879[/C][C]0.246864[/C][/ROW]
[ROW][C]4[/C][C]-0.031741[/C][C]-0.2693[/C][C]0.394223[/C][/ROW]
[ROW][C]5[/C][C]-0.105167[/C][C]-0.8924[/C][C]0.187583[/C][/ROW]
[ROW][C]6[/C][C]-0.133179[/C][C]-1.1301[/C][C]0.131101[/C][/ROW]
[ROW][C]7[/C][C]-0.041913[/C][C]-0.3556[/C][C]0.361574[/C][/ROW]
[ROW][C]8[/C][C]0.071984[/C][C]0.6108[/C][C]0.271625[/C][/ROW]
[ROW][C]9[/C][C]0.097726[/C][C]0.8292[/C][C]0.204857[/C][/ROW]
[ROW][C]10[/C][C]0.077361[/C][C]0.6564[/C][C]0.256821[/C][/ROW]
[ROW][C]11[/C][C]0.024601[/C][C]0.2087[/C][C]0.417618[/C][/ROW]
[ROW][C]12[/C][C]-0.023134[/C][C]-0.1963[/C][C]0.422465[/C][/ROW]
[ROW][C]13[/C][C]0.034529[/C][C]0.293[/C][C]0.385188[/C][/ROW]
[ROW][C]14[/C][C]-0.088107[/C][C]-0.7476[/C][C]0.228565[/C][/ROW]
[ROW][C]15[/C][C]0.03504[/C][C]0.2973[/C][C]0.383539[/C][/ROW]
[ROW][C]16[/C][C]-0.042403[/C][C]-0.3598[/C][C]0.360026[/C][/ROW]
[ROW][C]17[/C][C]-0.037343[/C][C]-0.3169[/C][C]0.376131[/C][/ROW]
[ROW][C]18[/C][C]-0.038123[/C][C]-0.3235[/C][C]0.373634[/C][/ROW]
[ROW][C]19[/C][C]-0.08829[/C][C]-0.7492[/C][C]0.228099[/C][/ROW]
[ROW][C]20[/C][C]0.006109[/C][C]0.0518[/C][C]0.479401[/C][/ROW]
[ROW][C]21[/C][C]-0.026352[/C][C]-0.2236[/C][C]0.41185[/C][/ROW]
[ROW][C]22[/C][C]-0.135761[/C][C]-1.152[/C][C]0.126571[/C][/ROW]
[ROW][C]23[/C][C]-0.146995[/C][C]-1.2473[/C][C]0.108166[/C][/ROW]
[ROW][C]24[/C][C]-0.090738[/C][C]-0.7699[/C][C]0.221928[/C][/ROW]
[ROW][C]25[/C][C]0.022777[/C][C]0.1933[/C][C]0.423645[/C][/ROW]
[ROW][C]26[/C][C]0.023799[/C][C]0.2019[/C][C]0.420267[/C][/ROW]
[ROW][C]27[/C][C]0.052611[/C][C]0.4464[/C][C]0.328316[/C][/ROW]
[ROW][C]28[/C][C]-0.030095[/C][C]-0.2554[/C][C]0.399584[/C][/ROW]
[ROW][C]29[/C][C]-0.119987[/C][C]-1.0181[/C][C]0.156014[/C][/ROW]
[ROW][C]30[/C][C]-0.106572[/C][C]-0.9043[/C][C]0.184428[/C][/ROW]
[ROW][C]31[/C][C]-0.047269[/C][C]-0.4011[/C][C]0.34477[/C][/ROW]
[ROW][C]32[/C][C]0.031586[/C][C]0.268[/C][C]0.394727[/C][/ROW]
[ROW][C]33[/C][C]0.132268[/C][C]1.1223[/C][C]0.132726[/C][/ROW]
[ROW][C]34[/C][C]0.127602[/C][C]1.0827[/C][C]0.141269[/C][/ROW]
[ROW][C]35[/C][C]0.029155[/C][C]0.2474[/C][C]0.402657[/C][/ROW]
[ROW][C]36[/C][C]-0.071751[/C][C]-0.6088[/C][C]0.272276[/C][/ROW]
[ROW][C]37[/C][C]-0.073688[/C][C]-0.6253[/C][C]0.266887[/C][/ROW]
[ROW][C]38[/C][C]-0.067472[/C][C]-0.5725[/C][C]0.284377[/C][/ROW]
[ROW][C]39[/C][C]-0.12754[/C][C]-1.0822[/C][C]0.141384[/C][/ROW]
[ROW][C]40[/C][C]-0.055894[/C][C]-0.4743[/C][C]0.318368[/C][/ROW]
[ROW][C]41[/C][C]-0.007876[/C][C]-0.0668[/C][C]0.473453[/C][/ROW]
[ROW][C]42[/C][C]0.078335[/C][C]0.6647[/C][C]0.254186[/C][/ROW]
[ROW][C]43[/C][C]0.09955[/C][C]0.8447[/C][C]0.200535[/C][/ROW]
[ROW][C]44[/C][C]0.070493[/C][C]0.5981[/C][C]0.275809[/C][/ROW]
[ROW][C]45[/C][C]0.046347[/C][C]0.3933[/C][C]0.347644[/C][/ROW]
[ROW][C]46[/C][C]-0.014849[/C][C]-0.126[/C][C]0.450044[/C][/ROW]
[ROW][C]47[/C][C]-0.015211[/C][C]-0.1291[/C][C]0.448831[/C][/ROW]
[ROW][C]48[/C][C]-0.034357[/C][C]-0.2915[/C][C]0.385744[/C][/ROW]
[/TABLE]
Source: https://freestatistics.org/blog/index.php?pk=120550&T=1

Globally Unique Identifier (entire table): ba.freestatistics.org/blog/index.php?pk=120550&T=1

As an alternative you can also use a QR Code:  

The GUIDs for individual cells are displayed in the table below:

Autocorrelation Function
Time lag kACF(k)T-STATP-value
10.3214962.7280.004
2-0.015289-0.12970.44857
3-0.081069-0.68790.246864
4-0.031741-0.26930.394223
5-0.105167-0.89240.187583
6-0.133179-1.13010.131101
7-0.041913-0.35560.361574
80.0719840.61080.271625
90.0977260.82920.204857
100.0773610.65640.256821
110.0246010.20870.417618
12-0.023134-0.19630.422465
130.0345290.2930.385188
14-0.088107-0.74760.228565
150.035040.29730.383539
16-0.042403-0.35980.360026
17-0.037343-0.31690.376131
18-0.038123-0.32350.373634
19-0.08829-0.74920.228099
200.0061090.05180.479401
21-0.026352-0.22360.41185
22-0.135761-1.1520.126571
23-0.146995-1.24730.108166
24-0.090738-0.76990.221928
250.0227770.19330.423645
260.0237990.20190.420267
270.0526110.44640.328316
28-0.030095-0.25540.399584
29-0.119987-1.01810.156014
30-0.106572-0.90430.184428
31-0.047269-0.40110.34477
320.0315860.2680.394727
330.1322681.12230.132726
340.1276021.08270.141269
350.0291550.24740.402657
36-0.071751-0.60880.272276
37-0.073688-0.62530.266887
38-0.067472-0.57250.284377
39-0.12754-1.08220.141384
40-0.055894-0.47430.318368
41-0.007876-0.06680.473453
420.0783350.66470.254186
430.099550.84470.200535
440.0704930.59810.275809
450.0463470.39330.347644
46-0.014849-0.1260.450044
47-0.015211-0.12910.448831
48-0.034357-0.29150.385744


Partial Autocorrelation Function
Time lag kPACF(k)T-STATP-value
10.3214962.7280.004
2-0.132326-1.12280.132622
3-0.037416-0.31750.375896
40.0086210.07320.470943
5-0.121289-1.02920.153423
6-0.073626-0.62470.26706
70.0188750.16020.436603
80.0598110.50750.306673
90.0429190.36420.358394
100.0356120.30220.381695
11-0.013648-0.11580.454063
12-0.029914-0.25380.400174
130.0777230.65950.255838
14-0.122912-1.04290.150232
150.1498771.27170.103778
16-0.115313-0.97850.165562
17-0.005337-0.04530.482002
18-0.022456-0.19050.42471
19-0.118382-1.00450.15925
200.0877610.74470.229447
21-0.092335-0.78350.217955
22-0.136824-1.1610.124741
23-0.076983-0.65320.257847
24-0.074549-0.63260.264509
250.0481180.40830.342134
26-0.036921-0.31330.377485
270.0891140.75620.22601
28-0.179694-1.52480.06585
29-0.060674-0.51480.304121
30-0.079477-0.67440.251112
310.0076030.06450.474371
320.1283651.08920.139847
330.0613940.52090.302001
340.0975150.82740.20536
35-0.125179-1.06220.145851
36-0.092324-0.78340.217983
370.0188370.15980.436729
38-0.064431-0.54670.293133
390.0007120.0060.497597
40-0.07373-0.62560.26677
41-0.043212-0.36670.357473
42-0.033421-0.28360.38877
430.0373390.31680.376144
440.0274820.23320.408137
45-0.03363-0.28540.388095
46-0.042981-0.36470.358199
47-0.066614-0.56520.286834
48-0.015666-0.13290.447311

\begin{tabular}{lllllllll}
\hline
Partial Autocorrelation Function \tabularnewline
Time lag k & PACF(k) & T-STAT & P-value \tabularnewline
1 & 0.321496 & 2.728 & 0.004 \tabularnewline
2 & -0.132326 & -1.1228 & 0.132622 \tabularnewline
3 & -0.037416 & -0.3175 & 0.375896 \tabularnewline
4 & 0.008621 & 0.0732 & 0.470943 \tabularnewline
5 & -0.121289 & -1.0292 & 0.153423 \tabularnewline
6 & -0.073626 & -0.6247 & 0.26706 \tabularnewline
7 & 0.018875 & 0.1602 & 0.436603 \tabularnewline
8 & 0.059811 & 0.5075 & 0.306673 \tabularnewline
9 & 0.042919 & 0.3642 & 0.358394 \tabularnewline
10 & 0.035612 & 0.3022 & 0.381695 \tabularnewline
11 & -0.013648 & -0.1158 & 0.454063 \tabularnewline
12 & -0.029914 & -0.2538 & 0.400174 \tabularnewline
13 & 0.077723 & 0.6595 & 0.255838 \tabularnewline
14 & -0.122912 & -1.0429 & 0.150232 \tabularnewline
15 & 0.149877 & 1.2717 & 0.103778 \tabularnewline
16 & -0.115313 & -0.9785 & 0.165562 \tabularnewline
17 & -0.005337 & -0.0453 & 0.482002 \tabularnewline
18 & -0.022456 & -0.1905 & 0.42471 \tabularnewline
19 & -0.118382 & -1.0045 & 0.15925 \tabularnewline
20 & 0.087761 & 0.7447 & 0.229447 \tabularnewline
21 & -0.092335 & -0.7835 & 0.217955 \tabularnewline
22 & -0.136824 & -1.161 & 0.124741 \tabularnewline
23 & -0.076983 & -0.6532 & 0.257847 \tabularnewline
24 & -0.074549 & -0.6326 & 0.264509 \tabularnewline
25 & 0.048118 & 0.4083 & 0.342134 \tabularnewline
26 & -0.036921 & -0.3133 & 0.377485 \tabularnewline
27 & 0.089114 & 0.7562 & 0.22601 \tabularnewline
28 & -0.179694 & -1.5248 & 0.06585 \tabularnewline
29 & -0.060674 & -0.5148 & 0.304121 \tabularnewline
30 & -0.079477 & -0.6744 & 0.251112 \tabularnewline
31 & 0.007603 & 0.0645 & 0.474371 \tabularnewline
32 & 0.128365 & 1.0892 & 0.139847 \tabularnewline
33 & 0.061394 & 0.5209 & 0.302001 \tabularnewline
34 & 0.097515 & 0.8274 & 0.20536 \tabularnewline
35 & -0.125179 & -1.0622 & 0.145851 \tabularnewline
36 & -0.092324 & -0.7834 & 0.217983 \tabularnewline
37 & 0.018837 & 0.1598 & 0.436729 \tabularnewline
38 & -0.064431 & -0.5467 & 0.293133 \tabularnewline
39 & 0.000712 & 0.006 & 0.497597 \tabularnewline
40 & -0.07373 & -0.6256 & 0.26677 \tabularnewline
41 & -0.043212 & -0.3667 & 0.357473 \tabularnewline
42 & -0.033421 & -0.2836 & 0.38877 \tabularnewline
43 & 0.037339 & 0.3168 & 0.376144 \tabularnewline
44 & 0.027482 & 0.2332 & 0.408137 \tabularnewline
45 & -0.03363 & -0.2854 & 0.388095 \tabularnewline
46 & -0.042981 & -0.3647 & 0.358199 \tabularnewline
47 & -0.066614 & -0.5652 & 0.286834 \tabularnewline
48 & -0.015666 & -0.1329 & 0.447311 \tabularnewline
\hline
\end{tabular}
%Source: https://freestatistics.org/blog/index.php?pk=120550&T=2

[TABLE]
[ROW][C]Partial Autocorrelation Function[/C][/ROW]
[ROW][C]Time lag k[/C][C]PACF(k)[/C][C]T-STAT[/C][C]P-value[/C][/ROW]
[ROW][C]1[/C][C]0.321496[/C][C]2.728[/C][C]0.004[/C][/ROW]
[ROW][C]2[/C][C]-0.132326[/C][C]-1.1228[/C][C]0.132622[/C][/ROW]
[ROW][C]3[/C][C]-0.037416[/C][C]-0.3175[/C][C]0.375896[/C][/ROW]
[ROW][C]4[/C][C]0.008621[/C][C]0.0732[/C][C]0.470943[/C][/ROW]
[ROW][C]5[/C][C]-0.121289[/C][C]-1.0292[/C][C]0.153423[/C][/ROW]
[ROW][C]6[/C][C]-0.073626[/C][C]-0.6247[/C][C]0.26706[/C][/ROW]
[ROW][C]7[/C][C]0.018875[/C][C]0.1602[/C][C]0.436603[/C][/ROW]
[ROW][C]8[/C][C]0.059811[/C][C]0.5075[/C][C]0.306673[/C][/ROW]
[ROW][C]9[/C][C]0.042919[/C][C]0.3642[/C][C]0.358394[/C][/ROW]
[ROW][C]10[/C][C]0.035612[/C][C]0.3022[/C][C]0.381695[/C][/ROW]
[ROW][C]11[/C][C]-0.013648[/C][C]-0.1158[/C][C]0.454063[/C][/ROW]
[ROW][C]12[/C][C]-0.029914[/C][C]-0.2538[/C][C]0.400174[/C][/ROW]
[ROW][C]13[/C][C]0.077723[/C][C]0.6595[/C][C]0.255838[/C][/ROW]
[ROW][C]14[/C][C]-0.122912[/C][C]-1.0429[/C][C]0.150232[/C][/ROW]
[ROW][C]15[/C][C]0.149877[/C][C]1.2717[/C][C]0.103778[/C][/ROW]
[ROW][C]16[/C][C]-0.115313[/C][C]-0.9785[/C][C]0.165562[/C][/ROW]
[ROW][C]17[/C][C]-0.005337[/C][C]-0.0453[/C][C]0.482002[/C][/ROW]
[ROW][C]18[/C][C]-0.022456[/C][C]-0.1905[/C][C]0.42471[/C][/ROW]
[ROW][C]19[/C][C]-0.118382[/C][C]-1.0045[/C][C]0.15925[/C][/ROW]
[ROW][C]20[/C][C]0.087761[/C][C]0.7447[/C][C]0.229447[/C][/ROW]
[ROW][C]21[/C][C]-0.092335[/C][C]-0.7835[/C][C]0.217955[/C][/ROW]
[ROW][C]22[/C][C]-0.136824[/C][C]-1.161[/C][C]0.124741[/C][/ROW]
[ROW][C]23[/C][C]-0.076983[/C][C]-0.6532[/C][C]0.257847[/C][/ROW]
[ROW][C]24[/C][C]-0.074549[/C][C]-0.6326[/C][C]0.264509[/C][/ROW]
[ROW][C]25[/C][C]0.048118[/C][C]0.4083[/C][C]0.342134[/C][/ROW]
[ROW][C]26[/C][C]-0.036921[/C][C]-0.3133[/C][C]0.377485[/C][/ROW]
[ROW][C]27[/C][C]0.089114[/C][C]0.7562[/C][C]0.22601[/C][/ROW]
[ROW][C]28[/C][C]-0.179694[/C][C]-1.5248[/C][C]0.06585[/C][/ROW]
[ROW][C]29[/C][C]-0.060674[/C][C]-0.5148[/C][C]0.304121[/C][/ROW]
[ROW][C]30[/C][C]-0.079477[/C][C]-0.6744[/C][C]0.251112[/C][/ROW]
[ROW][C]31[/C][C]0.007603[/C][C]0.0645[/C][C]0.474371[/C][/ROW]
[ROW][C]32[/C][C]0.128365[/C][C]1.0892[/C][C]0.139847[/C][/ROW]
[ROW][C]33[/C][C]0.061394[/C][C]0.5209[/C][C]0.302001[/C][/ROW]
[ROW][C]34[/C][C]0.097515[/C][C]0.8274[/C][C]0.20536[/C][/ROW]
[ROW][C]35[/C][C]-0.125179[/C][C]-1.0622[/C][C]0.145851[/C][/ROW]
[ROW][C]36[/C][C]-0.092324[/C][C]-0.7834[/C][C]0.217983[/C][/ROW]
[ROW][C]37[/C][C]0.018837[/C][C]0.1598[/C][C]0.436729[/C][/ROW]
[ROW][C]38[/C][C]-0.064431[/C][C]-0.5467[/C][C]0.293133[/C][/ROW]
[ROW][C]39[/C][C]0.000712[/C][C]0.006[/C][C]0.497597[/C][/ROW]
[ROW][C]40[/C][C]-0.07373[/C][C]-0.6256[/C][C]0.26677[/C][/ROW]
[ROW][C]41[/C][C]-0.043212[/C][C]-0.3667[/C][C]0.357473[/C][/ROW]
[ROW][C]42[/C][C]-0.033421[/C][C]-0.2836[/C][C]0.38877[/C][/ROW]
[ROW][C]43[/C][C]0.037339[/C][C]0.3168[/C][C]0.376144[/C][/ROW]
[ROW][C]44[/C][C]0.027482[/C][C]0.2332[/C][C]0.408137[/C][/ROW]
[ROW][C]45[/C][C]-0.03363[/C][C]-0.2854[/C][C]0.388095[/C][/ROW]
[ROW][C]46[/C][C]-0.042981[/C][C]-0.3647[/C][C]0.358199[/C][/ROW]
[ROW][C]47[/C][C]-0.066614[/C][C]-0.5652[/C][C]0.286834[/C][/ROW]
[ROW][C]48[/C][C]-0.015666[/C][C]-0.1329[/C][C]0.447311[/C][/ROW]
[/TABLE]
Source: https://freestatistics.org/blog/index.php?pk=120550&T=2

Globally Unique Identifier (entire table): ba.freestatistics.org/blog/index.php?pk=120550&T=2

As an alternative you can also use a QR Code:  

The GUIDs for individual cells are displayed in the table below:

Partial Autocorrelation Function
Time lag kPACF(k)T-STATP-value
10.3214962.7280.004
2-0.132326-1.12280.132622
3-0.037416-0.31750.375896
40.0086210.07320.470943
5-0.121289-1.02920.153423
6-0.073626-0.62470.26706
70.0188750.16020.436603
80.0598110.50750.306673
90.0429190.36420.358394
100.0356120.30220.381695
11-0.013648-0.11580.454063
12-0.029914-0.25380.400174
130.0777230.65950.255838
14-0.122912-1.04290.150232
150.1498771.27170.103778
16-0.115313-0.97850.165562
17-0.005337-0.04530.482002
18-0.022456-0.19050.42471
19-0.118382-1.00450.15925
200.0877610.74470.229447
21-0.092335-0.78350.217955
22-0.136824-1.1610.124741
23-0.076983-0.65320.257847
24-0.074549-0.63260.264509
250.0481180.40830.342134
26-0.036921-0.31330.377485
270.0891140.75620.22601
28-0.179694-1.52480.06585
29-0.060674-0.51480.304121
30-0.079477-0.67440.251112
310.0076030.06450.474371
320.1283651.08920.139847
330.0613940.52090.302001
340.0975150.82740.20536
35-0.125179-1.06220.145851
36-0.092324-0.78340.217983
370.0188370.15980.436729
38-0.064431-0.54670.293133
390.0007120.0060.497597
40-0.07373-0.62560.26677
41-0.043212-0.36670.357473
42-0.033421-0.28360.38877
430.0373390.31680.376144
440.0274820.23320.408137
45-0.03363-0.28540.388095
46-0.042981-0.36470.358199
47-0.066614-0.56520.286834
48-0.015666-0.13290.447311


Parameters (Session):
par1 = 48 ; par2 = 1 ; par3 = 1 ; par4 = 0 ; par5 = 12 ; par6 = White Noise ; par7 = 0.95 ;
Parameters (R input):
par1 = 48 ; par2 = 1 ; par3 = 1 ; par4 = 0 ; par5 = 12 ; par6 = White Noise ; par7 = 0.95 ; par8 = ;
R code (references can be found in the software module):
if (par1 == 'Default') {
par1 = 10*log10(length(x))
} else {
par1 <- as.numeric(par1)
}
par2 <- as.numeric(par2)
par3 <- as.numeric(par3)
par4 <- as.numeric(par4)
par5 <- as.numeric(par5)
if (par6 == 'White Noise') par6 <- 'white' else par6 <- 'ma'
par7 <- as.numeric(par7)
if (par8 != '') par8 <- as.numeric(par8)
ox <- x
if (par8 == '') {
if (par2 == 0) {
x <- log(x)
} else {
x <- (x ^ par2 - 1) / par2
}
} else {
x <- log(x,base=par8)
}
if (par3 > 0) x <- diff(x,lag=1,difference=par3)
if (par4 > 0) x <- diff(x,lag=par5,difference=par4)
bitmap(file='picts.png')
op <- par(mfrow=c(2,1))
plot(ox,type='l',main='Original Time Series',xlab='time',ylab='value')
if (par8=='') {
mytitle <- paste('Working Time Series (lambda=',par2,', d=',par3,', D=',par4,')',sep='')
mysub <- paste('(lambda=',par2,', d=',par3,', D=',par4,', CI=', par7, ', CI type=',par6,')',sep='')
} else {
mytitle <- paste('Working Time Series (base=',par8,', d=',par3,', D=',par4,')',sep='')
mysub <- paste('(base=',par8,', d=',par3,', D=',par4,', CI=', par7, ', CI type=',par6,')',sep='')
}
plot(x,type='l', main=mytitle,xlab='time',ylab='value')
par(op)
dev.off()
bitmap(file='pic1.png')
racf <- acf(x, par1, main='Autocorrelation', xlab='time lag', ylab='ACF', ci.type=par6, ci=par7, sub=mysub)
dev.off()
bitmap(file='pic2.png')
rpacf <- pacf(x,par1,main='Partial Autocorrelation',xlab='lags',ylab='PACF',sub=mysub)
dev.off()
(myacf <- c(racf$acf))
(mypacf <- c(rpacf$acf))
lengthx <- length(x)
sqrtn <- sqrt(lengthx)
load(file='createtable')
a<-table.start()
a<-table.row.start(a)
a<-table.element(a,'Autocorrelation Function',4,TRUE)
a<-table.row.end(a)
a<-table.row.start(a)
a<-table.element(a,'Time lag k',header=TRUE)
a<-table.element(a,hyperlink('basics.htm','ACF(k)','click here for more information about the Autocorrelation Function'),header=TRUE)
a<-table.element(a,'T-STAT',header=TRUE)
a<-table.element(a,'P-value',header=TRUE)
a<-table.row.end(a)
for (i in 2:(par1+1)) {
a<-table.row.start(a)
a<-table.element(a,i-1,header=TRUE)
a<-table.element(a,round(myacf[i],6))
mytstat <- myacf[i]*sqrtn
a<-table.element(a,round(mytstat,4))
a<-table.element(a,round(1-pt(abs(mytstat),lengthx),6))
a<-table.row.end(a)
}
a<-table.end(a)
table.save(a,file='mytable.tab')
a<-table.start()
a<-table.row.start(a)
a<-table.element(a,'Partial Autocorrelation Function',4,TRUE)
a<-table.row.end(a)
a<-table.row.start(a)
a<-table.element(a,'Time lag k',header=TRUE)
a<-table.element(a,hyperlink('basics.htm','PACF(k)','click here for more information about the Partial Autocorrelation Function'),header=TRUE)
a<-table.element(a,'T-STAT',header=TRUE)
a<-table.element(a,'P-value',header=TRUE)
a<-table.row.end(a)
for (i in 1:par1) {
a<-table.row.start(a)
a<-table.element(a,i,header=TRUE)
a<-table.element(a,round(mypacf[i],6))
mytstat <- mypacf[i]*sqrtn
a<-table.element(a,round(mytstat,4))
a<-table.element(a,round(1-pt(abs(mytstat),lengthx),6))
a<-table.row.end(a)
}
a<-table.end(a)
table.save(a,file='mytable1.tab')