Free Statistics

of Irreproducible Research!

Author's title

Author*Unverified author*
R Software Modulerwasp_autocorrelation.wasp
Title produced by software(Partial) Autocorrelation Function
Date of computationTue, 12 Apr 2011 17:48:23 +0000
Cite this page as followsStatistical Computations at FreeStatistics.org, Office for Research Development and Education, URL https://freestatistics.org/blog/index.php?v=date/2011/Apr/12/t1302630361grptssb1zpkt4vv.htm/, Retrieved Thu, 09 May 2024 08:04:26 +0000
Statistical Computations at FreeStatistics.org, Office for Research Development and Education, URL https://freestatistics.org/blog/index.php?pk=120549, Retrieved Thu, 09 May 2024 08:04:26 +0000
QR Codes:

Original text written by user:
IsPrivate?No (this computation is public)
User-defined keywordsKDGP2W12
Estimated Impact133
Family? (F = Feedback message, R = changed R code, M = changed R Module, P = changed Parameters, D = changed Data)
-       [(Partial) Autocorrelation Function] [Opdracht 6BIS - e...] [2011-04-12 17:48:23] [0d1e0b2127d7a24abba9de0261e65ede] [Current]
Feedback Forum

Post a new message
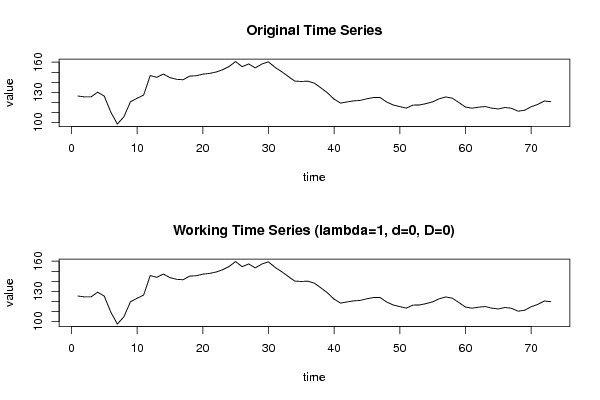
Dataseries X:
126.304
125.511
125.495
130.133
126.257
110.323
98.417
105.749
120.665
124.075
127.245
146.731
144.979
148.210
144.670
142.970
142.524
146.142
146.522
148.128
148.798
150.181
152.388
155.694
160.662
155.520
158.262
154.338
158.196
160.371
154.856
150.636
145.899
141.242
140.834
141.119
139.104
134.437
129.425
123.155
119.273
120.472
121.523
121.983
123.658
124.794
124.827
120.382
117.395
115.790
114.283
117.271
117.448
118.764
120.550
123.554
125.412
124.182
119.828
115.361
114.226
115.214
115.864
114.276
113.469
114.883
114.172
111.225
112.149
115.618
118.002
121.382
120.663


Summary of computational transaction
Raw Inputview raw input (R code)
Raw Outputview raw output of R engine
Computing time2 seconds
R Server'George Udny Yule' @ 216.218.223.82

\begin{tabular}{lllllllll}
\hline
Summary of computational transaction \tabularnewline
Raw Input & view raw input (R code)  \tabularnewline
Raw Output & view raw output of R engine  \tabularnewline
Computing time & 2 seconds \tabularnewline
R Server & 'George Udny Yule' @ 216.218.223.82 \tabularnewline
\hline
\end{tabular}
%Source: https://freestatistics.org/blog/index.php?pk=120549&T=0

[TABLE]
[ROW][C]Summary of computational transaction[/C][/ROW]
[ROW][C]Raw Input[/C][C]view raw input (R code) [/C][/ROW]
[ROW][C]Raw Output[/C][C]view raw output of R engine [/C][/ROW]
[ROW][C]Computing time[/C][C]2 seconds[/C][/ROW]
[ROW][C]R Server[/C][C]'George Udny Yule' @ 216.218.223.82[/C][/ROW]
[/TABLE]
Source: https://freestatistics.org/blog/index.php?pk=120549&T=0

Globally Unique Identifier (entire table): ba.freestatistics.org/blog/index.php?pk=120549&T=0

As an alternative you can also use a QR Code:  

The GUIDs for individual cells are displayed in the table below:

Summary of computational transaction
Raw Inputview raw input (R code)
Raw Outputview raw output of R engine
Computing time2 seconds
R Server'George Udny Yule' @ 216.218.223.82


Autocorrelation Function
Time lag kACF(k)T-STATP-value
10.9515728.13020
20.8740567.46790
30.796116.8020
40.7252026.19610
50.6544715.59180
60.5894715.03642e-06
70.5357124.57719e-06
80.4877324.16724.2e-05
90.435563.72140.000193
100.3755883.2090.00099
110.3100242.64880.004947
120.2458442.10050.01957
130.1827411.56130.061385
140.1176241.0050.159112
150.0620310.530.298862
160.00510.04360.482681
17-0.047495-0.40580.343041
18-0.097011-0.82890.204941
19-0.144684-1.23620.110178
20-0.185055-1.58110.059088
21-0.226681-1.93680.028322
22-0.265862-2.27150.013032
23-0.293966-2.51160.007114
24-0.307371-2.62620.005257
25-0.310816-2.65560.004857
26-0.316005-2.70.004307
27-0.320592-2.73910.003868
28-0.330955-2.82770.003024
29-0.338525-2.89240.002518
30-0.335772-2.86880.002692
31-0.324877-2.77570.003496
32-0.311265-2.65950.004807
33-0.302292-2.58280.005902
34-0.304388-2.60070.005628
35-0.314942-2.69090.004415
36-0.325485-2.78090.003446
37-0.327465-2.79790.003287
38-0.322638-2.75660.003686
39-0.312836-2.67290.004636
40-0.292459-2.49880.007356
41-0.265247-2.26630.0132
42-0.234444-2.00310.02444
43-0.208192-1.77880.039719
44-0.187842-1.60490.056415
45-0.17457-1.49150.070066
46-0.167204-1.42860.078693
47-0.156274-1.33520.092979
48-0.146207-1.24920.107793

\begin{tabular}{lllllllll}
\hline
Autocorrelation Function \tabularnewline
Time lag k & ACF(k) & T-STAT & P-value \tabularnewline
1 & 0.951572 & 8.1302 & 0 \tabularnewline
2 & 0.874056 & 7.4679 & 0 \tabularnewline
3 & 0.79611 & 6.802 & 0 \tabularnewline
4 & 0.725202 & 6.1961 & 0 \tabularnewline
5 & 0.654471 & 5.5918 & 0 \tabularnewline
6 & 0.589471 & 5.0364 & 2e-06 \tabularnewline
7 & 0.535712 & 4.5771 & 9e-06 \tabularnewline
8 & 0.487732 & 4.1672 & 4.2e-05 \tabularnewline
9 & 0.43556 & 3.7214 & 0.000193 \tabularnewline
10 & 0.375588 & 3.209 & 0.00099 \tabularnewline
11 & 0.310024 & 2.6488 & 0.004947 \tabularnewline
12 & 0.245844 & 2.1005 & 0.01957 \tabularnewline
13 & 0.182741 & 1.5613 & 0.061385 \tabularnewline
14 & 0.117624 & 1.005 & 0.159112 \tabularnewline
15 & 0.062031 & 0.53 & 0.298862 \tabularnewline
16 & 0.0051 & 0.0436 & 0.482681 \tabularnewline
17 & -0.047495 & -0.4058 & 0.343041 \tabularnewline
18 & -0.097011 & -0.8289 & 0.204941 \tabularnewline
19 & -0.144684 & -1.2362 & 0.110178 \tabularnewline
20 & -0.185055 & -1.5811 & 0.059088 \tabularnewline
21 & -0.226681 & -1.9368 & 0.028322 \tabularnewline
22 & -0.265862 & -2.2715 & 0.013032 \tabularnewline
23 & -0.293966 & -2.5116 & 0.007114 \tabularnewline
24 & -0.307371 & -2.6262 & 0.005257 \tabularnewline
25 & -0.310816 & -2.6556 & 0.004857 \tabularnewline
26 & -0.316005 & -2.7 & 0.004307 \tabularnewline
27 & -0.320592 & -2.7391 & 0.003868 \tabularnewline
28 & -0.330955 & -2.8277 & 0.003024 \tabularnewline
29 & -0.338525 & -2.8924 & 0.002518 \tabularnewline
30 & -0.335772 & -2.8688 & 0.002692 \tabularnewline
31 & -0.324877 & -2.7757 & 0.003496 \tabularnewline
32 & -0.311265 & -2.6595 & 0.004807 \tabularnewline
33 & -0.302292 & -2.5828 & 0.005902 \tabularnewline
34 & -0.304388 & -2.6007 & 0.005628 \tabularnewline
35 & -0.314942 & -2.6909 & 0.004415 \tabularnewline
36 & -0.325485 & -2.7809 & 0.003446 \tabularnewline
37 & -0.327465 & -2.7979 & 0.003287 \tabularnewline
38 & -0.322638 & -2.7566 & 0.003686 \tabularnewline
39 & -0.312836 & -2.6729 & 0.004636 \tabularnewline
40 & -0.292459 & -2.4988 & 0.007356 \tabularnewline
41 & -0.265247 & -2.2663 & 0.0132 \tabularnewline
42 & -0.234444 & -2.0031 & 0.02444 \tabularnewline
43 & -0.208192 & -1.7788 & 0.039719 \tabularnewline
44 & -0.187842 & -1.6049 & 0.056415 \tabularnewline
45 & -0.17457 & -1.4915 & 0.070066 \tabularnewline
46 & -0.167204 & -1.4286 & 0.078693 \tabularnewline
47 & -0.156274 & -1.3352 & 0.092979 \tabularnewline
48 & -0.146207 & -1.2492 & 0.107793 \tabularnewline
\hline
\end{tabular}
%Source: https://freestatistics.org/blog/index.php?pk=120549&T=1

[TABLE]
[ROW][C]Autocorrelation Function[/C][/ROW]
[ROW][C]Time lag k[/C][C]ACF(k)[/C][C]T-STAT[/C][C]P-value[/C][/ROW]
[ROW][C]1[/C][C]0.951572[/C][C]8.1302[/C][C]0[/C][/ROW]
[ROW][C]2[/C][C]0.874056[/C][C]7.4679[/C][C]0[/C][/ROW]
[ROW][C]3[/C][C]0.79611[/C][C]6.802[/C][C]0[/C][/ROW]
[ROW][C]4[/C][C]0.725202[/C][C]6.1961[/C][C]0[/C][/ROW]
[ROW][C]5[/C][C]0.654471[/C][C]5.5918[/C][C]0[/C][/ROW]
[ROW][C]6[/C][C]0.589471[/C][C]5.0364[/C][C]2e-06[/C][/ROW]
[ROW][C]7[/C][C]0.535712[/C][C]4.5771[/C][C]9e-06[/C][/ROW]
[ROW][C]8[/C][C]0.487732[/C][C]4.1672[/C][C]4.2e-05[/C][/ROW]
[ROW][C]9[/C][C]0.43556[/C][C]3.7214[/C][C]0.000193[/C][/ROW]
[ROW][C]10[/C][C]0.375588[/C][C]3.209[/C][C]0.00099[/C][/ROW]
[ROW][C]11[/C][C]0.310024[/C][C]2.6488[/C][C]0.004947[/C][/ROW]
[ROW][C]12[/C][C]0.245844[/C][C]2.1005[/C][C]0.01957[/C][/ROW]
[ROW][C]13[/C][C]0.182741[/C][C]1.5613[/C][C]0.061385[/C][/ROW]
[ROW][C]14[/C][C]0.117624[/C][C]1.005[/C][C]0.159112[/C][/ROW]
[ROW][C]15[/C][C]0.062031[/C][C]0.53[/C][C]0.298862[/C][/ROW]
[ROW][C]16[/C][C]0.0051[/C][C]0.0436[/C][C]0.482681[/C][/ROW]
[ROW][C]17[/C][C]-0.047495[/C][C]-0.4058[/C][C]0.343041[/C][/ROW]
[ROW][C]18[/C][C]-0.097011[/C][C]-0.8289[/C][C]0.204941[/C][/ROW]
[ROW][C]19[/C][C]-0.144684[/C][C]-1.2362[/C][C]0.110178[/C][/ROW]
[ROW][C]20[/C][C]-0.185055[/C][C]-1.5811[/C][C]0.059088[/C][/ROW]
[ROW][C]21[/C][C]-0.226681[/C][C]-1.9368[/C][C]0.028322[/C][/ROW]
[ROW][C]22[/C][C]-0.265862[/C][C]-2.2715[/C][C]0.013032[/C][/ROW]
[ROW][C]23[/C][C]-0.293966[/C][C]-2.5116[/C][C]0.007114[/C][/ROW]
[ROW][C]24[/C][C]-0.307371[/C][C]-2.6262[/C][C]0.005257[/C][/ROW]
[ROW][C]25[/C][C]-0.310816[/C][C]-2.6556[/C][C]0.004857[/C][/ROW]
[ROW][C]26[/C][C]-0.316005[/C][C]-2.7[/C][C]0.004307[/C][/ROW]
[ROW][C]27[/C][C]-0.320592[/C][C]-2.7391[/C][C]0.003868[/C][/ROW]
[ROW][C]28[/C][C]-0.330955[/C][C]-2.8277[/C][C]0.003024[/C][/ROW]
[ROW][C]29[/C][C]-0.338525[/C][C]-2.8924[/C][C]0.002518[/C][/ROW]
[ROW][C]30[/C][C]-0.335772[/C][C]-2.8688[/C][C]0.002692[/C][/ROW]
[ROW][C]31[/C][C]-0.324877[/C][C]-2.7757[/C][C]0.003496[/C][/ROW]
[ROW][C]32[/C][C]-0.311265[/C][C]-2.6595[/C][C]0.004807[/C][/ROW]
[ROW][C]33[/C][C]-0.302292[/C][C]-2.5828[/C][C]0.005902[/C][/ROW]
[ROW][C]34[/C][C]-0.304388[/C][C]-2.6007[/C][C]0.005628[/C][/ROW]
[ROW][C]35[/C][C]-0.314942[/C][C]-2.6909[/C][C]0.004415[/C][/ROW]
[ROW][C]36[/C][C]-0.325485[/C][C]-2.7809[/C][C]0.003446[/C][/ROW]
[ROW][C]37[/C][C]-0.327465[/C][C]-2.7979[/C][C]0.003287[/C][/ROW]
[ROW][C]38[/C][C]-0.322638[/C][C]-2.7566[/C][C]0.003686[/C][/ROW]
[ROW][C]39[/C][C]-0.312836[/C][C]-2.6729[/C][C]0.004636[/C][/ROW]
[ROW][C]40[/C][C]-0.292459[/C][C]-2.4988[/C][C]0.007356[/C][/ROW]
[ROW][C]41[/C][C]-0.265247[/C][C]-2.2663[/C][C]0.0132[/C][/ROW]
[ROW][C]42[/C][C]-0.234444[/C][C]-2.0031[/C][C]0.02444[/C][/ROW]
[ROW][C]43[/C][C]-0.208192[/C][C]-1.7788[/C][C]0.039719[/C][/ROW]
[ROW][C]44[/C][C]-0.187842[/C][C]-1.6049[/C][C]0.056415[/C][/ROW]
[ROW][C]45[/C][C]-0.17457[/C][C]-1.4915[/C][C]0.070066[/C][/ROW]
[ROW][C]46[/C][C]-0.167204[/C][C]-1.4286[/C][C]0.078693[/C][/ROW]
[ROW][C]47[/C][C]-0.156274[/C][C]-1.3352[/C][C]0.092979[/C][/ROW]
[ROW][C]48[/C][C]-0.146207[/C][C]-1.2492[/C][C]0.107793[/C][/ROW]
[/TABLE]
Source: https://freestatistics.org/blog/index.php?pk=120549&T=1

Globally Unique Identifier (entire table): ba.freestatistics.org/blog/index.php?pk=120549&T=1

As an alternative you can also use a QR Code:  

The GUIDs for individual cells are displayed in the table below:

Autocorrelation Function
Time lag kACF(k)T-STATP-value
10.9515728.13020
20.8740567.46790
30.796116.8020
40.7252026.19610
50.6544715.59180
60.5894715.03642e-06
70.5357124.57719e-06
80.4877324.16724.2e-05
90.435563.72140.000193
100.3755883.2090.00099
110.3100242.64880.004947
120.2458442.10050.01957
130.1827411.56130.061385
140.1176241.0050.159112
150.0620310.530.298862
160.00510.04360.482681
17-0.047495-0.40580.343041
18-0.097011-0.82890.204941
19-0.144684-1.23620.110178
20-0.185055-1.58110.059088
21-0.226681-1.93680.028322
22-0.265862-2.27150.013032
23-0.293966-2.51160.007114
24-0.307371-2.62620.005257
25-0.310816-2.65560.004857
26-0.316005-2.70.004307
27-0.320592-2.73910.003868
28-0.330955-2.82770.003024
29-0.338525-2.89240.002518
30-0.335772-2.86880.002692
31-0.324877-2.77570.003496
32-0.311265-2.65950.004807
33-0.302292-2.58280.005902
34-0.304388-2.60070.005628
35-0.314942-2.69090.004415
36-0.325485-2.78090.003446
37-0.327465-2.79790.003287
38-0.322638-2.75660.003686
39-0.312836-2.67290.004636
40-0.292459-2.49880.007356
41-0.265247-2.26630.0132
42-0.234444-2.00310.02444
43-0.208192-1.77880.039719
44-0.187842-1.60490.056415
45-0.17457-1.49150.070066
46-0.167204-1.42860.078693
47-0.156274-1.33520.092979
48-0.146207-1.24920.107793


Partial Autocorrelation Function
Time lag kPACF(k)T-STATP-value
10.9515728.13020
2-0.332581-2.84160.002908
30.0504580.43110.333828
40.0112440.09610.461866
5-0.082231-0.70260.242276
60.0441680.37740.353496
70.0504570.43110.333833
8-0.038348-0.32760.37206
9-0.087478-0.74740.228608
10-0.083335-0.7120.239362
11-0.07156-0.61140.271414
12-0.008074-0.0690.472597
13-0.050662-0.43290.333196
14-0.080512-0.68790.24685
150.0708340.60520.27346
16-0.167266-1.42910.078617
170.0295620.25260.400654
18-0.032894-0.2810.389735
19-0.066626-0.56930.285467
200.0546150.46660.321078
21-0.125279-1.07040.143986
220.0018450.01580.493732
230.0742050.6340.26403
240.0364820.31170.378076
250.016030.1370.445718
26-0.069217-0.59140.278042
27-0.004782-0.04090.48376
28-0.134476-1.1490.12716
290.0971630.83020.204578
300.0478990.40930.341776
310.021660.18510.426848
32-0.035627-0.30440.380846
33-0.144969-1.23860.109727
34-0.104046-0.8890.188469
35-0.107816-0.92120.179994
360.0512340.43770.331433
370.0691430.59080.278253
38-0.028208-0.2410.405113
39-0.011367-0.09710.461449
400.0068630.05860.476699
410.0333550.2850.388231
420.0074580.06370.474684
430.0148790.12710.449594
44-0.038617-0.32990.371193
45-0.098684-0.84320.200947
46-0.006943-0.05930.476429
470.0576580.49260.311876
48-0.033495-0.28620.387774

\begin{tabular}{lllllllll}
\hline
Partial Autocorrelation Function \tabularnewline
Time lag k & PACF(k) & T-STAT & P-value \tabularnewline
1 & 0.951572 & 8.1302 & 0 \tabularnewline
2 & -0.332581 & -2.8416 & 0.002908 \tabularnewline
3 & 0.050458 & 0.4311 & 0.333828 \tabularnewline
4 & 0.011244 & 0.0961 & 0.461866 \tabularnewline
5 & -0.082231 & -0.7026 & 0.242276 \tabularnewline
6 & 0.044168 & 0.3774 & 0.353496 \tabularnewline
7 & 0.050457 & 0.4311 & 0.333833 \tabularnewline
8 & -0.038348 & -0.3276 & 0.37206 \tabularnewline
9 & -0.087478 & -0.7474 & 0.228608 \tabularnewline
10 & -0.083335 & -0.712 & 0.239362 \tabularnewline
11 & -0.07156 & -0.6114 & 0.271414 \tabularnewline
12 & -0.008074 & -0.069 & 0.472597 \tabularnewline
13 & -0.050662 & -0.4329 & 0.333196 \tabularnewline
14 & -0.080512 & -0.6879 & 0.24685 \tabularnewline
15 & 0.070834 & 0.6052 & 0.27346 \tabularnewline
16 & -0.167266 & -1.4291 & 0.078617 \tabularnewline
17 & 0.029562 & 0.2526 & 0.400654 \tabularnewline
18 & -0.032894 & -0.281 & 0.389735 \tabularnewline
19 & -0.066626 & -0.5693 & 0.285467 \tabularnewline
20 & 0.054615 & 0.4666 & 0.321078 \tabularnewline
21 & -0.125279 & -1.0704 & 0.143986 \tabularnewline
22 & 0.001845 & 0.0158 & 0.493732 \tabularnewline
23 & 0.074205 & 0.634 & 0.26403 \tabularnewline
24 & 0.036482 & 0.3117 & 0.378076 \tabularnewline
25 & 0.01603 & 0.137 & 0.445718 \tabularnewline
26 & -0.069217 & -0.5914 & 0.278042 \tabularnewline
27 & -0.004782 & -0.0409 & 0.48376 \tabularnewline
28 & -0.134476 & -1.149 & 0.12716 \tabularnewline
29 & 0.097163 & 0.8302 & 0.204578 \tabularnewline
30 & 0.047899 & 0.4093 & 0.341776 \tabularnewline
31 & 0.02166 & 0.1851 & 0.426848 \tabularnewline
32 & -0.035627 & -0.3044 & 0.380846 \tabularnewline
33 & -0.144969 & -1.2386 & 0.109727 \tabularnewline
34 & -0.104046 & -0.889 & 0.188469 \tabularnewline
35 & -0.107816 & -0.9212 & 0.179994 \tabularnewline
36 & 0.051234 & 0.4377 & 0.331433 \tabularnewline
37 & 0.069143 & 0.5908 & 0.278253 \tabularnewline
38 & -0.028208 & -0.241 & 0.405113 \tabularnewline
39 & -0.011367 & -0.0971 & 0.461449 \tabularnewline
40 & 0.006863 & 0.0586 & 0.476699 \tabularnewline
41 & 0.033355 & 0.285 & 0.388231 \tabularnewline
42 & 0.007458 & 0.0637 & 0.474684 \tabularnewline
43 & 0.014879 & 0.1271 & 0.449594 \tabularnewline
44 & -0.038617 & -0.3299 & 0.371193 \tabularnewline
45 & -0.098684 & -0.8432 & 0.200947 \tabularnewline
46 & -0.006943 & -0.0593 & 0.476429 \tabularnewline
47 & 0.057658 & 0.4926 & 0.311876 \tabularnewline
48 & -0.033495 & -0.2862 & 0.387774 \tabularnewline
\hline
\end{tabular}
%Source: https://freestatistics.org/blog/index.php?pk=120549&T=2

[TABLE]
[ROW][C]Partial Autocorrelation Function[/C][/ROW]
[ROW][C]Time lag k[/C][C]PACF(k)[/C][C]T-STAT[/C][C]P-value[/C][/ROW]
[ROW][C]1[/C][C]0.951572[/C][C]8.1302[/C][C]0[/C][/ROW]
[ROW][C]2[/C][C]-0.332581[/C][C]-2.8416[/C][C]0.002908[/C][/ROW]
[ROW][C]3[/C][C]0.050458[/C][C]0.4311[/C][C]0.333828[/C][/ROW]
[ROW][C]4[/C][C]0.011244[/C][C]0.0961[/C][C]0.461866[/C][/ROW]
[ROW][C]5[/C][C]-0.082231[/C][C]-0.7026[/C][C]0.242276[/C][/ROW]
[ROW][C]6[/C][C]0.044168[/C][C]0.3774[/C][C]0.353496[/C][/ROW]
[ROW][C]7[/C][C]0.050457[/C][C]0.4311[/C][C]0.333833[/C][/ROW]
[ROW][C]8[/C][C]-0.038348[/C][C]-0.3276[/C][C]0.37206[/C][/ROW]
[ROW][C]9[/C][C]-0.087478[/C][C]-0.7474[/C][C]0.228608[/C][/ROW]
[ROW][C]10[/C][C]-0.083335[/C][C]-0.712[/C][C]0.239362[/C][/ROW]
[ROW][C]11[/C][C]-0.07156[/C][C]-0.6114[/C][C]0.271414[/C][/ROW]
[ROW][C]12[/C][C]-0.008074[/C][C]-0.069[/C][C]0.472597[/C][/ROW]
[ROW][C]13[/C][C]-0.050662[/C][C]-0.4329[/C][C]0.333196[/C][/ROW]
[ROW][C]14[/C][C]-0.080512[/C][C]-0.6879[/C][C]0.24685[/C][/ROW]
[ROW][C]15[/C][C]0.070834[/C][C]0.6052[/C][C]0.27346[/C][/ROW]
[ROW][C]16[/C][C]-0.167266[/C][C]-1.4291[/C][C]0.078617[/C][/ROW]
[ROW][C]17[/C][C]0.029562[/C][C]0.2526[/C][C]0.400654[/C][/ROW]
[ROW][C]18[/C][C]-0.032894[/C][C]-0.281[/C][C]0.389735[/C][/ROW]
[ROW][C]19[/C][C]-0.066626[/C][C]-0.5693[/C][C]0.285467[/C][/ROW]
[ROW][C]20[/C][C]0.054615[/C][C]0.4666[/C][C]0.321078[/C][/ROW]
[ROW][C]21[/C][C]-0.125279[/C][C]-1.0704[/C][C]0.143986[/C][/ROW]
[ROW][C]22[/C][C]0.001845[/C][C]0.0158[/C][C]0.493732[/C][/ROW]
[ROW][C]23[/C][C]0.074205[/C][C]0.634[/C][C]0.26403[/C][/ROW]
[ROW][C]24[/C][C]0.036482[/C][C]0.3117[/C][C]0.378076[/C][/ROW]
[ROW][C]25[/C][C]0.01603[/C][C]0.137[/C][C]0.445718[/C][/ROW]
[ROW][C]26[/C][C]-0.069217[/C][C]-0.5914[/C][C]0.278042[/C][/ROW]
[ROW][C]27[/C][C]-0.004782[/C][C]-0.0409[/C][C]0.48376[/C][/ROW]
[ROW][C]28[/C][C]-0.134476[/C][C]-1.149[/C][C]0.12716[/C][/ROW]
[ROW][C]29[/C][C]0.097163[/C][C]0.8302[/C][C]0.204578[/C][/ROW]
[ROW][C]30[/C][C]0.047899[/C][C]0.4093[/C][C]0.341776[/C][/ROW]
[ROW][C]31[/C][C]0.02166[/C][C]0.1851[/C][C]0.426848[/C][/ROW]
[ROW][C]32[/C][C]-0.035627[/C][C]-0.3044[/C][C]0.380846[/C][/ROW]
[ROW][C]33[/C][C]-0.144969[/C][C]-1.2386[/C][C]0.109727[/C][/ROW]
[ROW][C]34[/C][C]-0.104046[/C][C]-0.889[/C][C]0.188469[/C][/ROW]
[ROW][C]35[/C][C]-0.107816[/C][C]-0.9212[/C][C]0.179994[/C][/ROW]
[ROW][C]36[/C][C]0.051234[/C][C]0.4377[/C][C]0.331433[/C][/ROW]
[ROW][C]37[/C][C]0.069143[/C][C]0.5908[/C][C]0.278253[/C][/ROW]
[ROW][C]38[/C][C]-0.028208[/C][C]-0.241[/C][C]0.405113[/C][/ROW]
[ROW][C]39[/C][C]-0.011367[/C][C]-0.0971[/C][C]0.461449[/C][/ROW]
[ROW][C]40[/C][C]0.006863[/C][C]0.0586[/C][C]0.476699[/C][/ROW]
[ROW][C]41[/C][C]0.033355[/C][C]0.285[/C][C]0.388231[/C][/ROW]
[ROW][C]42[/C][C]0.007458[/C][C]0.0637[/C][C]0.474684[/C][/ROW]
[ROW][C]43[/C][C]0.014879[/C][C]0.1271[/C][C]0.449594[/C][/ROW]
[ROW][C]44[/C][C]-0.038617[/C][C]-0.3299[/C][C]0.371193[/C][/ROW]
[ROW][C]45[/C][C]-0.098684[/C][C]-0.8432[/C][C]0.200947[/C][/ROW]
[ROW][C]46[/C][C]-0.006943[/C][C]-0.0593[/C][C]0.476429[/C][/ROW]
[ROW][C]47[/C][C]0.057658[/C][C]0.4926[/C][C]0.311876[/C][/ROW]
[ROW][C]48[/C][C]-0.033495[/C][C]-0.2862[/C][C]0.387774[/C][/ROW]
[/TABLE]
Source: https://freestatistics.org/blog/index.php?pk=120549&T=2

Globally Unique Identifier (entire table): ba.freestatistics.org/blog/index.php?pk=120549&T=2

As an alternative you can also use a QR Code:  

The GUIDs for individual cells are displayed in the table below:

Partial Autocorrelation Function
Time lag kPACF(k)T-STATP-value
10.9515728.13020
2-0.332581-2.84160.002908
30.0504580.43110.333828
40.0112440.09610.461866
5-0.082231-0.70260.242276
60.0441680.37740.353496
70.0504570.43110.333833
8-0.038348-0.32760.37206
9-0.087478-0.74740.228608
10-0.083335-0.7120.239362
11-0.07156-0.61140.271414
12-0.008074-0.0690.472597
13-0.050662-0.43290.333196
14-0.080512-0.68790.24685
150.0708340.60520.27346
16-0.167266-1.42910.078617
170.0295620.25260.400654
18-0.032894-0.2810.389735
19-0.066626-0.56930.285467
200.0546150.46660.321078
21-0.125279-1.07040.143986
220.0018450.01580.493732
230.0742050.6340.26403
240.0364820.31170.378076
250.016030.1370.445718
26-0.069217-0.59140.278042
27-0.004782-0.04090.48376
28-0.134476-1.1490.12716
290.0971630.83020.204578
300.0478990.40930.341776
310.021660.18510.426848
32-0.035627-0.30440.380846
33-0.144969-1.23860.109727
34-0.104046-0.8890.188469
35-0.107816-0.92120.179994
360.0512340.43770.331433
370.0691430.59080.278253
38-0.028208-0.2410.405113
39-0.011367-0.09710.461449
400.0068630.05860.476699
410.0333550.2850.388231
420.0074580.06370.474684
430.0148790.12710.449594
44-0.038617-0.32990.371193
45-0.098684-0.84320.200947
46-0.006943-0.05930.476429
470.0576580.49260.311876
48-0.033495-0.28620.387774


Parameters (Session):
par1 = 48 ; par2 = 1 ; par3 = 0 ; par4 = 0 ; par5 = 12 ; par6 = White Noise ; par7 = 0.95 ;
Parameters (R input):
par1 = 48 ; par2 = 1 ; par3 = 0 ; par4 = 0 ; par5 = 12 ; par6 = White Noise ; par7 = 0.95 ; par8 = ;
R code (references can be found in the software module):
if (par1 == 'Default') {
par1 = 10*log10(length(x))
} else {
par1 <- as.numeric(par1)
}
par2 <- as.numeric(par2)
par3 <- as.numeric(par3)
par4 <- as.numeric(par4)
par5 <- as.numeric(par5)
if (par6 == 'White Noise') par6 <- 'white' else par6 <- 'ma'
par7 <- as.numeric(par7)
if (par8 != '') par8 <- as.numeric(par8)
ox <- x
if (par8 == '') {
if (par2 == 0) {
x <- log(x)
} else {
x <- (x ^ par2 - 1) / par2
}
} else {
x <- log(x,base=par8)
}
if (par3 > 0) x <- diff(x,lag=1,difference=par3)
if (par4 > 0) x <- diff(x,lag=par5,difference=par4)
bitmap(file='picts.png')
op <- par(mfrow=c(2,1))
plot(ox,type='l',main='Original Time Series',xlab='time',ylab='value')
if (par8=='') {
mytitle <- paste('Working Time Series (lambda=',par2,', d=',par3,', D=',par4,')',sep='')
mysub <- paste('(lambda=',par2,', d=',par3,', D=',par4,', CI=', par7, ', CI type=',par6,')',sep='')
} else {
mytitle <- paste('Working Time Series (base=',par8,', d=',par3,', D=',par4,')',sep='')
mysub <- paste('(base=',par8,', d=',par3,', D=',par4,', CI=', par7, ', CI type=',par6,')',sep='')
}
plot(x,type='l', main=mytitle,xlab='time',ylab='value')
par(op)
dev.off()
bitmap(file='pic1.png')
racf <- acf(x, par1, main='Autocorrelation', xlab='time lag', ylab='ACF', ci.type=par6, ci=par7, sub=mysub)
dev.off()
bitmap(file='pic2.png')
rpacf <- pacf(x,par1,main='Partial Autocorrelation',xlab='lags',ylab='PACF',sub=mysub)
dev.off()
(myacf <- c(racf$acf))
(mypacf <- c(rpacf$acf))
lengthx <- length(x)
sqrtn <- sqrt(lengthx)
load(file='createtable')
a<-table.start()
a<-table.row.start(a)
a<-table.element(a,'Autocorrelation Function',4,TRUE)
a<-table.row.end(a)
a<-table.row.start(a)
a<-table.element(a,'Time lag k',header=TRUE)
a<-table.element(a,hyperlink('basics.htm','ACF(k)','click here for more information about the Autocorrelation Function'),header=TRUE)
a<-table.element(a,'T-STAT',header=TRUE)
a<-table.element(a,'P-value',header=TRUE)
a<-table.row.end(a)
for (i in 2:(par1+1)) {
a<-table.row.start(a)
a<-table.element(a,i-1,header=TRUE)
a<-table.element(a,round(myacf[i],6))
mytstat <- myacf[i]*sqrtn
a<-table.element(a,round(mytstat,4))
a<-table.element(a,round(1-pt(abs(mytstat),lengthx),6))
a<-table.row.end(a)
}
a<-table.end(a)
table.save(a,file='mytable.tab')
a<-table.start()
a<-table.row.start(a)
a<-table.element(a,'Partial Autocorrelation Function',4,TRUE)
a<-table.row.end(a)
a<-table.row.start(a)
a<-table.element(a,'Time lag k',header=TRUE)
a<-table.element(a,hyperlink('basics.htm','PACF(k)','click here for more information about the Partial Autocorrelation Function'),header=TRUE)
a<-table.element(a,'T-STAT',header=TRUE)
a<-table.element(a,'P-value',header=TRUE)
a<-table.row.end(a)
for (i in 1:par1) {
a<-table.row.start(a)
a<-table.element(a,i,header=TRUE)
a<-table.element(a,round(mypacf[i],6))
mytstat <- mypacf[i]*sqrtn
a<-table.element(a,round(mytstat,4))
a<-table.element(a,round(1-pt(abs(mytstat),lengthx),6))
a<-table.row.end(a)
}
a<-table.end(a)
table.save(a,file='mytable1.tab')