Free Statistics

of Irreproducible Research!

Author's title

Author*Unverified author*
R Software Modulerwasp_autocorrelation.wasp
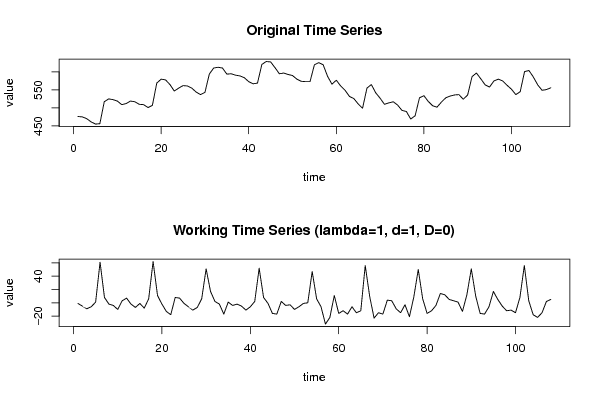
Title produced by software(Partial) Autocorrelation Function
Date of computationTue, 12 Apr 2011 15:12:23 +0000
Cite this page as followsStatistical Computations at FreeStatistics.org, Office for Research Development and Education, URL https://freestatistics.org/blog/index.php?v=date/2011/Apr/12/t1302620941wpwi91ap4vfew8t.htm/, Retrieved Thu, 09 May 2024 02:49:32 +0000
Statistical Computations at FreeStatistics.org, Office for Research Development and Education, URL https://freestatistics.org/blog/index.php?pk=120536, Retrieved Thu, 09 May 2024 02:49:32 +0000
QR Codes:

Original text written by user:
IsPrivate?No (this computation is public)
User-defined keywordsKDGP2W12
Estimated Impact129
Family? (F = Feedback message, R = changed R code, M = changed R Module, P = changed Parameters, D = changed Data)
-       [(Partial) Autocorrelation Function] [IKO opdracht 6 bi...] [2011-04-12 15:12:23] [27bda1a3a981631f705f83c894f67697] [Current]
Feedback Forum

Post a new message
Dataseries X:
476
475
470
461
455
456
517
525
523
519
509
512
519
517
510
509
501
507
569
580
578
565
547
555
562
561
555
544
537
543
594
611
613
611
594
595
591
589
584
573
567
569
621
629
628
612
595
597
593
590
580
574
573
573
620
626
620
588
566
577
561
549
532
526
511
499
555
565
542
527
510
514
517
508
493
490
469
478
528
534
518
506
502
516
528
533
536
537
524
536
587
597
581
564
558
575
580
575
563
552
537
545
601
604
586
564
549
551
556


Summary of computational transaction
Raw Inputview raw input (R code)
Raw Outputview raw output of R engine
Computing time3 seconds
R Server'George Udny Yule' @ 216.218.223.82

\begin{tabular}{lllllllll}
\hline
Summary of computational transaction \tabularnewline
Raw Input & view raw input (R code)  \tabularnewline
Raw Output & view raw output of R engine  \tabularnewline
Computing time & 3 seconds \tabularnewline
R Server & 'George Udny Yule' @ 216.218.223.82 \tabularnewline
\hline
\end{tabular}
%Source: https://freestatistics.org/blog/index.php?pk=120536&T=0

[TABLE]
[ROW][C]Summary of computational transaction[/C][/ROW]
[ROW][C]Raw Input[/C][C]view raw input (R code) [/C][/ROW]
[ROW][C]Raw Output[/C][C]view raw output of R engine [/C][/ROW]
[ROW][C]Computing time[/C][C]3 seconds[/C][/ROW]
[ROW][C]R Server[/C][C]'George Udny Yule' @ 216.218.223.82[/C][/ROW]
[/TABLE]
Source: https://freestatistics.org/blog/index.php?pk=120536&T=0

Globally Unique Identifier (entire table): ba.freestatistics.org/blog/index.php?pk=120536&T=0

As an alternative you can also use a QR Code:  

The GUIDs for individual cells are displayed in the table below:

Summary of computational transaction
Raw Inputview raw input (R code)
Raw Outputview raw output of R engine
Computing time3 seconds
R Server'George Udny Yule' @ 216.218.223.82


Autocorrelation Function
Time lag kACF(k)T-STATP-value
10.2503412.60160.00529
2-0.241394-2.50860.006803
3-0.328447-3.41330.000452
4-0.241751-2.51240.006736
50.1158581.2040.115606
60.1793581.86390.032523
70.1210521.2580.10555
8-0.200253-2.08110.019895
9-0.302185-3.14040.001088
10-0.21953-2.28140.012242
110.2300612.39090.00927
120.8052988.36890
130.1840721.91290.029203
14-0.226171-2.35040.010283
15-0.316782-3.29210.000672
16-0.221831-2.30530.011529
170.0916960.95290.171377
180.1321251.37310.086285
190.0748060.77740.21931
20-0.211556-2.19860.015021
21-0.278155-2.89070.002324
22-0.183915-1.91130.029309
230.2014062.09310.019342
240.6679336.94140
250.1341441.39410.08308
26-0.21492-2.23350.013788
27-0.287321-2.98590.001749
28-0.197902-2.05670.021065
290.0651530.67710.2499
300.0909710.94540.173283
310.0527970.54870.292176
32-0.195921-2.03610.022095
33-0.21798-2.26530.012744
34-0.129526-1.34610.090549
350.1951152.02770.022527
360.5817566.04580
370.0840040.8730.192301
38-0.199419-2.07240.020303
39-0.261433-2.71690.003838
40-0.147854-1.53650.063665
410.0819340.85150.198193
420.0796580.82780.204796
430.0441060.45840.323807
44-0.174523-1.81370.036251
45-0.180974-1.88070.031351
46-0.081884-0.8510.198336
470.15431.60350.055869
480.4689444.87342e-06

\begin{tabular}{lllllllll}
\hline
Autocorrelation Function \tabularnewline
Time lag k & ACF(k) & T-STAT & P-value \tabularnewline
1 & 0.250341 & 2.6016 & 0.00529 \tabularnewline
2 & -0.241394 & -2.5086 & 0.006803 \tabularnewline
3 & -0.328447 & -3.4133 & 0.000452 \tabularnewline
4 & -0.241751 & -2.5124 & 0.006736 \tabularnewline
5 & 0.115858 & 1.204 & 0.115606 \tabularnewline
6 & 0.179358 & 1.8639 & 0.032523 \tabularnewline
7 & 0.121052 & 1.258 & 0.10555 \tabularnewline
8 & -0.200253 & -2.0811 & 0.019895 \tabularnewline
9 & -0.302185 & -3.1404 & 0.001088 \tabularnewline
10 & -0.21953 & -2.2814 & 0.012242 \tabularnewline
11 & 0.230061 & 2.3909 & 0.00927 \tabularnewline
12 & 0.805298 & 8.3689 & 0 \tabularnewline
13 & 0.184072 & 1.9129 & 0.029203 \tabularnewline
14 & -0.226171 & -2.3504 & 0.010283 \tabularnewline
15 & -0.316782 & -3.2921 & 0.000672 \tabularnewline
16 & -0.221831 & -2.3053 & 0.011529 \tabularnewline
17 & 0.091696 & 0.9529 & 0.171377 \tabularnewline
18 & 0.132125 & 1.3731 & 0.086285 \tabularnewline
19 & 0.074806 & 0.7774 & 0.21931 \tabularnewline
20 & -0.211556 & -2.1986 & 0.015021 \tabularnewline
21 & -0.278155 & -2.8907 & 0.002324 \tabularnewline
22 & -0.183915 & -1.9113 & 0.029309 \tabularnewline
23 & 0.201406 & 2.0931 & 0.019342 \tabularnewline
24 & 0.667933 & 6.9414 & 0 \tabularnewline
25 & 0.134144 & 1.3941 & 0.08308 \tabularnewline
26 & -0.21492 & -2.2335 & 0.013788 \tabularnewline
27 & -0.287321 & -2.9859 & 0.001749 \tabularnewline
28 & -0.197902 & -2.0567 & 0.021065 \tabularnewline
29 & 0.065153 & 0.6771 & 0.2499 \tabularnewline
30 & 0.090971 & 0.9454 & 0.173283 \tabularnewline
31 & 0.052797 & 0.5487 & 0.292176 \tabularnewline
32 & -0.195921 & -2.0361 & 0.022095 \tabularnewline
33 & -0.21798 & -2.2653 & 0.012744 \tabularnewline
34 & -0.129526 & -1.3461 & 0.090549 \tabularnewline
35 & 0.195115 & 2.0277 & 0.022527 \tabularnewline
36 & 0.581756 & 6.0458 & 0 \tabularnewline
37 & 0.084004 & 0.873 & 0.192301 \tabularnewline
38 & -0.199419 & -2.0724 & 0.020303 \tabularnewline
39 & -0.261433 & -2.7169 & 0.003838 \tabularnewline
40 & -0.147854 & -1.5365 & 0.063665 \tabularnewline
41 & 0.081934 & 0.8515 & 0.198193 \tabularnewline
42 & 0.079658 & 0.8278 & 0.204796 \tabularnewline
43 & 0.044106 & 0.4584 & 0.323807 \tabularnewline
44 & -0.174523 & -1.8137 & 0.036251 \tabularnewline
45 & -0.180974 & -1.8807 & 0.031351 \tabularnewline
46 & -0.081884 & -0.851 & 0.198336 \tabularnewline
47 & 0.1543 & 1.6035 & 0.055869 \tabularnewline
48 & 0.468944 & 4.8734 & 2e-06 \tabularnewline
\hline
\end{tabular}
%Source: https://freestatistics.org/blog/index.php?pk=120536&T=1

[TABLE]
[ROW][C]Autocorrelation Function[/C][/ROW]
[ROW][C]Time lag k[/C][C]ACF(k)[/C][C]T-STAT[/C][C]P-value[/C][/ROW]
[ROW][C]1[/C][C]0.250341[/C][C]2.6016[/C][C]0.00529[/C][/ROW]
[ROW][C]2[/C][C]-0.241394[/C][C]-2.5086[/C][C]0.006803[/C][/ROW]
[ROW][C]3[/C][C]-0.328447[/C][C]-3.4133[/C][C]0.000452[/C][/ROW]
[ROW][C]4[/C][C]-0.241751[/C][C]-2.5124[/C][C]0.006736[/C][/ROW]
[ROW][C]5[/C][C]0.115858[/C][C]1.204[/C][C]0.115606[/C][/ROW]
[ROW][C]6[/C][C]0.179358[/C][C]1.8639[/C][C]0.032523[/C][/ROW]
[ROW][C]7[/C][C]0.121052[/C][C]1.258[/C][C]0.10555[/C][/ROW]
[ROW][C]8[/C][C]-0.200253[/C][C]-2.0811[/C][C]0.019895[/C][/ROW]
[ROW][C]9[/C][C]-0.302185[/C][C]-3.1404[/C][C]0.001088[/C][/ROW]
[ROW][C]10[/C][C]-0.21953[/C][C]-2.2814[/C][C]0.012242[/C][/ROW]
[ROW][C]11[/C][C]0.230061[/C][C]2.3909[/C][C]0.00927[/C][/ROW]
[ROW][C]12[/C][C]0.805298[/C][C]8.3689[/C][C]0[/C][/ROW]
[ROW][C]13[/C][C]0.184072[/C][C]1.9129[/C][C]0.029203[/C][/ROW]
[ROW][C]14[/C][C]-0.226171[/C][C]-2.3504[/C][C]0.010283[/C][/ROW]
[ROW][C]15[/C][C]-0.316782[/C][C]-3.2921[/C][C]0.000672[/C][/ROW]
[ROW][C]16[/C][C]-0.221831[/C][C]-2.3053[/C][C]0.011529[/C][/ROW]
[ROW][C]17[/C][C]0.091696[/C][C]0.9529[/C][C]0.171377[/C][/ROW]
[ROW][C]18[/C][C]0.132125[/C][C]1.3731[/C][C]0.086285[/C][/ROW]
[ROW][C]19[/C][C]0.074806[/C][C]0.7774[/C][C]0.21931[/C][/ROW]
[ROW][C]20[/C][C]-0.211556[/C][C]-2.1986[/C][C]0.015021[/C][/ROW]
[ROW][C]21[/C][C]-0.278155[/C][C]-2.8907[/C][C]0.002324[/C][/ROW]
[ROW][C]22[/C][C]-0.183915[/C][C]-1.9113[/C][C]0.029309[/C][/ROW]
[ROW][C]23[/C][C]0.201406[/C][C]2.0931[/C][C]0.019342[/C][/ROW]
[ROW][C]24[/C][C]0.667933[/C][C]6.9414[/C][C]0[/C][/ROW]
[ROW][C]25[/C][C]0.134144[/C][C]1.3941[/C][C]0.08308[/C][/ROW]
[ROW][C]26[/C][C]-0.21492[/C][C]-2.2335[/C][C]0.013788[/C][/ROW]
[ROW][C]27[/C][C]-0.287321[/C][C]-2.9859[/C][C]0.001749[/C][/ROW]
[ROW][C]28[/C][C]-0.197902[/C][C]-2.0567[/C][C]0.021065[/C][/ROW]
[ROW][C]29[/C][C]0.065153[/C][C]0.6771[/C][C]0.2499[/C][/ROW]
[ROW][C]30[/C][C]0.090971[/C][C]0.9454[/C][C]0.173283[/C][/ROW]
[ROW][C]31[/C][C]0.052797[/C][C]0.5487[/C][C]0.292176[/C][/ROW]
[ROW][C]32[/C][C]-0.195921[/C][C]-2.0361[/C][C]0.022095[/C][/ROW]
[ROW][C]33[/C][C]-0.21798[/C][C]-2.2653[/C][C]0.012744[/C][/ROW]
[ROW][C]34[/C][C]-0.129526[/C][C]-1.3461[/C][C]0.090549[/C][/ROW]
[ROW][C]35[/C][C]0.195115[/C][C]2.0277[/C][C]0.022527[/C][/ROW]
[ROW][C]36[/C][C]0.581756[/C][C]6.0458[/C][C]0[/C][/ROW]
[ROW][C]37[/C][C]0.084004[/C][C]0.873[/C][C]0.192301[/C][/ROW]
[ROW][C]38[/C][C]-0.199419[/C][C]-2.0724[/C][C]0.020303[/C][/ROW]
[ROW][C]39[/C][C]-0.261433[/C][C]-2.7169[/C][C]0.003838[/C][/ROW]
[ROW][C]40[/C][C]-0.147854[/C][C]-1.5365[/C][C]0.063665[/C][/ROW]
[ROW][C]41[/C][C]0.081934[/C][C]0.8515[/C][C]0.198193[/C][/ROW]
[ROW][C]42[/C][C]0.079658[/C][C]0.8278[/C][C]0.204796[/C][/ROW]
[ROW][C]43[/C][C]0.044106[/C][C]0.4584[/C][C]0.323807[/C][/ROW]
[ROW][C]44[/C][C]-0.174523[/C][C]-1.8137[/C][C]0.036251[/C][/ROW]
[ROW][C]45[/C][C]-0.180974[/C][C]-1.8807[/C][C]0.031351[/C][/ROW]
[ROW][C]46[/C][C]-0.081884[/C][C]-0.851[/C][C]0.198336[/C][/ROW]
[ROW][C]47[/C][C]0.1543[/C][C]1.6035[/C][C]0.055869[/C][/ROW]
[ROW][C]48[/C][C]0.468944[/C][C]4.8734[/C][C]2e-06[/C][/ROW]
[/TABLE]
Source: https://freestatistics.org/blog/index.php?pk=120536&T=1

Globally Unique Identifier (entire table): ba.freestatistics.org/blog/index.php?pk=120536&T=1

As an alternative you can also use a QR Code:  

The GUIDs for individual cells are displayed in the table below:

Autocorrelation Function
Time lag kACF(k)T-STATP-value
10.2503412.60160.00529
2-0.241394-2.50860.006803
3-0.328447-3.41330.000452
4-0.241751-2.51240.006736
50.1158581.2040.115606
60.1793581.86390.032523
70.1210521.2580.10555
8-0.200253-2.08110.019895
9-0.302185-3.14040.001088
10-0.21953-2.28140.012242
110.2300612.39090.00927
120.8052988.36890
130.1840721.91290.029203
14-0.226171-2.35040.010283
15-0.316782-3.29210.000672
16-0.221831-2.30530.011529
170.0916960.95290.171377
180.1321251.37310.086285
190.0748060.77740.21931
20-0.211556-2.19860.015021
21-0.278155-2.89070.002324
22-0.183915-1.91130.029309
230.2014062.09310.019342
240.6679336.94140
250.1341441.39410.08308
26-0.21492-2.23350.013788
27-0.287321-2.98590.001749
28-0.197902-2.05670.021065
290.0651530.67710.2499
300.0909710.94540.173283
310.0527970.54870.292176
32-0.195921-2.03610.022095
33-0.21798-2.26530.012744
34-0.129526-1.34610.090549
350.1951152.02770.022527
360.5817566.04580
370.0840040.8730.192301
38-0.199419-2.07240.020303
39-0.261433-2.71690.003838
40-0.147854-1.53650.063665
410.0819340.85150.198193
420.0796580.82780.204796
430.0441060.45840.323807
44-0.174523-1.81370.036251
45-0.180974-1.88070.031351
46-0.081884-0.8510.198336
470.15431.60350.055869
480.4689444.87342e-06


Partial Autocorrelation Function
Time lag kPACF(k)T-STATP-value
10.2503412.60160.00529
2-0.324394-3.37120.00052
3-0.199363-2.07180.020331
4-0.206788-2.1490.016934
50.110251.14580.127215
6-0.05322-0.55310.290677
70.059320.61650.269439
8-0.272325-2.83010.002775
9-0.119776-1.24480.107959
10-0.282117-2.93180.002057
110.2597872.69980.004028
120.6771327.0370
13-0.18894-1.96350.026078
140.084660.87980.190456
150.0072640.07550.469984
160.0744110.77330.220517
17-0.113637-1.18090.120109
18-0.090904-0.94470.173459
19-0.124735-1.29630.09882
20-0.12507-1.29980.098225
21-0.038362-0.39870.345462
22-0.057758-0.60020.274803
23-0.089542-0.93050.177082
240.0366720.38110.351935
25-0.040678-0.42270.336664
260.0009160.00950.496212
270.0143170.14880.441001
28-0.009057-0.09410.462594
29-0.061584-0.640.261765
30-0.043644-0.45360.325528
310.0044110.04580.481762
32-0.038277-0.39780.345787
330.0462370.48050.315919
34-0.007696-0.080.468199
350.0288140.29940.382588
360.0660560.68650.246942
37-0.062122-0.64560.259956
380.0120740.12550.450192
39-0.071289-0.74090.230194
400.0699040.72650.234564
41-0.020156-0.20950.417237
420.0085640.0890.464625
43-0.016773-0.17430.430974
440.0156160.16230.435693
45-0.045233-0.47010.319624
460.0285470.29670.383646
47-0.188298-1.95680.026473
48-0.072568-0.75410.2262

\begin{tabular}{lllllllll}
\hline
Partial Autocorrelation Function \tabularnewline
Time lag k & PACF(k) & T-STAT & P-value \tabularnewline
1 & 0.250341 & 2.6016 & 0.00529 \tabularnewline
2 & -0.324394 & -3.3712 & 0.00052 \tabularnewline
3 & -0.199363 & -2.0718 & 0.020331 \tabularnewline
4 & -0.206788 & -2.149 & 0.016934 \tabularnewline
5 & 0.11025 & 1.1458 & 0.127215 \tabularnewline
6 & -0.05322 & -0.5531 & 0.290677 \tabularnewline
7 & 0.05932 & 0.6165 & 0.269439 \tabularnewline
8 & -0.272325 & -2.8301 & 0.002775 \tabularnewline
9 & -0.119776 & -1.2448 & 0.107959 \tabularnewline
10 & -0.282117 & -2.9318 & 0.002057 \tabularnewline
11 & 0.259787 & 2.6998 & 0.004028 \tabularnewline
12 & 0.677132 & 7.037 & 0 \tabularnewline
13 & -0.18894 & -1.9635 & 0.026078 \tabularnewline
14 & 0.08466 & 0.8798 & 0.190456 \tabularnewline
15 & 0.007264 & 0.0755 & 0.469984 \tabularnewline
16 & 0.074411 & 0.7733 & 0.220517 \tabularnewline
17 & -0.113637 & -1.1809 & 0.120109 \tabularnewline
18 & -0.090904 & -0.9447 & 0.173459 \tabularnewline
19 & -0.124735 & -1.2963 & 0.09882 \tabularnewline
20 & -0.12507 & -1.2998 & 0.098225 \tabularnewline
21 & -0.038362 & -0.3987 & 0.345462 \tabularnewline
22 & -0.057758 & -0.6002 & 0.274803 \tabularnewline
23 & -0.089542 & -0.9305 & 0.177082 \tabularnewline
24 & 0.036672 & 0.3811 & 0.351935 \tabularnewline
25 & -0.040678 & -0.4227 & 0.336664 \tabularnewline
26 & 0.000916 & 0.0095 & 0.496212 \tabularnewline
27 & 0.014317 & 0.1488 & 0.441001 \tabularnewline
28 & -0.009057 & -0.0941 & 0.462594 \tabularnewline
29 & -0.061584 & -0.64 & 0.261765 \tabularnewline
30 & -0.043644 & -0.4536 & 0.325528 \tabularnewline
31 & 0.004411 & 0.0458 & 0.481762 \tabularnewline
32 & -0.038277 & -0.3978 & 0.345787 \tabularnewline
33 & 0.046237 & 0.4805 & 0.315919 \tabularnewline
34 & -0.007696 & -0.08 & 0.468199 \tabularnewline
35 & 0.028814 & 0.2994 & 0.382588 \tabularnewline
36 & 0.066056 & 0.6865 & 0.246942 \tabularnewline
37 & -0.062122 & -0.6456 & 0.259956 \tabularnewline
38 & 0.012074 & 0.1255 & 0.450192 \tabularnewline
39 & -0.071289 & -0.7409 & 0.230194 \tabularnewline
40 & 0.069904 & 0.7265 & 0.234564 \tabularnewline
41 & -0.020156 & -0.2095 & 0.417237 \tabularnewline
42 & 0.008564 & 0.089 & 0.464625 \tabularnewline
43 & -0.016773 & -0.1743 & 0.430974 \tabularnewline
44 & 0.015616 & 0.1623 & 0.435693 \tabularnewline
45 & -0.045233 & -0.4701 & 0.319624 \tabularnewline
46 & 0.028547 & 0.2967 & 0.383646 \tabularnewline
47 & -0.188298 & -1.9568 & 0.026473 \tabularnewline
48 & -0.072568 & -0.7541 & 0.2262 \tabularnewline
\hline
\end{tabular}
%Source: https://freestatistics.org/blog/index.php?pk=120536&T=2

[TABLE]
[ROW][C]Partial Autocorrelation Function[/C][/ROW]
[ROW][C]Time lag k[/C][C]PACF(k)[/C][C]T-STAT[/C][C]P-value[/C][/ROW]
[ROW][C]1[/C][C]0.250341[/C][C]2.6016[/C][C]0.00529[/C][/ROW]
[ROW][C]2[/C][C]-0.324394[/C][C]-3.3712[/C][C]0.00052[/C][/ROW]
[ROW][C]3[/C][C]-0.199363[/C][C]-2.0718[/C][C]0.020331[/C][/ROW]
[ROW][C]4[/C][C]-0.206788[/C][C]-2.149[/C][C]0.016934[/C][/ROW]
[ROW][C]5[/C][C]0.11025[/C][C]1.1458[/C][C]0.127215[/C][/ROW]
[ROW][C]6[/C][C]-0.05322[/C][C]-0.5531[/C][C]0.290677[/C][/ROW]
[ROW][C]7[/C][C]0.05932[/C][C]0.6165[/C][C]0.269439[/C][/ROW]
[ROW][C]8[/C][C]-0.272325[/C][C]-2.8301[/C][C]0.002775[/C][/ROW]
[ROW][C]9[/C][C]-0.119776[/C][C]-1.2448[/C][C]0.107959[/C][/ROW]
[ROW][C]10[/C][C]-0.282117[/C][C]-2.9318[/C][C]0.002057[/C][/ROW]
[ROW][C]11[/C][C]0.259787[/C][C]2.6998[/C][C]0.004028[/C][/ROW]
[ROW][C]12[/C][C]0.677132[/C][C]7.037[/C][C]0[/C][/ROW]
[ROW][C]13[/C][C]-0.18894[/C][C]-1.9635[/C][C]0.026078[/C][/ROW]
[ROW][C]14[/C][C]0.08466[/C][C]0.8798[/C][C]0.190456[/C][/ROW]
[ROW][C]15[/C][C]0.007264[/C][C]0.0755[/C][C]0.469984[/C][/ROW]
[ROW][C]16[/C][C]0.074411[/C][C]0.7733[/C][C]0.220517[/C][/ROW]
[ROW][C]17[/C][C]-0.113637[/C][C]-1.1809[/C][C]0.120109[/C][/ROW]
[ROW][C]18[/C][C]-0.090904[/C][C]-0.9447[/C][C]0.173459[/C][/ROW]
[ROW][C]19[/C][C]-0.124735[/C][C]-1.2963[/C][C]0.09882[/C][/ROW]
[ROW][C]20[/C][C]-0.12507[/C][C]-1.2998[/C][C]0.098225[/C][/ROW]
[ROW][C]21[/C][C]-0.038362[/C][C]-0.3987[/C][C]0.345462[/C][/ROW]
[ROW][C]22[/C][C]-0.057758[/C][C]-0.6002[/C][C]0.274803[/C][/ROW]
[ROW][C]23[/C][C]-0.089542[/C][C]-0.9305[/C][C]0.177082[/C][/ROW]
[ROW][C]24[/C][C]0.036672[/C][C]0.3811[/C][C]0.351935[/C][/ROW]
[ROW][C]25[/C][C]-0.040678[/C][C]-0.4227[/C][C]0.336664[/C][/ROW]
[ROW][C]26[/C][C]0.000916[/C][C]0.0095[/C][C]0.496212[/C][/ROW]
[ROW][C]27[/C][C]0.014317[/C][C]0.1488[/C][C]0.441001[/C][/ROW]
[ROW][C]28[/C][C]-0.009057[/C][C]-0.0941[/C][C]0.462594[/C][/ROW]
[ROW][C]29[/C][C]-0.061584[/C][C]-0.64[/C][C]0.261765[/C][/ROW]
[ROW][C]30[/C][C]-0.043644[/C][C]-0.4536[/C][C]0.325528[/C][/ROW]
[ROW][C]31[/C][C]0.004411[/C][C]0.0458[/C][C]0.481762[/C][/ROW]
[ROW][C]32[/C][C]-0.038277[/C][C]-0.3978[/C][C]0.345787[/C][/ROW]
[ROW][C]33[/C][C]0.046237[/C][C]0.4805[/C][C]0.315919[/C][/ROW]
[ROW][C]34[/C][C]-0.007696[/C][C]-0.08[/C][C]0.468199[/C][/ROW]
[ROW][C]35[/C][C]0.028814[/C][C]0.2994[/C][C]0.382588[/C][/ROW]
[ROW][C]36[/C][C]0.066056[/C][C]0.6865[/C][C]0.246942[/C][/ROW]
[ROW][C]37[/C][C]-0.062122[/C][C]-0.6456[/C][C]0.259956[/C][/ROW]
[ROW][C]38[/C][C]0.012074[/C][C]0.1255[/C][C]0.450192[/C][/ROW]
[ROW][C]39[/C][C]-0.071289[/C][C]-0.7409[/C][C]0.230194[/C][/ROW]
[ROW][C]40[/C][C]0.069904[/C][C]0.7265[/C][C]0.234564[/C][/ROW]
[ROW][C]41[/C][C]-0.020156[/C][C]-0.2095[/C][C]0.417237[/C][/ROW]
[ROW][C]42[/C][C]0.008564[/C][C]0.089[/C][C]0.464625[/C][/ROW]
[ROW][C]43[/C][C]-0.016773[/C][C]-0.1743[/C][C]0.430974[/C][/ROW]
[ROW][C]44[/C][C]0.015616[/C][C]0.1623[/C][C]0.435693[/C][/ROW]
[ROW][C]45[/C][C]-0.045233[/C][C]-0.4701[/C][C]0.319624[/C][/ROW]
[ROW][C]46[/C][C]0.028547[/C][C]0.2967[/C][C]0.383646[/C][/ROW]
[ROW][C]47[/C][C]-0.188298[/C][C]-1.9568[/C][C]0.026473[/C][/ROW]
[ROW][C]48[/C][C]-0.072568[/C][C]-0.7541[/C][C]0.2262[/C][/ROW]
[/TABLE]
Source: https://freestatistics.org/blog/index.php?pk=120536&T=2

Globally Unique Identifier (entire table): ba.freestatistics.org/blog/index.php?pk=120536&T=2

As an alternative you can also use a QR Code:  

The GUIDs for individual cells are displayed in the table below:

Partial Autocorrelation Function
Time lag kPACF(k)T-STATP-value
10.2503412.60160.00529
2-0.324394-3.37120.00052
3-0.199363-2.07180.020331
4-0.206788-2.1490.016934
50.110251.14580.127215
6-0.05322-0.55310.290677
70.059320.61650.269439
8-0.272325-2.83010.002775
9-0.119776-1.24480.107959
10-0.282117-2.93180.002057
110.2597872.69980.004028
120.6771327.0370
13-0.18894-1.96350.026078
140.084660.87980.190456
150.0072640.07550.469984
160.0744110.77330.220517
17-0.113637-1.18090.120109
18-0.090904-0.94470.173459
19-0.124735-1.29630.09882
20-0.12507-1.29980.098225
21-0.038362-0.39870.345462
22-0.057758-0.60020.274803
23-0.089542-0.93050.177082
240.0366720.38110.351935
25-0.040678-0.42270.336664
260.0009160.00950.496212
270.0143170.14880.441001
28-0.009057-0.09410.462594
29-0.061584-0.640.261765
30-0.043644-0.45360.325528
310.0044110.04580.481762
32-0.038277-0.39780.345787
330.0462370.48050.315919
34-0.007696-0.080.468199
350.0288140.29940.382588
360.0660560.68650.246942
37-0.062122-0.64560.259956
380.0120740.12550.450192
39-0.071289-0.74090.230194
400.0699040.72650.234564
41-0.020156-0.20950.417237
420.0085640.0890.464625
43-0.016773-0.17430.430974
440.0156160.16230.435693
45-0.045233-0.47010.319624
460.0285470.29670.383646
47-0.188298-1.95680.026473
48-0.072568-0.75410.2262


Parameters (Session):
par1 = 48 ; par2 = 1 ; par3 = 1 ; par4 = 0 ; par5 = 12 ; par6 = White Noise ; par7 = 0.95 ;
Parameters (R input):
par1 = 48 ; par2 = 1 ; par3 = 1 ; par4 = 0 ; par5 = 12 ; par6 = White Noise ; par7 = 0.95 ; par8 = ;
R code (references can be found in the software module):
if (par1 == 'Default') {
par1 = 10*log10(length(x))
} else {
par1 <- as.numeric(par1)
}
par2 <- as.numeric(par2)
par3 <- as.numeric(par3)
par4 <- as.numeric(par4)
par5 <- as.numeric(par5)
if (par6 == 'White Noise') par6 <- 'white' else par6 <- 'ma'
par7 <- as.numeric(par7)
if (par8 != '') par8 <- as.numeric(par8)
ox <- x
if (par8 == '') {
if (par2 == 0) {
x <- log(x)
} else {
x <- (x ^ par2 - 1) / par2
}
} else {
x <- log(x,base=par8)
}
if (par3 > 0) x <- diff(x,lag=1,difference=par3)
if (par4 > 0) x <- diff(x,lag=par5,difference=par4)
bitmap(file='picts.png')
op <- par(mfrow=c(2,1))
plot(ox,type='l',main='Original Time Series',xlab='time',ylab='value')
if (par8=='') {
mytitle <- paste('Working Time Series (lambda=',par2,', d=',par3,', D=',par4,')',sep='')
mysub <- paste('(lambda=',par2,', d=',par3,', D=',par4,', CI=', par7, ', CI type=',par6,')',sep='')
} else {
mytitle <- paste('Working Time Series (base=',par8,', d=',par3,', D=',par4,')',sep='')
mysub <- paste('(base=',par8,', d=',par3,', D=',par4,', CI=', par7, ', CI type=',par6,')',sep='')
}
plot(x,type='l', main=mytitle,xlab='time',ylab='value')
par(op)
dev.off()
bitmap(file='pic1.png')
racf <- acf(x, par1, main='Autocorrelation', xlab='time lag', ylab='ACF', ci.type=par6, ci=par7, sub=mysub)
dev.off()
bitmap(file='pic2.png')
rpacf <- pacf(x,par1,main='Partial Autocorrelation',xlab='lags',ylab='PACF',sub=mysub)
dev.off()
(myacf <- c(racf$acf))
(mypacf <- c(rpacf$acf))
lengthx <- length(x)
sqrtn <- sqrt(lengthx)
load(file='createtable')
a<-table.start()
a<-table.row.start(a)
a<-table.element(a,'Autocorrelation Function',4,TRUE)
a<-table.row.end(a)
a<-table.row.start(a)
a<-table.element(a,'Time lag k',header=TRUE)
a<-table.element(a,hyperlink('basics.htm','ACF(k)','click here for more information about the Autocorrelation Function'),header=TRUE)
a<-table.element(a,'T-STAT',header=TRUE)
a<-table.element(a,'P-value',header=TRUE)
a<-table.row.end(a)
for (i in 2:(par1+1)) {
a<-table.row.start(a)
a<-table.element(a,i-1,header=TRUE)
a<-table.element(a,round(myacf[i],6))
mytstat <- myacf[i]*sqrtn
a<-table.element(a,round(mytstat,4))
a<-table.element(a,round(1-pt(abs(mytstat),lengthx),6))
a<-table.row.end(a)
}
a<-table.end(a)
table.save(a,file='mytable.tab')
a<-table.start()
a<-table.row.start(a)
a<-table.element(a,'Partial Autocorrelation Function',4,TRUE)
a<-table.row.end(a)
a<-table.row.start(a)
a<-table.element(a,'Time lag k',header=TRUE)
a<-table.element(a,hyperlink('basics.htm','PACF(k)','click here for more information about the Partial Autocorrelation Function'),header=TRUE)
a<-table.element(a,'T-STAT',header=TRUE)
a<-table.element(a,'P-value',header=TRUE)
a<-table.row.end(a)
for (i in 1:par1) {
a<-table.row.start(a)
a<-table.element(a,i,header=TRUE)
a<-table.element(a,round(mypacf[i],6))
mytstat <- mypacf[i]*sqrtn
a<-table.element(a,round(mytstat,4))
a<-table.element(a,round(1-pt(abs(mytstat),lengthx),6))
a<-table.row.end(a)
}
a<-table.end(a)
table.save(a,file='mytable1.tab')