Free Statistics

of Irreproducible Research!

Author's title

Author*Unverified author*
R Software Modulerwasp_autocorrelation.wasp
Title produced by software(Partial) Autocorrelation Function
Date of computationTue, 12 Apr 2011 14:56:07 +0000
Cite this page as followsStatistical Computations at FreeStatistics.org, Office for Research Development and Education, URL https://freestatistics.org/blog/index.php?v=date/2011/Apr/12/t1302619981lxxwlwlgxm5ivzo.htm/, Retrieved Thu, 09 May 2024 11:44:08 +0000
Statistical Computations at FreeStatistics.org, Office for Research Development and Education, URL https://freestatistics.org/blog/index.php?pk=120534, Retrieved Thu, 09 May 2024 11:44:08 +0000
QR Codes:

Original text written by user:
IsPrivate?No (this computation is public)
User-defined keywordsKDGP2W12
Estimated Impact170
Family? (F = Feedback message, R = changed R code, M = changed R Module, P = changed Parameters, D = changed Data)
-       [(Partial) Autocorrelation Function] [] [2011-04-12 14:56:07] [e142b37b6acbb6a3ec873415888faca6] [Current]
Feedback Forum

Post a new message
Dataseries X:
116
111
104
100
93
91
119
139
134
124
113
109
109
106
101
98
93
91
122
139
140
132
117
114
113
110
107
103
98
98
137
148
147
139
130
128
127
123
118
114
108
111
151
159
158
148
138
137
136
133
126
120
114
116
153
162
161
149
139
135
130
127
122
117
112
113
149
157
157
147
137
132
125
123
117
114
111
112
144
150
149
134
123
116
117
111
105
102
95
93
124
130
124
115
106
105
105
101
95
93
84
87
116
120
117
109
105
107
109
109
108
107
99
103
131
137
135
124
118
121
121
118
113
107
100
102
130
136
133
120
112
109
110


Summary of computational transaction
Raw Inputview raw input (R code)
Raw Outputview raw output of R engine
Computing time3 seconds
R Server'Gwilym Jenkins' @ www.wessa.org

\begin{tabular}{lllllllll}
\hline
Summary of computational transaction \tabularnewline
Raw Input & view raw input (R code)  \tabularnewline
Raw Output & view raw output of R engine  \tabularnewline
Computing time & 3 seconds \tabularnewline
R Server & 'Gwilym Jenkins' @ www.wessa.org \tabularnewline
\hline
\end{tabular}
%Source: https://freestatistics.org/blog/index.php?pk=120534&T=0

[TABLE]
[ROW][C]Summary of computational transaction[/C][/ROW]
[ROW][C]Raw Input[/C][C]view raw input (R code) [/C][/ROW]
[ROW][C]Raw Output[/C][C]view raw output of R engine [/C][/ROW]
[ROW][C]Computing time[/C][C]3 seconds[/C][/ROW]
[ROW][C]R Server[/C][C]'Gwilym Jenkins' @ www.wessa.org[/C][/ROW]
[/TABLE]
Source: https://freestatistics.org/blog/index.php?pk=120534&T=0

Globally Unique Identifier (entire table): ba.freestatistics.org/blog/index.php?pk=120534&T=0

As an alternative you can also use a QR Code:  

The GUIDs for individual cells are displayed in the table below:

Summary of computational transaction
Raw Inputview raw input (R code)
Raw Outputview raw output of R engine
Computing time3 seconds
R Server'Gwilym Jenkins' @ www.wessa.org


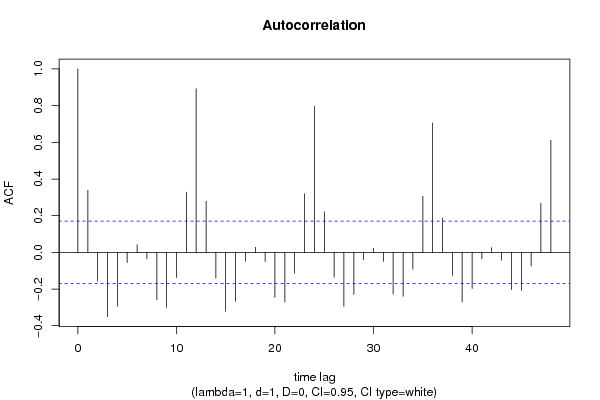
Autocorrelation Function
Time lag kACF(k)T-STATP-value
10.33863.89027.9e-05
2-0.156272-1.79540.037437
3-0.350493-4.02694.7e-05
4-0.293232-3.3690.000495
5-0.055363-0.63610.262915
60.0416720.47880.316447
7-0.034793-0.39970.344997
8-0.257968-2.96380.001803
9-0.301109-3.45950.000365
10-0.137523-1.580.058248
110.3277583.76570.000125
120.89163410.24410
130.278293.19730.000868
14-0.140626-1.61570.054277
15-0.320954-3.68750.000165
16-0.266734-3.06450.001322
17-0.047699-0.5480.292304
180.0273480.31420.37693
19-0.049643-0.57040.284704
20-0.244444-2.80840.002867
21-0.270242-3.10480.001165
22-0.113311-1.30180.097618
230.319583.67170.000174
240.7958889.14410
250.2210932.54020.006119
26-0.136045-1.5630.060219
27-0.293921-3.37690.000482
28-0.228363-2.62370.004861
29-0.040577-0.46620.320923
300.0212660.24430.403679
31-0.048643-0.55890.288602
32-0.227515-2.6140.004995
33-0.23935-2.74990.003399
34-0.092473-1.06240.14499
350.3057973.51330.000303
360.7052468.10270
370.1876652.15610.016444
38-0.126509-1.45350.074232
39-0.270352-3.10610.00116
40-0.196472-2.25730.012816
41-0.034943-0.40150.344364
420.0257040.29530.38411
43-0.04242-0.48740.313402
44-0.202626-2.3280.010716
45-0.206501-2.37250.009555
46-0.073994-0.85010.198397
470.2675423.07380.001284
480.610747.01690

\begin{tabular}{lllllllll}
\hline
Autocorrelation Function \tabularnewline
Time lag k & ACF(k) & T-STAT & P-value \tabularnewline
1 & 0.3386 & 3.8902 & 7.9e-05 \tabularnewline
2 & -0.156272 & -1.7954 & 0.037437 \tabularnewline
3 & -0.350493 & -4.0269 & 4.7e-05 \tabularnewline
4 & -0.293232 & -3.369 & 0.000495 \tabularnewline
5 & -0.055363 & -0.6361 & 0.262915 \tabularnewline
6 & 0.041672 & 0.4788 & 0.316447 \tabularnewline
7 & -0.034793 & -0.3997 & 0.344997 \tabularnewline
8 & -0.257968 & -2.9638 & 0.001803 \tabularnewline
9 & -0.301109 & -3.4595 & 0.000365 \tabularnewline
10 & -0.137523 & -1.58 & 0.058248 \tabularnewline
11 & 0.327758 & 3.7657 & 0.000125 \tabularnewline
12 & 0.891634 & 10.2441 & 0 \tabularnewline
13 & 0.27829 & 3.1973 & 0.000868 \tabularnewline
14 & -0.140626 & -1.6157 & 0.054277 \tabularnewline
15 & -0.320954 & -3.6875 & 0.000165 \tabularnewline
16 & -0.266734 & -3.0645 & 0.001322 \tabularnewline
17 & -0.047699 & -0.548 & 0.292304 \tabularnewline
18 & 0.027348 & 0.3142 & 0.37693 \tabularnewline
19 & -0.049643 & -0.5704 & 0.284704 \tabularnewline
20 & -0.244444 & -2.8084 & 0.002867 \tabularnewline
21 & -0.270242 & -3.1048 & 0.001165 \tabularnewline
22 & -0.113311 & -1.3018 & 0.097618 \tabularnewline
23 & 0.31958 & 3.6717 & 0.000174 \tabularnewline
24 & 0.795888 & 9.1441 & 0 \tabularnewline
25 & 0.221093 & 2.5402 & 0.006119 \tabularnewline
26 & -0.136045 & -1.563 & 0.060219 \tabularnewline
27 & -0.293921 & -3.3769 & 0.000482 \tabularnewline
28 & -0.228363 & -2.6237 & 0.004861 \tabularnewline
29 & -0.040577 & -0.4662 & 0.320923 \tabularnewline
30 & 0.021266 & 0.2443 & 0.403679 \tabularnewline
31 & -0.048643 & -0.5589 & 0.288602 \tabularnewline
32 & -0.227515 & -2.614 & 0.004995 \tabularnewline
33 & -0.23935 & -2.7499 & 0.003399 \tabularnewline
34 & -0.092473 & -1.0624 & 0.14499 \tabularnewline
35 & 0.305797 & 3.5133 & 0.000303 \tabularnewline
36 & 0.705246 & 8.1027 & 0 \tabularnewline
37 & 0.187665 & 2.1561 & 0.016444 \tabularnewline
38 & -0.126509 & -1.4535 & 0.074232 \tabularnewline
39 & -0.270352 & -3.1061 & 0.00116 \tabularnewline
40 & -0.196472 & -2.2573 & 0.012816 \tabularnewline
41 & -0.034943 & -0.4015 & 0.344364 \tabularnewline
42 & 0.025704 & 0.2953 & 0.38411 \tabularnewline
43 & -0.04242 & -0.4874 & 0.313402 \tabularnewline
44 & -0.202626 & -2.328 & 0.010716 \tabularnewline
45 & -0.206501 & -2.3725 & 0.009555 \tabularnewline
46 & -0.073994 & -0.8501 & 0.198397 \tabularnewline
47 & 0.267542 & 3.0738 & 0.001284 \tabularnewline
48 & 0.61074 & 7.0169 & 0 \tabularnewline
\hline
\end{tabular}
%Source: https://freestatistics.org/blog/index.php?pk=120534&T=1

[TABLE]
[ROW][C]Autocorrelation Function[/C][/ROW]
[ROW][C]Time lag k[/C][C]ACF(k)[/C][C]T-STAT[/C][C]P-value[/C][/ROW]
[ROW][C]1[/C][C]0.3386[/C][C]3.8902[/C][C]7.9e-05[/C][/ROW]
[ROW][C]2[/C][C]-0.156272[/C][C]-1.7954[/C][C]0.037437[/C][/ROW]
[ROW][C]3[/C][C]-0.350493[/C][C]-4.0269[/C][C]4.7e-05[/C][/ROW]
[ROW][C]4[/C][C]-0.293232[/C][C]-3.369[/C][C]0.000495[/C][/ROW]
[ROW][C]5[/C][C]-0.055363[/C][C]-0.6361[/C][C]0.262915[/C][/ROW]
[ROW][C]6[/C][C]0.041672[/C][C]0.4788[/C][C]0.316447[/C][/ROW]
[ROW][C]7[/C][C]-0.034793[/C][C]-0.3997[/C][C]0.344997[/C][/ROW]
[ROW][C]8[/C][C]-0.257968[/C][C]-2.9638[/C][C]0.001803[/C][/ROW]
[ROW][C]9[/C][C]-0.301109[/C][C]-3.4595[/C][C]0.000365[/C][/ROW]
[ROW][C]10[/C][C]-0.137523[/C][C]-1.58[/C][C]0.058248[/C][/ROW]
[ROW][C]11[/C][C]0.327758[/C][C]3.7657[/C][C]0.000125[/C][/ROW]
[ROW][C]12[/C][C]0.891634[/C][C]10.2441[/C][C]0[/C][/ROW]
[ROW][C]13[/C][C]0.27829[/C][C]3.1973[/C][C]0.000868[/C][/ROW]
[ROW][C]14[/C][C]-0.140626[/C][C]-1.6157[/C][C]0.054277[/C][/ROW]
[ROW][C]15[/C][C]-0.320954[/C][C]-3.6875[/C][C]0.000165[/C][/ROW]
[ROW][C]16[/C][C]-0.266734[/C][C]-3.0645[/C][C]0.001322[/C][/ROW]
[ROW][C]17[/C][C]-0.047699[/C][C]-0.548[/C][C]0.292304[/C][/ROW]
[ROW][C]18[/C][C]0.027348[/C][C]0.3142[/C][C]0.37693[/C][/ROW]
[ROW][C]19[/C][C]-0.049643[/C][C]-0.5704[/C][C]0.284704[/C][/ROW]
[ROW][C]20[/C][C]-0.244444[/C][C]-2.8084[/C][C]0.002867[/C][/ROW]
[ROW][C]21[/C][C]-0.270242[/C][C]-3.1048[/C][C]0.001165[/C][/ROW]
[ROW][C]22[/C][C]-0.113311[/C][C]-1.3018[/C][C]0.097618[/C][/ROW]
[ROW][C]23[/C][C]0.31958[/C][C]3.6717[/C][C]0.000174[/C][/ROW]
[ROW][C]24[/C][C]0.795888[/C][C]9.1441[/C][C]0[/C][/ROW]
[ROW][C]25[/C][C]0.221093[/C][C]2.5402[/C][C]0.006119[/C][/ROW]
[ROW][C]26[/C][C]-0.136045[/C][C]-1.563[/C][C]0.060219[/C][/ROW]
[ROW][C]27[/C][C]-0.293921[/C][C]-3.3769[/C][C]0.000482[/C][/ROW]
[ROW][C]28[/C][C]-0.228363[/C][C]-2.6237[/C][C]0.004861[/C][/ROW]
[ROW][C]29[/C][C]-0.040577[/C][C]-0.4662[/C][C]0.320923[/C][/ROW]
[ROW][C]30[/C][C]0.021266[/C][C]0.2443[/C][C]0.403679[/C][/ROW]
[ROW][C]31[/C][C]-0.048643[/C][C]-0.5589[/C][C]0.288602[/C][/ROW]
[ROW][C]32[/C][C]-0.227515[/C][C]-2.614[/C][C]0.004995[/C][/ROW]
[ROW][C]33[/C][C]-0.23935[/C][C]-2.7499[/C][C]0.003399[/C][/ROW]
[ROW][C]34[/C][C]-0.092473[/C][C]-1.0624[/C][C]0.14499[/C][/ROW]
[ROW][C]35[/C][C]0.305797[/C][C]3.5133[/C][C]0.000303[/C][/ROW]
[ROW][C]36[/C][C]0.705246[/C][C]8.1027[/C][C]0[/C][/ROW]
[ROW][C]37[/C][C]0.187665[/C][C]2.1561[/C][C]0.016444[/C][/ROW]
[ROW][C]38[/C][C]-0.126509[/C][C]-1.4535[/C][C]0.074232[/C][/ROW]
[ROW][C]39[/C][C]-0.270352[/C][C]-3.1061[/C][C]0.00116[/C][/ROW]
[ROW][C]40[/C][C]-0.196472[/C][C]-2.2573[/C][C]0.012816[/C][/ROW]
[ROW][C]41[/C][C]-0.034943[/C][C]-0.4015[/C][C]0.344364[/C][/ROW]
[ROW][C]42[/C][C]0.025704[/C][C]0.2953[/C][C]0.38411[/C][/ROW]
[ROW][C]43[/C][C]-0.04242[/C][C]-0.4874[/C][C]0.313402[/C][/ROW]
[ROW][C]44[/C][C]-0.202626[/C][C]-2.328[/C][C]0.010716[/C][/ROW]
[ROW][C]45[/C][C]-0.206501[/C][C]-2.3725[/C][C]0.009555[/C][/ROW]
[ROW][C]46[/C][C]-0.073994[/C][C]-0.8501[/C][C]0.198397[/C][/ROW]
[ROW][C]47[/C][C]0.267542[/C][C]3.0738[/C][C]0.001284[/C][/ROW]
[ROW][C]48[/C][C]0.61074[/C][C]7.0169[/C][C]0[/C][/ROW]
[/TABLE]
Source: https://freestatistics.org/blog/index.php?pk=120534&T=1

Globally Unique Identifier (entire table): ba.freestatistics.org/blog/index.php?pk=120534&T=1

As an alternative you can also use a QR Code:  

The GUIDs for individual cells are displayed in the table below:

Autocorrelation Function
Time lag kACF(k)T-STATP-value
10.33863.89027.9e-05
2-0.156272-1.79540.037437
3-0.350493-4.02694.7e-05
4-0.293232-3.3690.000495
5-0.055363-0.63610.262915
60.0416720.47880.316447
7-0.034793-0.39970.344997
8-0.257968-2.96380.001803
9-0.301109-3.45950.000365
10-0.137523-1.580.058248
110.3277583.76570.000125
120.89163410.24410
130.278293.19730.000868
14-0.140626-1.61570.054277
15-0.320954-3.68750.000165
16-0.266734-3.06450.001322
17-0.047699-0.5480.292304
180.0273480.31420.37693
19-0.049643-0.57040.284704
20-0.244444-2.80840.002867
21-0.270242-3.10480.001165
22-0.113311-1.30180.097618
230.319583.67170.000174
240.7958889.14410
250.2210932.54020.006119
26-0.136045-1.5630.060219
27-0.293921-3.37690.000482
28-0.228363-2.62370.004861
29-0.040577-0.46620.320923
300.0212660.24430.403679
31-0.048643-0.55890.288602
32-0.227515-2.6140.004995
33-0.23935-2.74990.003399
34-0.092473-1.06240.14499
350.3057973.51330.000303
360.7052468.10270
370.1876652.15610.016444
38-0.126509-1.45350.074232
39-0.270352-3.10610.00116
40-0.196472-2.25730.012816
41-0.034943-0.40150.344364
420.0257040.29530.38411
43-0.04242-0.48740.313402
44-0.202626-2.3280.010716
45-0.206501-2.37250.009555
46-0.073994-0.85010.198397
470.2675423.07380.001284
480.610747.01690


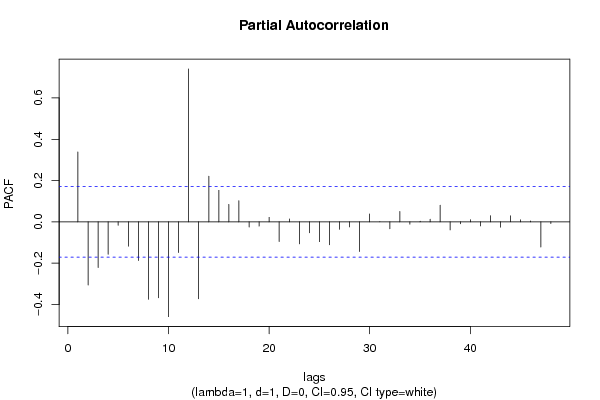
Partial Autocorrelation Function
Time lag kPACF(k)T-STATP-value
10.33863.89027.9e-05
2-0.306006-3.51570.000301
3-0.221539-2.54530.006034
4-0.156602-1.79920.037134
5-0.016807-0.19310.423591
6-0.11749-1.34990.089686
7-0.187339-2.15240.016594
8-0.375238-4.31121.6e-05
9-0.367448-4.22172.2e-05
10-0.45918-5.27560
11-0.14879-1.70950.044857
120.7405888.50870
13-0.372354-4.2781.8e-05
140.2211292.54060.006113
150.1526251.75350.040916
160.0845070.97090.166684
170.1018561.17020.122008
18-0.025287-0.29050.385937
19-0.0206-0.23670.406635
200.0216160.24830.402127
21-0.095275-1.09460.137837
220.0141010.1620.435773
23-0.106546-1.22410.111544
24-0.053215-0.61140.270996
25-0.095975-1.10270.136087
26-0.111233-1.2780.101751
27-0.036052-0.41420.3397
28-0.024306-0.27930.390242
29-0.1439-1.65330.050324
300.0376790.43290.332898
310.000210.00240.49904
32-0.033735-0.38760.349474
330.050080.57540.283007
34-0.011105-0.12760.449337
350.0026780.03080.487751
360.0122430.14070.444174
370.0804860.92470.178402
38-0.038868-0.44660.327964
39-0.009508-0.10920.456589
400.0102510.11780.453213
41-0.019617-0.22540.411013
420.0293380.33710.3683
43-0.025758-0.29590.383873
440.0288860.33190.370257
450.0096250.11060.45606
460.0043440.04990.480136
47-0.121908-1.40060.081838
48-0.007762-0.08920.464538

\begin{tabular}{lllllllll}
\hline
Partial Autocorrelation Function \tabularnewline
Time lag k & PACF(k) & T-STAT & P-value \tabularnewline
1 & 0.3386 & 3.8902 & 7.9e-05 \tabularnewline
2 & -0.306006 & -3.5157 & 0.000301 \tabularnewline
3 & -0.221539 & -2.5453 & 0.006034 \tabularnewline
4 & -0.156602 & -1.7992 & 0.037134 \tabularnewline
5 & -0.016807 & -0.1931 & 0.423591 \tabularnewline
6 & -0.11749 & -1.3499 & 0.089686 \tabularnewline
7 & -0.187339 & -2.1524 & 0.016594 \tabularnewline
8 & -0.375238 & -4.3112 & 1.6e-05 \tabularnewline
9 & -0.367448 & -4.2217 & 2.2e-05 \tabularnewline
10 & -0.45918 & -5.2756 & 0 \tabularnewline
11 & -0.14879 & -1.7095 & 0.044857 \tabularnewline
12 & 0.740588 & 8.5087 & 0 \tabularnewline
13 & -0.372354 & -4.278 & 1.8e-05 \tabularnewline
14 & 0.221129 & 2.5406 & 0.006113 \tabularnewline
15 & 0.152625 & 1.7535 & 0.040916 \tabularnewline
16 & 0.084507 & 0.9709 & 0.166684 \tabularnewline
17 & 0.101856 & 1.1702 & 0.122008 \tabularnewline
18 & -0.025287 & -0.2905 & 0.385937 \tabularnewline
19 & -0.0206 & -0.2367 & 0.406635 \tabularnewline
20 & 0.021616 & 0.2483 & 0.402127 \tabularnewline
21 & -0.095275 & -1.0946 & 0.137837 \tabularnewline
22 & 0.014101 & 0.162 & 0.435773 \tabularnewline
23 & -0.106546 & -1.2241 & 0.111544 \tabularnewline
24 & -0.053215 & -0.6114 & 0.270996 \tabularnewline
25 & -0.095975 & -1.1027 & 0.136087 \tabularnewline
26 & -0.111233 & -1.278 & 0.101751 \tabularnewline
27 & -0.036052 & -0.4142 & 0.3397 \tabularnewline
28 & -0.024306 & -0.2793 & 0.390242 \tabularnewline
29 & -0.1439 & -1.6533 & 0.050324 \tabularnewline
30 & 0.037679 & 0.4329 & 0.332898 \tabularnewline
31 & 0.00021 & 0.0024 & 0.49904 \tabularnewline
32 & -0.033735 & -0.3876 & 0.349474 \tabularnewline
33 & 0.05008 & 0.5754 & 0.283007 \tabularnewline
34 & -0.011105 & -0.1276 & 0.449337 \tabularnewline
35 & 0.002678 & 0.0308 & 0.487751 \tabularnewline
36 & 0.012243 & 0.1407 & 0.444174 \tabularnewline
37 & 0.080486 & 0.9247 & 0.178402 \tabularnewline
38 & -0.038868 & -0.4466 & 0.327964 \tabularnewline
39 & -0.009508 & -0.1092 & 0.456589 \tabularnewline
40 & 0.010251 & 0.1178 & 0.453213 \tabularnewline
41 & -0.019617 & -0.2254 & 0.411013 \tabularnewline
42 & 0.029338 & 0.3371 & 0.3683 \tabularnewline
43 & -0.025758 & -0.2959 & 0.383873 \tabularnewline
44 & 0.028886 & 0.3319 & 0.370257 \tabularnewline
45 & 0.009625 & 0.1106 & 0.45606 \tabularnewline
46 & 0.004344 & 0.0499 & 0.480136 \tabularnewline
47 & -0.121908 & -1.4006 & 0.081838 \tabularnewline
48 & -0.007762 & -0.0892 & 0.464538 \tabularnewline
\hline
\end{tabular}
%Source: https://freestatistics.org/blog/index.php?pk=120534&T=2

[TABLE]
[ROW][C]Partial Autocorrelation Function[/C][/ROW]
[ROW][C]Time lag k[/C][C]PACF(k)[/C][C]T-STAT[/C][C]P-value[/C][/ROW]
[ROW][C]1[/C][C]0.3386[/C][C]3.8902[/C][C]7.9e-05[/C][/ROW]
[ROW][C]2[/C][C]-0.306006[/C][C]-3.5157[/C][C]0.000301[/C][/ROW]
[ROW][C]3[/C][C]-0.221539[/C][C]-2.5453[/C][C]0.006034[/C][/ROW]
[ROW][C]4[/C][C]-0.156602[/C][C]-1.7992[/C][C]0.037134[/C][/ROW]
[ROW][C]5[/C][C]-0.016807[/C][C]-0.1931[/C][C]0.423591[/C][/ROW]
[ROW][C]6[/C][C]-0.11749[/C][C]-1.3499[/C][C]0.089686[/C][/ROW]
[ROW][C]7[/C][C]-0.187339[/C][C]-2.1524[/C][C]0.016594[/C][/ROW]
[ROW][C]8[/C][C]-0.375238[/C][C]-4.3112[/C][C]1.6e-05[/C][/ROW]
[ROW][C]9[/C][C]-0.367448[/C][C]-4.2217[/C][C]2.2e-05[/C][/ROW]
[ROW][C]10[/C][C]-0.45918[/C][C]-5.2756[/C][C]0[/C][/ROW]
[ROW][C]11[/C][C]-0.14879[/C][C]-1.7095[/C][C]0.044857[/C][/ROW]
[ROW][C]12[/C][C]0.740588[/C][C]8.5087[/C][C]0[/C][/ROW]
[ROW][C]13[/C][C]-0.372354[/C][C]-4.278[/C][C]1.8e-05[/C][/ROW]
[ROW][C]14[/C][C]0.221129[/C][C]2.5406[/C][C]0.006113[/C][/ROW]
[ROW][C]15[/C][C]0.152625[/C][C]1.7535[/C][C]0.040916[/C][/ROW]
[ROW][C]16[/C][C]0.084507[/C][C]0.9709[/C][C]0.166684[/C][/ROW]
[ROW][C]17[/C][C]0.101856[/C][C]1.1702[/C][C]0.122008[/C][/ROW]
[ROW][C]18[/C][C]-0.025287[/C][C]-0.2905[/C][C]0.385937[/C][/ROW]
[ROW][C]19[/C][C]-0.0206[/C][C]-0.2367[/C][C]0.406635[/C][/ROW]
[ROW][C]20[/C][C]0.021616[/C][C]0.2483[/C][C]0.402127[/C][/ROW]
[ROW][C]21[/C][C]-0.095275[/C][C]-1.0946[/C][C]0.137837[/C][/ROW]
[ROW][C]22[/C][C]0.014101[/C][C]0.162[/C][C]0.435773[/C][/ROW]
[ROW][C]23[/C][C]-0.106546[/C][C]-1.2241[/C][C]0.111544[/C][/ROW]
[ROW][C]24[/C][C]-0.053215[/C][C]-0.6114[/C][C]0.270996[/C][/ROW]
[ROW][C]25[/C][C]-0.095975[/C][C]-1.1027[/C][C]0.136087[/C][/ROW]
[ROW][C]26[/C][C]-0.111233[/C][C]-1.278[/C][C]0.101751[/C][/ROW]
[ROW][C]27[/C][C]-0.036052[/C][C]-0.4142[/C][C]0.3397[/C][/ROW]
[ROW][C]28[/C][C]-0.024306[/C][C]-0.2793[/C][C]0.390242[/C][/ROW]
[ROW][C]29[/C][C]-0.1439[/C][C]-1.6533[/C][C]0.050324[/C][/ROW]
[ROW][C]30[/C][C]0.037679[/C][C]0.4329[/C][C]0.332898[/C][/ROW]
[ROW][C]31[/C][C]0.00021[/C][C]0.0024[/C][C]0.49904[/C][/ROW]
[ROW][C]32[/C][C]-0.033735[/C][C]-0.3876[/C][C]0.349474[/C][/ROW]
[ROW][C]33[/C][C]0.05008[/C][C]0.5754[/C][C]0.283007[/C][/ROW]
[ROW][C]34[/C][C]-0.011105[/C][C]-0.1276[/C][C]0.449337[/C][/ROW]
[ROW][C]35[/C][C]0.002678[/C][C]0.0308[/C][C]0.487751[/C][/ROW]
[ROW][C]36[/C][C]0.012243[/C][C]0.1407[/C][C]0.444174[/C][/ROW]
[ROW][C]37[/C][C]0.080486[/C][C]0.9247[/C][C]0.178402[/C][/ROW]
[ROW][C]38[/C][C]-0.038868[/C][C]-0.4466[/C][C]0.327964[/C][/ROW]
[ROW][C]39[/C][C]-0.009508[/C][C]-0.1092[/C][C]0.456589[/C][/ROW]
[ROW][C]40[/C][C]0.010251[/C][C]0.1178[/C][C]0.453213[/C][/ROW]
[ROW][C]41[/C][C]-0.019617[/C][C]-0.2254[/C][C]0.411013[/C][/ROW]
[ROW][C]42[/C][C]0.029338[/C][C]0.3371[/C][C]0.3683[/C][/ROW]
[ROW][C]43[/C][C]-0.025758[/C][C]-0.2959[/C][C]0.383873[/C][/ROW]
[ROW][C]44[/C][C]0.028886[/C][C]0.3319[/C][C]0.370257[/C][/ROW]
[ROW][C]45[/C][C]0.009625[/C][C]0.1106[/C][C]0.45606[/C][/ROW]
[ROW][C]46[/C][C]0.004344[/C][C]0.0499[/C][C]0.480136[/C][/ROW]
[ROW][C]47[/C][C]-0.121908[/C][C]-1.4006[/C][C]0.081838[/C][/ROW]
[ROW][C]48[/C][C]-0.007762[/C][C]-0.0892[/C][C]0.464538[/C][/ROW]
[/TABLE]
Source: https://freestatistics.org/blog/index.php?pk=120534&T=2

Globally Unique Identifier (entire table): ba.freestatistics.org/blog/index.php?pk=120534&T=2

As an alternative you can also use a QR Code:  

The GUIDs for individual cells are displayed in the table below:

Partial Autocorrelation Function
Time lag kPACF(k)T-STATP-value
10.33863.89027.9e-05
2-0.306006-3.51570.000301
3-0.221539-2.54530.006034
4-0.156602-1.79920.037134
5-0.016807-0.19310.423591
6-0.11749-1.34990.089686
7-0.187339-2.15240.016594
8-0.375238-4.31121.6e-05
9-0.367448-4.22172.2e-05
10-0.45918-5.27560
11-0.14879-1.70950.044857
120.7405888.50870
13-0.372354-4.2781.8e-05
140.2211292.54060.006113
150.1526251.75350.040916
160.0845070.97090.166684
170.1018561.17020.122008
18-0.025287-0.29050.385937
19-0.0206-0.23670.406635
200.0216160.24830.402127
21-0.095275-1.09460.137837
220.0141010.1620.435773
23-0.106546-1.22410.111544
24-0.053215-0.61140.270996
25-0.095975-1.10270.136087
26-0.111233-1.2780.101751
27-0.036052-0.41420.3397
28-0.024306-0.27930.390242
29-0.1439-1.65330.050324
300.0376790.43290.332898
310.000210.00240.49904
32-0.033735-0.38760.349474
330.050080.57540.283007
34-0.011105-0.12760.449337
350.0026780.03080.487751
360.0122430.14070.444174
370.0804860.92470.178402
38-0.038868-0.44660.327964
39-0.009508-0.10920.456589
400.0102510.11780.453213
41-0.019617-0.22540.411013
420.0293380.33710.3683
43-0.025758-0.29590.383873
440.0288860.33190.370257
450.0096250.11060.45606
460.0043440.04990.480136
47-0.121908-1.40060.081838
48-0.007762-0.08920.464538


Parameters (Session):
par1 = 48 ; par2 = 1 ; par3 = 1 ; par4 = 0 ; par5 = 12 ; par6 = White Noise ; par7 = 0.95 ;
Parameters (R input):
par1 = 48 ; par2 = 1 ; par3 = 1 ; par4 = 0 ; par5 = 12 ; par6 = White Noise ; par7 = 0.95 ; par8 = ;
R code (references can be found in the software module):
if (par1 == 'Default') {
par1 = 10*log10(length(x))
} else {
par1 <- as.numeric(par1)
}
par2 <- as.numeric(par2)
par3 <- as.numeric(par3)
par4 <- as.numeric(par4)
par5 <- as.numeric(par5)
if (par6 == 'White Noise') par6 <- 'white' else par6 <- 'ma'
par7 <- as.numeric(par7)
if (par8 != '') par8 <- as.numeric(par8)
ox <- x
if (par8 == '') {
if (par2 == 0) {
x <- log(x)
} else {
x <- (x ^ par2 - 1) / par2
}
} else {
x <- log(x,base=par8)
}
if (par3 > 0) x <- diff(x,lag=1,difference=par3)
if (par4 > 0) x <- diff(x,lag=par5,difference=par4)
bitmap(file='picts.png')
op <- par(mfrow=c(2,1))
plot(ox,type='l',main='Original Time Series',xlab='time',ylab='value')
if (par8=='') {
mytitle <- paste('Working Time Series (lambda=',par2,', d=',par3,', D=',par4,')',sep='')
mysub <- paste('(lambda=',par2,', d=',par3,', D=',par4,', CI=', par7, ', CI type=',par6,')',sep='')
} else {
mytitle <- paste('Working Time Series (base=',par8,', d=',par3,', D=',par4,')',sep='')
mysub <- paste('(base=',par8,', d=',par3,', D=',par4,', CI=', par7, ', CI type=',par6,')',sep='')
}
plot(x,type='l', main=mytitle,xlab='time',ylab='value')
par(op)
dev.off()
bitmap(file='pic1.png')
racf <- acf(x, par1, main='Autocorrelation', xlab='time lag', ylab='ACF', ci.type=par6, ci=par7, sub=mysub)
dev.off()
bitmap(file='pic2.png')
rpacf <- pacf(x,par1,main='Partial Autocorrelation',xlab='lags',ylab='PACF',sub=mysub)
dev.off()
(myacf <- c(racf$acf))
(mypacf <- c(rpacf$acf))
lengthx <- length(x)
sqrtn <- sqrt(lengthx)
load(file='createtable')
a<-table.start()
a<-table.row.start(a)
a<-table.element(a,'Autocorrelation Function',4,TRUE)
a<-table.row.end(a)
a<-table.row.start(a)
a<-table.element(a,'Time lag k',header=TRUE)
a<-table.element(a,hyperlink('basics.htm','ACF(k)','click here for more information about the Autocorrelation Function'),header=TRUE)
a<-table.element(a,'T-STAT',header=TRUE)
a<-table.element(a,'P-value',header=TRUE)
a<-table.row.end(a)
for (i in 2:(par1+1)) {
a<-table.row.start(a)
a<-table.element(a,i-1,header=TRUE)
a<-table.element(a,round(myacf[i],6))
mytstat <- myacf[i]*sqrtn
a<-table.element(a,round(mytstat,4))
a<-table.element(a,round(1-pt(abs(mytstat),lengthx),6))
a<-table.row.end(a)
}
a<-table.end(a)
table.save(a,file='mytable.tab')
a<-table.start()
a<-table.row.start(a)
a<-table.element(a,'Partial Autocorrelation Function',4,TRUE)
a<-table.row.end(a)
a<-table.row.start(a)
a<-table.element(a,'Time lag k',header=TRUE)
a<-table.element(a,hyperlink('basics.htm','PACF(k)','click here for more information about the Partial Autocorrelation Function'),header=TRUE)
a<-table.element(a,'T-STAT',header=TRUE)
a<-table.element(a,'P-value',header=TRUE)
a<-table.row.end(a)
for (i in 1:par1) {
a<-table.row.start(a)
a<-table.element(a,i,header=TRUE)
a<-table.element(a,round(mypacf[i],6))
mytstat <- mypacf[i]*sqrtn
a<-table.element(a,round(mytstat,4))
a<-table.element(a,round(1-pt(abs(mytstat),lengthx),6))
a<-table.row.end(a)
}
a<-table.end(a)
table.save(a,file='mytable1.tab')