Free Statistics

of Irreproducible Research!

Author's title

Author*Unverified author*
R Software Modulerwasp_autocorrelation.wasp
Title produced by software(Partial) Autocorrelation Function
Date of computationTue, 12 Apr 2011 14:50:14 +0000
Cite this page as followsStatistical Computations at FreeStatistics.org, Office for Research Development and Education, URL https://freestatistics.org/blog/index.php?v=date/2011/Apr/12/t1302619630rn6h668h5rc7f0j.htm/, Retrieved Thu, 09 May 2024 12:50:06 +0000
Statistical Computations at FreeStatistics.org, Office for Research Development and Education, URL https://freestatistics.org/blog/index.php?pk=120533, Retrieved Thu, 09 May 2024 12:50:06 +0000
QR Codes:

Original text written by user:
IsPrivate?No (this computation is public)
User-defined keywordsKDGP2W12
Estimated Impact143
Family? (F = Feedback message, R = changed R code, M = changed R Module, P = changed Parameters, D = changed Data)
-       [(Partial) Autocorrelation Function] [] [2011-04-12 14:50:14] [e142b37b6acbb6a3ec873415888faca6] [Current]
Feedback Forum

Post a new message
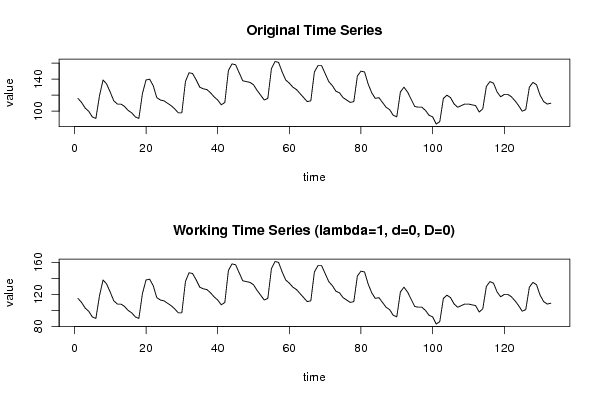
Dataseries X:
116
111
104
100
93
91
119
139
134
124
113
109
109
106
101
98
93
91
122
139
140
132
117
114
113
110
107
103
98
98
137
148
147
139
130
128
127
123
118
114
108
111
151
159
158
148
138
137
136
133
126
120
114
116
153
162
161
149
139
135
130
127
122
117
112
113
149
157
157
147
137
132
125
123
117
114
111
112
144
150
149
134
123
116
117
111
105
102
95
93
124
130
124
115
106
105
105
101
95
93
84
87
116
120
117
109
105
107
109
109
108
107
99
103
131
137
135
124
118
121
121
118
113
107
100
102
130
136
133
120
112
109
110


Summary of computational transaction
Raw Inputview raw input (R code)
Raw Outputview raw output of R engine
Computing time2 seconds
R Server'Gwilym Jenkins' @ www.wessa.org

\begin{tabular}{lllllllll}
\hline
Summary of computational transaction \tabularnewline
Raw Input & view raw input (R code)  \tabularnewline
Raw Output & view raw output of R engine  \tabularnewline
Computing time & 2 seconds \tabularnewline
R Server & 'Gwilym Jenkins' @ www.wessa.org \tabularnewline
\hline
\end{tabular}
%Source: https://freestatistics.org/blog/index.php?pk=120533&T=0

[TABLE]
[ROW][C]Summary of computational transaction[/C][/ROW]
[ROW][C]Raw Input[/C][C]view raw input (R code) [/C][/ROW]
[ROW][C]Raw Output[/C][C]view raw output of R engine [/C][/ROW]
[ROW][C]Computing time[/C][C]2 seconds[/C][/ROW]
[ROW][C]R Server[/C][C]'Gwilym Jenkins' @ www.wessa.org[/C][/ROW]
[/TABLE]
Source: https://freestatistics.org/blog/index.php?pk=120533&T=0

Globally Unique Identifier (entire table): ba.freestatistics.org/blog/index.php?pk=120533&T=0

As an alternative you can also use a QR Code:  

The GUIDs for individual cells are displayed in the table below:

Summary of computational transaction
Raw Inputview raw input (R code)
Raw Outputview raw output of R engine
Computing time2 seconds
R Server'Gwilym Jenkins' @ www.wessa.org


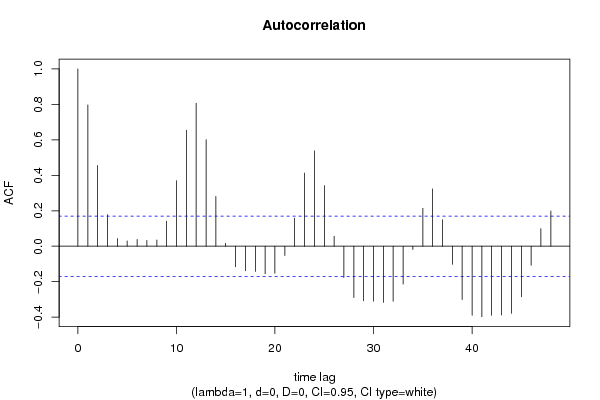
Autocorrelation Function
Time lag kACF(k)T-STATP-value
10.7965099.18580
20.4554655.25270
30.1775742.04790.02127
40.0428570.49430.310972
50.0291340.3360.368703
60.0383610.44240.32946
70.0321920.37130.355519
80.0351730.40560.342832
90.1413081.62960.052771
100.3697574.26421.9e-05
110.6541017.54350
120.8068789.30540
130.6002286.92220
140.2808623.23910.000757
150.0170580.19670.422175
16-0.115891-1.33650.09183
17-0.138836-1.60110.055859
18-0.142176-1.63970.05172
19-0.154816-1.78540.038236
20-0.152619-1.76010.040346
21-0.05261-0.60670.272534
220.157691.81860.035614
230.4124384.75653e-06
240.5380186.20470
250.3419813.94396.5e-05
260.0558180.64370.26043
27-0.176199-2.0320.022071
28-0.288904-3.33180.000559
29-0.307875-3.55060.000266
30-0.309688-3.57150.000247
31-0.317049-3.65640.000184
32-0.310877-3.58520.000236
33-0.213716-2.46470.007494
34-0.01852-0.21360.415599
350.2135512.46280.007532
360.3233413.7290.000142
370.1491031.71950.043921
38-0.101382-1.16920.122207
39-0.301051-3.47190.000349
40-0.389692-4.49418e-06
41-0.397343-4.58245e-06
42-0.389058-4.48688e-06
43-0.388513-4.48058e-06
44-0.377763-4.35661.3e-05
45-0.28484-3.28490.000652
46-0.107855-1.24380.107872
470.0986851.13810.128564
480.1985032.28920.01182

\begin{tabular}{lllllllll}
\hline
Autocorrelation Function \tabularnewline
Time lag k & ACF(k) & T-STAT & P-value \tabularnewline
1 & 0.796509 & 9.1858 & 0 \tabularnewline
2 & 0.455465 & 5.2527 & 0 \tabularnewline
3 & 0.177574 & 2.0479 & 0.02127 \tabularnewline
4 & 0.042857 & 0.4943 & 0.310972 \tabularnewline
5 & 0.029134 & 0.336 & 0.368703 \tabularnewline
6 & 0.038361 & 0.4424 & 0.32946 \tabularnewline
7 & 0.032192 & 0.3713 & 0.355519 \tabularnewline
8 & 0.035173 & 0.4056 & 0.342832 \tabularnewline
9 & 0.141308 & 1.6296 & 0.052771 \tabularnewline
10 & 0.369757 & 4.2642 & 1.9e-05 \tabularnewline
11 & 0.654101 & 7.5435 & 0 \tabularnewline
12 & 0.806878 & 9.3054 & 0 \tabularnewline
13 & 0.600228 & 6.9222 & 0 \tabularnewline
14 & 0.280862 & 3.2391 & 0.000757 \tabularnewline
15 & 0.017058 & 0.1967 & 0.422175 \tabularnewline
16 & -0.115891 & -1.3365 & 0.09183 \tabularnewline
17 & -0.138836 & -1.6011 & 0.055859 \tabularnewline
18 & -0.142176 & -1.6397 & 0.05172 \tabularnewline
19 & -0.154816 & -1.7854 & 0.038236 \tabularnewline
20 & -0.152619 & -1.7601 & 0.040346 \tabularnewline
21 & -0.05261 & -0.6067 & 0.272534 \tabularnewline
22 & 0.15769 & 1.8186 & 0.035614 \tabularnewline
23 & 0.412438 & 4.7565 & 3e-06 \tabularnewline
24 & 0.538018 & 6.2047 & 0 \tabularnewline
25 & 0.341981 & 3.9439 & 6.5e-05 \tabularnewline
26 & 0.055818 & 0.6437 & 0.26043 \tabularnewline
27 & -0.176199 & -2.032 & 0.022071 \tabularnewline
28 & -0.288904 & -3.3318 & 0.000559 \tabularnewline
29 & -0.307875 & -3.5506 & 0.000266 \tabularnewline
30 & -0.309688 & -3.5715 & 0.000247 \tabularnewline
31 & -0.317049 & -3.6564 & 0.000184 \tabularnewline
32 & -0.310877 & -3.5852 & 0.000236 \tabularnewline
33 & -0.213716 & -2.4647 & 0.007494 \tabularnewline
34 & -0.01852 & -0.2136 & 0.415599 \tabularnewline
35 & 0.213551 & 2.4628 & 0.007532 \tabularnewline
36 & 0.323341 & 3.729 & 0.000142 \tabularnewline
37 & 0.149103 & 1.7195 & 0.043921 \tabularnewline
38 & -0.101382 & -1.1692 & 0.122207 \tabularnewline
39 & -0.301051 & -3.4719 & 0.000349 \tabularnewline
40 & -0.389692 & -4.4941 & 8e-06 \tabularnewline
41 & -0.397343 & -4.5824 & 5e-06 \tabularnewline
42 & -0.389058 & -4.4868 & 8e-06 \tabularnewline
43 & -0.388513 & -4.4805 & 8e-06 \tabularnewline
44 & -0.377763 & -4.3566 & 1.3e-05 \tabularnewline
45 & -0.28484 & -3.2849 & 0.000652 \tabularnewline
46 & -0.107855 & -1.2438 & 0.107872 \tabularnewline
47 & 0.098685 & 1.1381 & 0.128564 \tabularnewline
48 & 0.198503 & 2.2892 & 0.01182 \tabularnewline
\hline
\end{tabular}
%Source: https://freestatistics.org/blog/index.php?pk=120533&T=1

[TABLE]
[ROW][C]Autocorrelation Function[/C][/ROW]
[ROW][C]Time lag k[/C][C]ACF(k)[/C][C]T-STAT[/C][C]P-value[/C][/ROW]
[ROW][C]1[/C][C]0.796509[/C][C]9.1858[/C][C]0[/C][/ROW]
[ROW][C]2[/C][C]0.455465[/C][C]5.2527[/C][C]0[/C][/ROW]
[ROW][C]3[/C][C]0.177574[/C][C]2.0479[/C][C]0.02127[/C][/ROW]
[ROW][C]4[/C][C]0.042857[/C][C]0.4943[/C][C]0.310972[/C][/ROW]
[ROW][C]5[/C][C]0.029134[/C][C]0.336[/C][C]0.368703[/C][/ROW]
[ROW][C]6[/C][C]0.038361[/C][C]0.4424[/C][C]0.32946[/C][/ROW]
[ROW][C]7[/C][C]0.032192[/C][C]0.3713[/C][C]0.355519[/C][/ROW]
[ROW][C]8[/C][C]0.035173[/C][C]0.4056[/C][C]0.342832[/C][/ROW]
[ROW][C]9[/C][C]0.141308[/C][C]1.6296[/C][C]0.052771[/C][/ROW]
[ROW][C]10[/C][C]0.369757[/C][C]4.2642[/C][C]1.9e-05[/C][/ROW]
[ROW][C]11[/C][C]0.654101[/C][C]7.5435[/C][C]0[/C][/ROW]
[ROW][C]12[/C][C]0.806878[/C][C]9.3054[/C][C]0[/C][/ROW]
[ROW][C]13[/C][C]0.600228[/C][C]6.9222[/C][C]0[/C][/ROW]
[ROW][C]14[/C][C]0.280862[/C][C]3.2391[/C][C]0.000757[/C][/ROW]
[ROW][C]15[/C][C]0.017058[/C][C]0.1967[/C][C]0.422175[/C][/ROW]
[ROW][C]16[/C][C]-0.115891[/C][C]-1.3365[/C][C]0.09183[/C][/ROW]
[ROW][C]17[/C][C]-0.138836[/C][C]-1.6011[/C][C]0.055859[/C][/ROW]
[ROW][C]18[/C][C]-0.142176[/C][C]-1.6397[/C][C]0.05172[/C][/ROW]
[ROW][C]19[/C][C]-0.154816[/C][C]-1.7854[/C][C]0.038236[/C][/ROW]
[ROW][C]20[/C][C]-0.152619[/C][C]-1.7601[/C][C]0.040346[/C][/ROW]
[ROW][C]21[/C][C]-0.05261[/C][C]-0.6067[/C][C]0.272534[/C][/ROW]
[ROW][C]22[/C][C]0.15769[/C][C]1.8186[/C][C]0.035614[/C][/ROW]
[ROW][C]23[/C][C]0.412438[/C][C]4.7565[/C][C]3e-06[/C][/ROW]
[ROW][C]24[/C][C]0.538018[/C][C]6.2047[/C][C]0[/C][/ROW]
[ROW][C]25[/C][C]0.341981[/C][C]3.9439[/C][C]6.5e-05[/C][/ROW]
[ROW][C]26[/C][C]0.055818[/C][C]0.6437[/C][C]0.26043[/C][/ROW]
[ROW][C]27[/C][C]-0.176199[/C][C]-2.032[/C][C]0.022071[/C][/ROW]
[ROW][C]28[/C][C]-0.288904[/C][C]-3.3318[/C][C]0.000559[/C][/ROW]
[ROW][C]29[/C][C]-0.307875[/C][C]-3.5506[/C][C]0.000266[/C][/ROW]
[ROW][C]30[/C][C]-0.309688[/C][C]-3.5715[/C][C]0.000247[/C][/ROW]
[ROW][C]31[/C][C]-0.317049[/C][C]-3.6564[/C][C]0.000184[/C][/ROW]
[ROW][C]32[/C][C]-0.310877[/C][C]-3.5852[/C][C]0.000236[/C][/ROW]
[ROW][C]33[/C][C]-0.213716[/C][C]-2.4647[/C][C]0.007494[/C][/ROW]
[ROW][C]34[/C][C]-0.01852[/C][C]-0.2136[/C][C]0.415599[/C][/ROW]
[ROW][C]35[/C][C]0.213551[/C][C]2.4628[/C][C]0.007532[/C][/ROW]
[ROW][C]36[/C][C]0.323341[/C][C]3.729[/C][C]0.000142[/C][/ROW]
[ROW][C]37[/C][C]0.149103[/C][C]1.7195[/C][C]0.043921[/C][/ROW]
[ROW][C]38[/C][C]-0.101382[/C][C]-1.1692[/C][C]0.122207[/C][/ROW]
[ROW][C]39[/C][C]-0.301051[/C][C]-3.4719[/C][C]0.000349[/C][/ROW]
[ROW][C]40[/C][C]-0.389692[/C][C]-4.4941[/C][C]8e-06[/C][/ROW]
[ROW][C]41[/C][C]-0.397343[/C][C]-4.5824[/C][C]5e-06[/C][/ROW]
[ROW][C]42[/C][C]-0.389058[/C][C]-4.4868[/C][C]8e-06[/C][/ROW]
[ROW][C]43[/C][C]-0.388513[/C][C]-4.4805[/C][C]8e-06[/C][/ROW]
[ROW][C]44[/C][C]-0.377763[/C][C]-4.3566[/C][C]1.3e-05[/C][/ROW]
[ROW][C]45[/C][C]-0.28484[/C][C]-3.2849[/C][C]0.000652[/C][/ROW]
[ROW][C]46[/C][C]-0.107855[/C][C]-1.2438[/C][C]0.107872[/C][/ROW]
[ROW][C]47[/C][C]0.098685[/C][C]1.1381[/C][C]0.128564[/C][/ROW]
[ROW][C]48[/C][C]0.198503[/C][C]2.2892[/C][C]0.01182[/C][/ROW]
[/TABLE]
Source: https://freestatistics.org/blog/index.php?pk=120533&T=1

Globally Unique Identifier (entire table): ba.freestatistics.org/blog/index.php?pk=120533&T=1

As an alternative you can also use a QR Code:  

The GUIDs for individual cells are displayed in the table below:

Autocorrelation Function
Time lag kACF(k)T-STATP-value
10.7965099.18580
20.4554655.25270
30.1775742.04790.02127
40.0428570.49430.310972
50.0291340.3360.368703
60.0383610.44240.32946
70.0321920.37130.355519
80.0351730.40560.342832
90.1413081.62960.052771
100.3697574.26421.9e-05
110.6541017.54350
120.8068789.30540
130.6002286.92220
140.2808623.23910.000757
150.0170580.19670.422175
16-0.115891-1.33650.09183
17-0.138836-1.60110.055859
18-0.142176-1.63970.05172
19-0.154816-1.78540.038236
20-0.152619-1.76010.040346
21-0.05261-0.60670.272534
220.157691.81860.035614
230.4124384.75653e-06
240.5380186.20470
250.3419813.94396.5e-05
260.0558180.64370.26043
27-0.176199-2.0320.022071
28-0.288904-3.33180.000559
29-0.307875-3.55060.000266
30-0.309688-3.57150.000247
31-0.317049-3.65640.000184
32-0.310877-3.58520.000236
33-0.213716-2.46470.007494
34-0.01852-0.21360.415599
350.2135512.46280.007532
360.3233413.7290.000142
370.1491031.71950.043921
38-0.101382-1.16920.122207
39-0.301051-3.47190.000349
40-0.389692-4.49418e-06
41-0.397343-4.58245e-06
42-0.389058-4.48688e-06
43-0.388513-4.48058e-06
44-0.377763-4.35661.3e-05
45-0.28484-3.28490.000652
46-0.107855-1.24380.107872
470.0986851.13810.128564
480.1985032.28920.01182


Partial Autocorrelation Function
Time lag kPACF(k)T-STATP-value
10.7965099.18580
2-0.489533-5.64560
30.0975481.1250.131311
40.0787420.90810.182736
50.0464190.53530.296657
6-0.09133-1.05330.147063
70.0221110.2550.39956
80.0870741.00420.158556
90.3372233.8897.9e-05
100.3414163.93746.6e-05
110.445165.13380
120.1380751.59240.056839
13-0.731225-8.43290
140.347944.01265e-05
15-0.224709-2.59150.005312
16-0.159998-1.84520.033618
17-0.148528-1.71290.04453
18-0.17798-2.05260.021038
190.0010830.01250.495028
20-0.023362-0.26940.39401
21-0.077732-0.89640.185817
220.0476170.54910.291915
23-0.08211-0.94690.172693
240.0648240.74760.228015
25-0.031313-0.36110.359294
260.0537790.62020.268091
270.060490.69760.24332
28-0.055258-0.63730.262522
29-0.023536-0.27140.393239
300.0837340.96570.167982
31-0.077806-0.89730.185589
32-0.0544-0.62740.265745
33-0.034508-0.3980.345647
34-0.089491-1.03210.151959
350.004890.05640.477555
36-0.044657-0.5150.3037
37-0.023361-0.26940.394016
38-0.093497-1.07830.141434
390.0239420.27610.391444
400.0363180.41880.338006
41-0.024276-0.280.389968
420.030010.34610.364912
43-0.062786-0.72410.235144
440.0120860.13940.444678
45-0.01575-0.18160.428072
46-0.083635-0.96450.168268
47-0.033199-0.38290.351213
480.0468160.53990.295081

\begin{tabular}{lllllllll}
\hline
Partial Autocorrelation Function \tabularnewline
Time lag k & PACF(k) & T-STAT & P-value \tabularnewline
1 & 0.796509 & 9.1858 & 0 \tabularnewline
2 & -0.489533 & -5.6456 & 0 \tabularnewline
3 & 0.097548 & 1.125 & 0.131311 \tabularnewline
4 & 0.078742 & 0.9081 & 0.182736 \tabularnewline
5 & 0.046419 & 0.5353 & 0.296657 \tabularnewline
6 & -0.09133 & -1.0533 & 0.147063 \tabularnewline
7 & 0.022111 & 0.255 & 0.39956 \tabularnewline
8 & 0.087074 & 1.0042 & 0.158556 \tabularnewline
9 & 0.337223 & 3.889 & 7.9e-05 \tabularnewline
10 & 0.341416 & 3.9374 & 6.6e-05 \tabularnewline
11 & 0.44516 & 5.1338 & 0 \tabularnewline
12 & 0.138075 & 1.5924 & 0.056839 \tabularnewline
13 & -0.731225 & -8.4329 & 0 \tabularnewline
14 & 0.34794 & 4.0126 & 5e-05 \tabularnewline
15 & -0.224709 & -2.5915 & 0.005312 \tabularnewline
16 & -0.159998 & -1.8452 & 0.033618 \tabularnewline
17 & -0.148528 & -1.7129 & 0.04453 \tabularnewline
18 & -0.17798 & -2.0526 & 0.021038 \tabularnewline
19 & 0.001083 & 0.0125 & 0.495028 \tabularnewline
20 & -0.023362 & -0.2694 & 0.39401 \tabularnewline
21 & -0.077732 & -0.8964 & 0.185817 \tabularnewline
22 & 0.047617 & 0.5491 & 0.291915 \tabularnewline
23 & -0.08211 & -0.9469 & 0.172693 \tabularnewline
24 & 0.064824 & 0.7476 & 0.228015 \tabularnewline
25 & -0.031313 & -0.3611 & 0.359294 \tabularnewline
26 & 0.053779 & 0.6202 & 0.268091 \tabularnewline
27 & 0.06049 & 0.6976 & 0.24332 \tabularnewline
28 & -0.055258 & -0.6373 & 0.262522 \tabularnewline
29 & -0.023536 & -0.2714 & 0.393239 \tabularnewline
30 & 0.083734 & 0.9657 & 0.167982 \tabularnewline
31 & -0.077806 & -0.8973 & 0.185589 \tabularnewline
32 & -0.0544 & -0.6274 & 0.265745 \tabularnewline
33 & -0.034508 & -0.398 & 0.345647 \tabularnewline
34 & -0.089491 & -1.0321 & 0.151959 \tabularnewline
35 & 0.00489 & 0.0564 & 0.477555 \tabularnewline
36 & -0.044657 & -0.515 & 0.3037 \tabularnewline
37 & -0.023361 & -0.2694 & 0.394016 \tabularnewline
38 & -0.093497 & -1.0783 & 0.141434 \tabularnewline
39 & 0.023942 & 0.2761 & 0.391444 \tabularnewline
40 & 0.036318 & 0.4188 & 0.338006 \tabularnewline
41 & -0.024276 & -0.28 & 0.389968 \tabularnewline
42 & 0.03001 & 0.3461 & 0.364912 \tabularnewline
43 & -0.062786 & -0.7241 & 0.235144 \tabularnewline
44 & 0.012086 & 0.1394 & 0.444678 \tabularnewline
45 & -0.01575 & -0.1816 & 0.428072 \tabularnewline
46 & -0.083635 & -0.9645 & 0.168268 \tabularnewline
47 & -0.033199 & -0.3829 & 0.351213 \tabularnewline
48 & 0.046816 & 0.5399 & 0.295081 \tabularnewline
\hline
\end{tabular}
%Source: https://freestatistics.org/blog/index.php?pk=120533&T=2

[TABLE]
[ROW][C]Partial Autocorrelation Function[/C][/ROW]
[ROW][C]Time lag k[/C][C]PACF(k)[/C][C]T-STAT[/C][C]P-value[/C][/ROW]
[ROW][C]1[/C][C]0.796509[/C][C]9.1858[/C][C]0[/C][/ROW]
[ROW][C]2[/C][C]-0.489533[/C][C]-5.6456[/C][C]0[/C][/ROW]
[ROW][C]3[/C][C]0.097548[/C][C]1.125[/C][C]0.131311[/C][/ROW]
[ROW][C]4[/C][C]0.078742[/C][C]0.9081[/C][C]0.182736[/C][/ROW]
[ROW][C]5[/C][C]0.046419[/C][C]0.5353[/C][C]0.296657[/C][/ROW]
[ROW][C]6[/C][C]-0.09133[/C][C]-1.0533[/C][C]0.147063[/C][/ROW]
[ROW][C]7[/C][C]0.022111[/C][C]0.255[/C][C]0.39956[/C][/ROW]
[ROW][C]8[/C][C]0.087074[/C][C]1.0042[/C][C]0.158556[/C][/ROW]
[ROW][C]9[/C][C]0.337223[/C][C]3.889[/C][C]7.9e-05[/C][/ROW]
[ROW][C]10[/C][C]0.341416[/C][C]3.9374[/C][C]6.6e-05[/C][/ROW]
[ROW][C]11[/C][C]0.44516[/C][C]5.1338[/C][C]0[/C][/ROW]
[ROW][C]12[/C][C]0.138075[/C][C]1.5924[/C][C]0.056839[/C][/ROW]
[ROW][C]13[/C][C]-0.731225[/C][C]-8.4329[/C][C]0[/C][/ROW]
[ROW][C]14[/C][C]0.34794[/C][C]4.0126[/C][C]5e-05[/C][/ROW]
[ROW][C]15[/C][C]-0.224709[/C][C]-2.5915[/C][C]0.005312[/C][/ROW]
[ROW][C]16[/C][C]-0.159998[/C][C]-1.8452[/C][C]0.033618[/C][/ROW]
[ROW][C]17[/C][C]-0.148528[/C][C]-1.7129[/C][C]0.04453[/C][/ROW]
[ROW][C]18[/C][C]-0.17798[/C][C]-2.0526[/C][C]0.021038[/C][/ROW]
[ROW][C]19[/C][C]0.001083[/C][C]0.0125[/C][C]0.495028[/C][/ROW]
[ROW][C]20[/C][C]-0.023362[/C][C]-0.2694[/C][C]0.39401[/C][/ROW]
[ROW][C]21[/C][C]-0.077732[/C][C]-0.8964[/C][C]0.185817[/C][/ROW]
[ROW][C]22[/C][C]0.047617[/C][C]0.5491[/C][C]0.291915[/C][/ROW]
[ROW][C]23[/C][C]-0.08211[/C][C]-0.9469[/C][C]0.172693[/C][/ROW]
[ROW][C]24[/C][C]0.064824[/C][C]0.7476[/C][C]0.228015[/C][/ROW]
[ROW][C]25[/C][C]-0.031313[/C][C]-0.3611[/C][C]0.359294[/C][/ROW]
[ROW][C]26[/C][C]0.053779[/C][C]0.6202[/C][C]0.268091[/C][/ROW]
[ROW][C]27[/C][C]0.06049[/C][C]0.6976[/C][C]0.24332[/C][/ROW]
[ROW][C]28[/C][C]-0.055258[/C][C]-0.6373[/C][C]0.262522[/C][/ROW]
[ROW][C]29[/C][C]-0.023536[/C][C]-0.2714[/C][C]0.393239[/C][/ROW]
[ROW][C]30[/C][C]0.083734[/C][C]0.9657[/C][C]0.167982[/C][/ROW]
[ROW][C]31[/C][C]-0.077806[/C][C]-0.8973[/C][C]0.185589[/C][/ROW]
[ROW][C]32[/C][C]-0.0544[/C][C]-0.6274[/C][C]0.265745[/C][/ROW]
[ROW][C]33[/C][C]-0.034508[/C][C]-0.398[/C][C]0.345647[/C][/ROW]
[ROW][C]34[/C][C]-0.089491[/C][C]-1.0321[/C][C]0.151959[/C][/ROW]
[ROW][C]35[/C][C]0.00489[/C][C]0.0564[/C][C]0.477555[/C][/ROW]
[ROW][C]36[/C][C]-0.044657[/C][C]-0.515[/C][C]0.3037[/C][/ROW]
[ROW][C]37[/C][C]-0.023361[/C][C]-0.2694[/C][C]0.394016[/C][/ROW]
[ROW][C]38[/C][C]-0.093497[/C][C]-1.0783[/C][C]0.141434[/C][/ROW]
[ROW][C]39[/C][C]0.023942[/C][C]0.2761[/C][C]0.391444[/C][/ROW]
[ROW][C]40[/C][C]0.036318[/C][C]0.4188[/C][C]0.338006[/C][/ROW]
[ROW][C]41[/C][C]-0.024276[/C][C]-0.28[/C][C]0.389968[/C][/ROW]
[ROW][C]42[/C][C]0.03001[/C][C]0.3461[/C][C]0.364912[/C][/ROW]
[ROW][C]43[/C][C]-0.062786[/C][C]-0.7241[/C][C]0.235144[/C][/ROW]
[ROW][C]44[/C][C]0.012086[/C][C]0.1394[/C][C]0.444678[/C][/ROW]
[ROW][C]45[/C][C]-0.01575[/C][C]-0.1816[/C][C]0.428072[/C][/ROW]
[ROW][C]46[/C][C]-0.083635[/C][C]-0.9645[/C][C]0.168268[/C][/ROW]
[ROW][C]47[/C][C]-0.033199[/C][C]-0.3829[/C][C]0.351213[/C][/ROW]
[ROW][C]48[/C][C]0.046816[/C][C]0.5399[/C][C]0.295081[/C][/ROW]
[/TABLE]
Source: https://freestatistics.org/blog/index.php?pk=120533&T=2

Globally Unique Identifier (entire table): ba.freestatistics.org/blog/index.php?pk=120533&T=2

As an alternative you can also use a QR Code:  

The GUIDs for individual cells are displayed in the table below:

Partial Autocorrelation Function
Time lag kPACF(k)T-STATP-value
10.7965099.18580
2-0.489533-5.64560
30.0975481.1250.131311
40.0787420.90810.182736
50.0464190.53530.296657
6-0.09133-1.05330.147063
70.0221110.2550.39956
80.0870741.00420.158556
90.3372233.8897.9e-05
100.3414163.93746.6e-05
110.445165.13380
120.1380751.59240.056839
13-0.731225-8.43290
140.347944.01265e-05
15-0.224709-2.59150.005312
16-0.159998-1.84520.033618
17-0.148528-1.71290.04453
18-0.17798-2.05260.021038
190.0010830.01250.495028
20-0.023362-0.26940.39401
21-0.077732-0.89640.185817
220.0476170.54910.291915
23-0.08211-0.94690.172693
240.0648240.74760.228015
25-0.031313-0.36110.359294
260.0537790.62020.268091
270.060490.69760.24332
28-0.055258-0.63730.262522
29-0.023536-0.27140.393239
300.0837340.96570.167982
31-0.077806-0.89730.185589
32-0.0544-0.62740.265745
33-0.034508-0.3980.345647
34-0.089491-1.03210.151959
350.004890.05640.477555
36-0.044657-0.5150.3037
37-0.023361-0.26940.394016
38-0.093497-1.07830.141434
390.0239420.27610.391444
400.0363180.41880.338006
41-0.024276-0.280.389968
420.030010.34610.364912
43-0.062786-0.72410.235144
440.0120860.13940.444678
45-0.01575-0.18160.428072
46-0.083635-0.96450.168268
47-0.033199-0.38290.351213
480.0468160.53990.295081


Parameters (Session):
par1 = 48 ; par2 = 1 ; par3 = 0 ; par4 = 0 ; par5 = 12 ; par6 = White Noise ; par7 = 0.95 ;
Parameters (R input):
par1 = 48 ; par2 = 1 ; par3 = 0 ; par4 = 0 ; par5 = 12 ; par6 = White Noise ; par7 = 0.95 ; par8 = ;
R code (references can be found in the software module):
if (par1 == 'Default') {
par1 = 10*log10(length(x))
} else {
par1 <- as.numeric(par1)
}
par2 <- as.numeric(par2)
par3 <- as.numeric(par3)
par4 <- as.numeric(par4)
par5 <- as.numeric(par5)
if (par6 == 'White Noise') par6 <- 'white' else par6 <- 'ma'
par7 <- as.numeric(par7)
if (par8 != '') par8 <- as.numeric(par8)
ox <- x
if (par8 == '') {
if (par2 == 0) {
x <- log(x)
} else {
x <- (x ^ par2 - 1) / par2
}
} else {
x <- log(x,base=par8)
}
if (par3 > 0) x <- diff(x,lag=1,difference=par3)
if (par4 > 0) x <- diff(x,lag=par5,difference=par4)
bitmap(file='picts.png')
op <- par(mfrow=c(2,1))
plot(ox,type='l',main='Original Time Series',xlab='time',ylab='value')
if (par8=='') {
mytitle <- paste('Working Time Series (lambda=',par2,', d=',par3,', D=',par4,')',sep='')
mysub <- paste('(lambda=',par2,', d=',par3,', D=',par4,', CI=', par7, ', CI type=',par6,')',sep='')
} else {
mytitle <- paste('Working Time Series (base=',par8,', d=',par3,', D=',par4,')',sep='')
mysub <- paste('(base=',par8,', d=',par3,', D=',par4,', CI=', par7, ', CI type=',par6,')',sep='')
}
plot(x,type='l', main=mytitle,xlab='time',ylab='value')
par(op)
dev.off()
bitmap(file='pic1.png')
racf <- acf(x, par1, main='Autocorrelation', xlab='time lag', ylab='ACF', ci.type=par6, ci=par7, sub=mysub)
dev.off()
bitmap(file='pic2.png')
rpacf <- pacf(x,par1,main='Partial Autocorrelation',xlab='lags',ylab='PACF',sub=mysub)
dev.off()
(myacf <- c(racf$acf))
(mypacf <- c(rpacf$acf))
lengthx <- length(x)
sqrtn <- sqrt(lengthx)
load(file='createtable')
a<-table.start()
a<-table.row.start(a)
a<-table.element(a,'Autocorrelation Function',4,TRUE)
a<-table.row.end(a)
a<-table.row.start(a)
a<-table.element(a,'Time lag k',header=TRUE)
a<-table.element(a,hyperlink('basics.htm','ACF(k)','click here for more information about the Autocorrelation Function'),header=TRUE)
a<-table.element(a,'T-STAT',header=TRUE)
a<-table.element(a,'P-value',header=TRUE)
a<-table.row.end(a)
for (i in 2:(par1+1)) {
a<-table.row.start(a)
a<-table.element(a,i-1,header=TRUE)
a<-table.element(a,round(myacf[i],6))
mytstat <- myacf[i]*sqrtn
a<-table.element(a,round(mytstat,4))
a<-table.element(a,round(1-pt(abs(mytstat),lengthx),6))
a<-table.row.end(a)
}
a<-table.end(a)
table.save(a,file='mytable.tab')
a<-table.start()
a<-table.row.start(a)
a<-table.element(a,'Partial Autocorrelation Function',4,TRUE)
a<-table.row.end(a)
a<-table.row.start(a)
a<-table.element(a,'Time lag k',header=TRUE)
a<-table.element(a,hyperlink('basics.htm','PACF(k)','click here for more information about the Partial Autocorrelation Function'),header=TRUE)
a<-table.element(a,'T-STAT',header=TRUE)
a<-table.element(a,'P-value',header=TRUE)
a<-table.row.end(a)
for (i in 1:par1) {
a<-table.row.start(a)
a<-table.element(a,i,header=TRUE)
a<-table.element(a,round(mypacf[i],6))
mytstat <- mypacf[i]*sqrtn
a<-table.element(a,round(mytstat,4))
a<-table.element(a,round(1-pt(abs(mytstat),lengthx),6))
a<-table.row.end(a)
}
a<-table.end(a)
table.save(a,file='mytable1.tab')