Free Statistics

of Irreproducible Research!

Author's title

Author*Unverified author*
R Software Modulerwasp_autocorrelation.wasp
Title produced by software(Partial) Autocorrelation Function
Date of computationTue, 12 Apr 2011 12:23:56 +0000
Cite this page as followsStatistical Computations at FreeStatistics.org, Office for Research Development and Education, URL https://freestatistics.org/blog/index.php?v=date/2011/Apr/12/t1302610830hc7x3ctwhg8nay8.htm/, Retrieved Thu, 09 May 2024 11:55:43 +0000
Statistical Computations at FreeStatistics.org, Office for Research Development and Education, URL https://freestatistics.org/blog/index.php?pk=120505, Retrieved Thu, 09 May 2024 11:55:43 +0000
QR Codes:

Original text written by user:
IsPrivate?No (this computation is public)
User-defined keywordsKDGP2W12
Estimated Impact141
Family? (F = Feedback message, R = changed R code, M = changed R Module, P = changed Parameters, D = changed Data)
-       [(Partial) Autocorrelation Function] [Werkloosheid 2002...] [2011-04-12 12:23:56] [3a3658f0c037a8b0bdf60c7ef617ad7f] [Current]
Feedback Forum

Post a new message
Dataseries X:
476
475
470
461
455
456
517
525
523
519
509
512
519
517
510
509
501
507
569
580
578
565
547
555
562
561
555
544
537
543
594
611
613
611
594
595
591
589
584
573
567
569
621
629
628
612
595
597
593
590
580
574
573
573
620
626
620
588
566
557
561
549
532
526
511
499
555
565
542
527
510
514
517
508
493
490
469
478
528
534
518
506
502
516


Summary of computational transaction
Raw Inputview raw input (R code)
Raw Outputview raw output of R engine
Computing time3 seconds
R Server'RServer@AstonUniversity' @ vre.aston.ac.uk

\begin{tabular}{lllllllll}
\hline
Summary of computational transaction \tabularnewline
Raw Input & view raw input (R code)  \tabularnewline
Raw Output & view raw output of R engine  \tabularnewline
Computing time & 3 seconds \tabularnewline
R Server & 'RServer@AstonUniversity' @ vre.aston.ac.uk \tabularnewline
\hline
\end{tabular}
%Source: https://freestatistics.org/blog/index.php?pk=120505&T=0

[TABLE]
[ROW][C]Summary of computational transaction[/C][/ROW]
[ROW][C]Raw Input[/C][C]view raw input (R code) [/C][/ROW]
[ROW][C]Raw Output[/C][C]view raw output of R engine [/C][/ROW]
[ROW][C]Computing time[/C][C]3 seconds[/C][/ROW]
[ROW][C]R Server[/C][C]'RServer@AstonUniversity' @ vre.aston.ac.uk[/C][/ROW]
[/TABLE]
Source: https://freestatistics.org/blog/index.php?pk=120505&T=0

Globally Unique Identifier (entire table): ba.freestatistics.org/blog/index.php?pk=120505&T=0

As an alternative you can also use a QR Code:  

The GUIDs for individual cells are displayed in the table below:

Summary of computational transaction
Raw Inputview raw input (R code)
Raw Outputview raw output of R engine
Computing time3 seconds
R Server'RServer@AstonUniversity' @ vre.aston.ac.uk


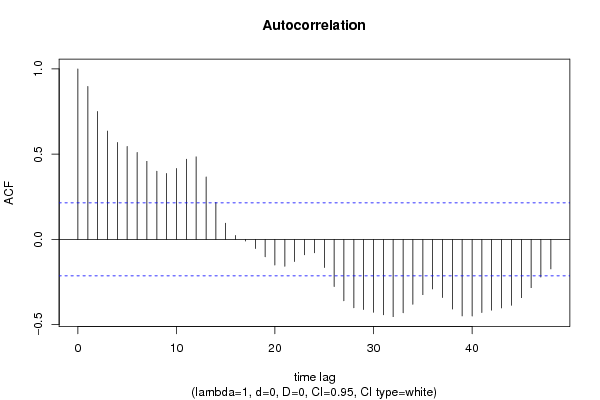
Autocorrelation Function
Time lag kACF(k)T-STATP-value
10.8975258.2260
20.750766.88080
30.6353355.82290
40.5684875.21031e-06
50.5457165.00162e-06
60.5096124.67076e-06
70.4577394.19523.4e-05
80.4004183.66990.000213
90.3866123.54340.000324
100.415883.81160.000131
110.4704314.31162.2e-05
120.4844424.441.4e-05
130.3663523.35770.000591
140.2166441.98560.025171
150.0947220.86810.193896
160.0226670.20780.417963
17-0.009782-0.08970.464389
18-0.053594-0.49120.312285
19-0.102482-0.93930.175145
20-0.150174-1.37640.086182
21-0.157821-1.44650.075885
22-0.129897-1.19050.118596
23-0.090103-0.82580.205626
24-0.078041-0.71530.238217
25-0.165603-1.51780.066413
26-0.277014-2.53890.006482
27-0.360596-3.30490.000699
28-0.401281-3.67780.000207
29-0.411682-3.77310.00015
30-0.42753-3.91849.1e-05
31-0.442572-4.05625.6e-05
32-0.453307-4.15463.9e-05
33-0.43084-3.94878.1e-05
34-0.381054-3.49240.000383
35-0.32439-2.97310.001923
36-0.290471-2.66220.004651
37-0.340704-3.12260.00123
38-0.408951-3.74810.000163
39-0.448914-4.11444.5e-05
40-0.44983-4.12284.4e-05
41-0.429186-3.93368.6e-05
42-0.415359-3.80680.000133
43-0.402048-3.68480.000202
44-0.386096-3.53860.000329
45-0.341827-3.13290.001192
46-0.283352-2.5970.005551
47-0.220983-2.02530.023004
48-0.173224-1.58760.058064

\begin{tabular}{lllllllll}
\hline
Autocorrelation Function \tabularnewline
Time lag k & ACF(k) & T-STAT & P-value \tabularnewline
1 & 0.897525 & 8.226 & 0 \tabularnewline
2 & 0.75076 & 6.8808 & 0 \tabularnewline
3 & 0.635335 & 5.8229 & 0 \tabularnewline
4 & 0.568487 & 5.2103 & 1e-06 \tabularnewline
5 & 0.545716 & 5.0016 & 2e-06 \tabularnewline
6 & 0.509612 & 4.6707 & 6e-06 \tabularnewline
7 & 0.457739 & 4.1952 & 3.4e-05 \tabularnewline
8 & 0.400418 & 3.6699 & 0.000213 \tabularnewline
9 & 0.386612 & 3.5434 & 0.000324 \tabularnewline
10 & 0.41588 & 3.8116 & 0.000131 \tabularnewline
11 & 0.470431 & 4.3116 & 2.2e-05 \tabularnewline
12 & 0.484442 & 4.44 & 1.4e-05 \tabularnewline
13 & 0.366352 & 3.3577 & 0.000591 \tabularnewline
14 & 0.216644 & 1.9856 & 0.025171 \tabularnewline
15 & 0.094722 & 0.8681 & 0.193896 \tabularnewline
16 & 0.022667 & 0.2078 & 0.417963 \tabularnewline
17 & -0.009782 & -0.0897 & 0.464389 \tabularnewline
18 & -0.053594 & -0.4912 & 0.312285 \tabularnewline
19 & -0.102482 & -0.9393 & 0.175145 \tabularnewline
20 & -0.150174 & -1.3764 & 0.086182 \tabularnewline
21 & -0.157821 & -1.4465 & 0.075885 \tabularnewline
22 & -0.129897 & -1.1905 & 0.118596 \tabularnewline
23 & -0.090103 & -0.8258 & 0.205626 \tabularnewline
24 & -0.078041 & -0.7153 & 0.238217 \tabularnewline
25 & -0.165603 & -1.5178 & 0.066413 \tabularnewline
26 & -0.277014 & -2.5389 & 0.006482 \tabularnewline
27 & -0.360596 & -3.3049 & 0.000699 \tabularnewline
28 & -0.401281 & -3.6778 & 0.000207 \tabularnewline
29 & -0.411682 & -3.7731 & 0.00015 \tabularnewline
30 & -0.42753 & -3.9184 & 9.1e-05 \tabularnewline
31 & -0.442572 & -4.0562 & 5.6e-05 \tabularnewline
32 & -0.453307 & -4.1546 & 3.9e-05 \tabularnewline
33 & -0.43084 & -3.9487 & 8.1e-05 \tabularnewline
34 & -0.381054 & -3.4924 & 0.000383 \tabularnewline
35 & -0.32439 & -2.9731 & 0.001923 \tabularnewline
36 & -0.290471 & -2.6622 & 0.004651 \tabularnewline
37 & -0.340704 & -3.1226 & 0.00123 \tabularnewline
38 & -0.408951 & -3.7481 & 0.000163 \tabularnewline
39 & -0.448914 & -4.1144 & 4.5e-05 \tabularnewline
40 & -0.44983 & -4.1228 & 4.4e-05 \tabularnewline
41 & -0.429186 & -3.9336 & 8.6e-05 \tabularnewline
42 & -0.415359 & -3.8068 & 0.000133 \tabularnewline
43 & -0.402048 & -3.6848 & 0.000202 \tabularnewline
44 & -0.386096 & -3.5386 & 0.000329 \tabularnewline
45 & -0.341827 & -3.1329 & 0.001192 \tabularnewline
46 & -0.283352 & -2.597 & 0.005551 \tabularnewline
47 & -0.220983 & -2.0253 & 0.023004 \tabularnewline
48 & -0.173224 & -1.5876 & 0.058064 \tabularnewline
\hline
\end{tabular}
%Source: https://freestatistics.org/blog/index.php?pk=120505&T=1

[TABLE]
[ROW][C]Autocorrelation Function[/C][/ROW]
[ROW][C]Time lag k[/C][C]ACF(k)[/C][C]T-STAT[/C][C]P-value[/C][/ROW]
[ROW][C]1[/C][C]0.897525[/C][C]8.226[/C][C]0[/C][/ROW]
[ROW][C]2[/C][C]0.75076[/C][C]6.8808[/C][C]0[/C][/ROW]
[ROW][C]3[/C][C]0.635335[/C][C]5.8229[/C][C]0[/C][/ROW]
[ROW][C]4[/C][C]0.568487[/C][C]5.2103[/C][C]1e-06[/C][/ROW]
[ROW][C]5[/C][C]0.545716[/C][C]5.0016[/C][C]2e-06[/C][/ROW]
[ROW][C]6[/C][C]0.509612[/C][C]4.6707[/C][C]6e-06[/C][/ROW]
[ROW][C]7[/C][C]0.457739[/C][C]4.1952[/C][C]3.4e-05[/C][/ROW]
[ROW][C]8[/C][C]0.400418[/C][C]3.6699[/C][C]0.000213[/C][/ROW]
[ROW][C]9[/C][C]0.386612[/C][C]3.5434[/C][C]0.000324[/C][/ROW]
[ROW][C]10[/C][C]0.41588[/C][C]3.8116[/C][C]0.000131[/C][/ROW]
[ROW][C]11[/C][C]0.470431[/C][C]4.3116[/C][C]2.2e-05[/C][/ROW]
[ROW][C]12[/C][C]0.484442[/C][C]4.44[/C][C]1.4e-05[/C][/ROW]
[ROW][C]13[/C][C]0.366352[/C][C]3.3577[/C][C]0.000591[/C][/ROW]
[ROW][C]14[/C][C]0.216644[/C][C]1.9856[/C][C]0.025171[/C][/ROW]
[ROW][C]15[/C][C]0.094722[/C][C]0.8681[/C][C]0.193896[/C][/ROW]
[ROW][C]16[/C][C]0.022667[/C][C]0.2078[/C][C]0.417963[/C][/ROW]
[ROW][C]17[/C][C]-0.009782[/C][C]-0.0897[/C][C]0.464389[/C][/ROW]
[ROW][C]18[/C][C]-0.053594[/C][C]-0.4912[/C][C]0.312285[/C][/ROW]
[ROW][C]19[/C][C]-0.102482[/C][C]-0.9393[/C][C]0.175145[/C][/ROW]
[ROW][C]20[/C][C]-0.150174[/C][C]-1.3764[/C][C]0.086182[/C][/ROW]
[ROW][C]21[/C][C]-0.157821[/C][C]-1.4465[/C][C]0.075885[/C][/ROW]
[ROW][C]22[/C][C]-0.129897[/C][C]-1.1905[/C][C]0.118596[/C][/ROW]
[ROW][C]23[/C][C]-0.090103[/C][C]-0.8258[/C][C]0.205626[/C][/ROW]
[ROW][C]24[/C][C]-0.078041[/C][C]-0.7153[/C][C]0.238217[/C][/ROW]
[ROW][C]25[/C][C]-0.165603[/C][C]-1.5178[/C][C]0.066413[/C][/ROW]
[ROW][C]26[/C][C]-0.277014[/C][C]-2.5389[/C][C]0.006482[/C][/ROW]
[ROW][C]27[/C][C]-0.360596[/C][C]-3.3049[/C][C]0.000699[/C][/ROW]
[ROW][C]28[/C][C]-0.401281[/C][C]-3.6778[/C][C]0.000207[/C][/ROW]
[ROW][C]29[/C][C]-0.411682[/C][C]-3.7731[/C][C]0.00015[/C][/ROW]
[ROW][C]30[/C][C]-0.42753[/C][C]-3.9184[/C][C]9.1e-05[/C][/ROW]
[ROW][C]31[/C][C]-0.442572[/C][C]-4.0562[/C][C]5.6e-05[/C][/ROW]
[ROW][C]32[/C][C]-0.453307[/C][C]-4.1546[/C][C]3.9e-05[/C][/ROW]
[ROW][C]33[/C][C]-0.43084[/C][C]-3.9487[/C][C]8.1e-05[/C][/ROW]
[ROW][C]34[/C][C]-0.381054[/C][C]-3.4924[/C][C]0.000383[/C][/ROW]
[ROW][C]35[/C][C]-0.32439[/C][C]-2.9731[/C][C]0.001923[/C][/ROW]
[ROW][C]36[/C][C]-0.290471[/C][C]-2.6622[/C][C]0.004651[/C][/ROW]
[ROW][C]37[/C][C]-0.340704[/C][C]-3.1226[/C][C]0.00123[/C][/ROW]
[ROW][C]38[/C][C]-0.408951[/C][C]-3.7481[/C][C]0.000163[/C][/ROW]
[ROW][C]39[/C][C]-0.448914[/C][C]-4.1144[/C][C]4.5e-05[/C][/ROW]
[ROW][C]40[/C][C]-0.44983[/C][C]-4.1228[/C][C]4.4e-05[/C][/ROW]
[ROW][C]41[/C][C]-0.429186[/C][C]-3.9336[/C][C]8.6e-05[/C][/ROW]
[ROW][C]42[/C][C]-0.415359[/C][C]-3.8068[/C][C]0.000133[/C][/ROW]
[ROW][C]43[/C][C]-0.402048[/C][C]-3.6848[/C][C]0.000202[/C][/ROW]
[ROW][C]44[/C][C]-0.386096[/C][C]-3.5386[/C][C]0.000329[/C][/ROW]
[ROW][C]45[/C][C]-0.341827[/C][C]-3.1329[/C][C]0.001192[/C][/ROW]
[ROW][C]46[/C][C]-0.283352[/C][C]-2.597[/C][C]0.005551[/C][/ROW]
[ROW][C]47[/C][C]-0.220983[/C][C]-2.0253[/C][C]0.023004[/C][/ROW]
[ROW][C]48[/C][C]-0.173224[/C][C]-1.5876[/C][C]0.058064[/C][/ROW]
[/TABLE]
Source: https://freestatistics.org/blog/index.php?pk=120505&T=1

Globally Unique Identifier (entire table): ba.freestatistics.org/blog/index.php?pk=120505&T=1

As an alternative you can also use a QR Code:  

The GUIDs for individual cells are displayed in the table below:

Autocorrelation Function
Time lag kACF(k)T-STATP-value
10.8975258.2260
20.750766.88080
30.6353355.82290
40.5684875.21031e-06
50.5457165.00162e-06
60.5096124.67076e-06
70.4577394.19523.4e-05
80.4004183.66990.000213
90.3866123.54340.000324
100.415883.81160.000131
110.4704314.31162.2e-05
120.4844424.441.4e-05
130.3663523.35770.000591
140.2166441.98560.025171
150.0947220.86810.193896
160.0226670.20780.417963
17-0.009782-0.08970.464389
18-0.053594-0.49120.312285
19-0.102482-0.93930.175145
20-0.150174-1.37640.086182
21-0.157821-1.44650.075885
22-0.129897-1.19050.118596
23-0.090103-0.82580.205626
24-0.078041-0.71530.238217
25-0.165603-1.51780.066413
26-0.277014-2.53890.006482
27-0.360596-3.30490.000699
28-0.401281-3.67780.000207
29-0.411682-3.77310.00015
30-0.42753-3.91849.1e-05
31-0.442572-4.05625.6e-05
32-0.453307-4.15463.9e-05
33-0.43084-3.94878.1e-05
34-0.381054-3.49240.000383
35-0.32439-2.97310.001923
36-0.290471-2.66220.004651
37-0.340704-3.12260.00123
38-0.408951-3.74810.000163
39-0.448914-4.11444.5e-05
40-0.44983-4.12284.4e-05
41-0.429186-3.93368.6e-05
42-0.415359-3.80680.000133
43-0.402048-3.68480.000202
44-0.386096-3.53860.000329
45-0.341827-3.13290.001192
46-0.283352-2.5970.005551
47-0.220983-2.02530.023004
48-0.173224-1.58760.058064


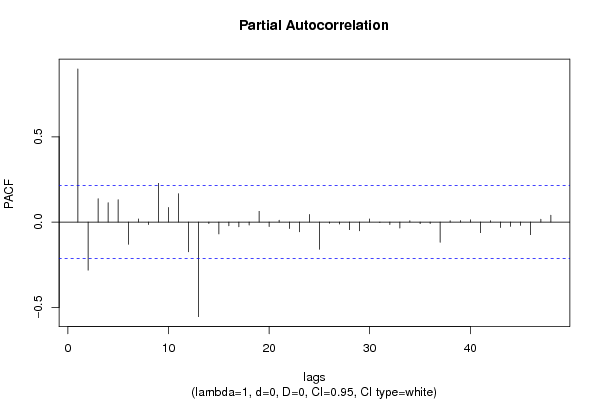
Partial Autocorrelation Function
Time lag kPACF(k)T-STATP-value
10.8975258.2260
2-0.28178-2.58260.00577
30.1370991.25650.106202
40.1135611.04080.150477
50.1306131.19710.11732
6-0.129754-1.18920.118854
70.0184410.1690.433095
8-0.014553-0.13340.447105
90.2270782.08120.02023
100.0860520.78870.216261
110.1662791.5240.065636
12-0.173845-1.59330.057422
13-0.554238-5.07971e-06
14-0.008947-0.0820.46742
15-0.069332-0.63540.263436
16-0.021383-0.1960.422552
17-0.026994-0.24740.4026
18-0.017766-0.16280.435524
190.0629090.57660.282886
20-0.026368-0.24170.404813
210.0109220.10010.460253
22-0.038204-0.35010.363553
23-0.056631-0.5190.302551
240.0444750.40760.342294
25-0.159012-1.45740.074371
26-0.006828-0.06260.475126
27-0.011898-0.1090.456714
28-0.044257-0.40560.343025
29-0.050787-0.46550.3214
300.0179740.16470.434773
31-0.002094-0.01920.492367
32-0.014769-0.13540.446325
33-0.034459-0.31580.37646
340.0077720.07120.47169
35-0.00926-0.08490.466283
36-0.008969-0.08220.467342
37-0.118333-1.08450.140614
380.0084420.07740.469257
390.0088980.08160.467599
400.013170.12070.452105
41-0.062099-0.56910.285388
420.0083470.07650.4696
43-0.032217-0.29530.384256
44-0.025454-0.23330.408051
45-0.019442-0.17820.429502
46-0.07362-0.67470.250847
470.0167320.15340.439245
480.0405580.37170.35552

\begin{tabular}{lllllllll}
\hline
Partial Autocorrelation Function \tabularnewline
Time lag k & PACF(k) & T-STAT & P-value \tabularnewline
1 & 0.897525 & 8.226 & 0 \tabularnewline
2 & -0.28178 & -2.5826 & 0.00577 \tabularnewline
3 & 0.137099 & 1.2565 & 0.106202 \tabularnewline
4 & 0.113561 & 1.0408 & 0.150477 \tabularnewline
5 & 0.130613 & 1.1971 & 0.11732 \tabularnewline
6 & -0.129754 & -1.1892 & 0.118854 \tabularnewline
7 & 0.018441 & 0.169 & 0.433095 \tabularnewline
8 & -0.014553 & -0.1334 & 0.447105 \tabularnewline
9 & 0.227078 & 2.0812 & 0.02023 \tabularnewline
10 & 0.086052 & 0.7887 & 0.216261 \tabularnewline
11 & 0.166279 & 1.524 & 0.065636 \tabularnewline
12 & -0.173845 & -1.5933 & 0.057422 \tabularnewline
13 & -0.554238 & -5.0797 & 1e-06 \tabularnewline
14 & -0.008947 & -0.082 & 0.46742 \tabularnewline
15 & -0.069332 & -0.6354 & 0.263436 \tabularnewline
16 & -0.021383 & -0.196 & 0.422552 \tabularnewline
17 & -0.026994 & -0.2474 & 0.4026 \tabularnewline
18 & -0.017766 & -0.1628 & 0.435524 \tabularnewline
19 & 0.062909 & 0.5766 & 0.282886 \tabularnewline
20 & -0.026368 & -0.2417 & 0.404813 \tabularnewline
21 & 0.010922 & 0.1001 & 0.460253 \tabularnewline
22 & -0.038204 & -0.3501 & 0.363553 \tabularnewline
23 & -0.056631 & -0.519 & 0.302551 \tabularnewline
24 & 0.044475 & 0.4076 & 0.342294 \tabularnewline
25 & -0.159012 & -1.4574 & 0.074371 \tabularnewline
26 & -0.006828 & -0.0626 & 0.475126 \tabularnewline
27 & -0.011898 & -0.109 & 0.456714 \tabularnewline
28 & -0.044257 & -0.4056 & 0.343025 \tabularnewline
29 & -0.050787 & -0.4655 & 0.3214 \tabularnewline
30 & 0.017974 & 0.1647 & 0.434773 \tabularnewline
31 & -0.002094 & -0.0192 & 0.492367 \tabularnewline
32 & -0.014769 & -0.1354 & 0.446325 \tabularnewline
33 & -0.034459 & -0.3158 & 0.37646 \tabularnewline
34 & 0.007772 & 0.0712 & 0.47169 \tabularnewline
35 & -0.00926 & -0.0849 & 0.466283 \tabularnewline
36 & -0.008969 & -0.0822 & 0.467342 \tabularnewline
37 & -0.118333 & -1.0845 & 0.140614 \tabularnewline
38 & 0.008442 & 0.0774 & 0.469257 \tabularnewline
39 & 0.008898 & 0.0816 & 0.467599 \tabularnewline
40 & 0.01317 & 0.1207 & 0.452105 \tabularnewline
41 & -0.062099 & -0.5691 & 0.285388 \tabularnewline
42 & 0.008347 & 0.0765 & 0.4696 \tabularnewline
43 & -0.032217 & -0.2953 & 0.384256 \tabularnewline
44 & -0.025454 & -0.2333 & 0.408051 \tabularnewline
45 & -0.019442 & -0.1782 & 0.429502 \tabularnewline
46 & -0.07362 & -0.6747 & 0.250847 \tabularnewline
47 & 0.016732 & 0.1534 & 0.439245 \tabularnewline
48 & 0.040558 & 0.3717 & 0.35552 \tabularnewline
\hline
\end{tabular}
%Source: https://freestatistics.org/blog/index.php?pk=120505&T=2

[TABLE]
[ROW][C]Partial Autocorrelation Function[/C][/ROW]
[ROW][C]Time lag k[/C][C]PACF(k)[/C][C]T-STAT[/C][C]P-value[/C][/ROW]
[ROW][C]1[/C][C]0.897525[/C][C]8.226[/C][C]0[/C][/ROW]
[ROW][C]2[/C][C]-0.28178[/C][C]-2.5826[/C][C]0.00577[/C][/ROW]
[ROW][C]3[/C][C]0.137099[/C][C]1.2565[/C][C]0.106202[/C][/ROW]
[ROW][C]4[/C][C]0.113561[/C][C]1.0408[/C][C]0.150477[/C][/ROW]
[ROW][C]5[/C][C]0.130613[/C][C]1.1971[/C][C]0.11732[/C][/ROW]
[ROW][C]6[/C][C]-0.129754[/C][C]-1.1892[/C][C]0.118854[/C][/ROW]
[ROW][C]7[/C][C]0.018441[/C][C]0.169[/C][C]0.433095[/C][/ROW]
[ROW][C]8[/C][C]-0.014553[/C][C]-0.1334[/C][C]0.447105[/C][/ROW]
[ROW][C]9[/C][C]0.227078[/C][C]2.0812[/C][C]0.02023[/C][/ROW]
[ROW][C]10[/C][C]0.086052[/C][C]0.7887[/C][C]0.216261[/C][/ROW]
[ROW][C]11[/C][C]0.166279[/C][C]1.524[/C][C]0.065636[/C][/ROW]
[ROW][C]12[/C][C]-0.173845[/C][C]-1.5933[/C][C]0.057422[/C][/ROW]
[ROW][C]13[/C][C]-0.554238[/C][C]-5.0797[/C][C]1e-06[/C][/ROW]
[ROW][C]14[/C][C]-0.008947[/C][C]-0.082[/C][C]0.46742[/C][/ROW]
[ROW][C]15[/C][C]-0.069332[/C][C]-0.6354[/C][C]0.263436[/C][/ROW]
[ROW][C]16[/C][C]-0.021383[/C][C]-0.196[/C][C]0.422552[/C][/ROW]
[ROW][C]17[/C][C]-0.026994[/C][C]-0.2474[/C][C]0.4026[/C][/ROW]
[ROW][C]18[/C][C]-0.017766[/C][C]-0.1628[/C][C]0.435524[/C][/ROW]
[ROW][C]19[/C][C]0.062909[/C][C]0.5766[/C][C]0.282886[/C][/ROW]
[ROW][C]20[/C][C]-0.026368[/C][C]-0.2417[/C][C]0.404813[/C][/ROW]
[ROW][C]21[/C][C]0.010922[/C][C]0.1001[/C][C]0.460253[/C][/ROW]
[ROW][C]22[/C][C]-0.038204[/C][C]-0.3501[/C][C]0.363553[/C][/ROW]
[ROW][C]23[/C][C]-0.056631[/C][C]-0.519[/C][C]0.302551[/C][/ROW]
[ROW][C]24[/C][C]0.044475[/C][C]0.4076[/C][C]0.342294[/C][/ROW]
[ROW][C]25[/C][C]-0.159012[/C][C]-1.4574[/C][C]0.074371[/C][/ROW]
[ROW][C]26[/C][C]-0.006828[/C][C]-0.0626[/C][C]0.475126[/C][/ROW]
[ROW][C]27[/C][C]-0.011898[/C][C]-0.109[/C][C]0.456714[/C][/ROW]
[ROW][C]28[/C][C]-0.044257[/C][C]-0.4056[/C][C]0.343025[/C][/ROW]
[ROW][C]29[/C][C]-0.050787[/C][C]-0.4655[/C][C]0.3214[/C][/ROW]
[ROW][C]30[/C][C]0.017974[/C][C]0.1647[/C][C]0.434773[/C][/ROW]
[ROW][C]31[/C][C]-0.002094[/C][C]-0.0192[/C][C]0.492367[/C][/ROW]
[ROW][C]32[/C][C]-0.014769[/C][C]-0.1354[/C][C]0.446325[/C][/ROW]
[ROW][C]33[/C][C]-0.034459[/C][C]-0.3158[/C][C]0.37646[/C][/ROW]
[ROW][C]34[/C][C]0.007772[/C][C]0.0712[/C][C]0.47169[/C][/ROW]
[ROW][C]35[/C][C]-0.00926[/C][C]-0.0849[/C][C]0.466283[/C][/ROW]
[ROW][C]36[/C][C]-0.008969[/C][C]-0.0822[/C][C]0.467342[/C][/ROW]
[ROW][C]37[/C][C]-0.118333[/C][C]-1.0845[/C][C]0.140614[/C][/ROW]
[ROW][C]38[/C][C]0.008442[/C][C]0.0774[/C][C]0.469257[/C][/ROW]
[ROW][C]39[/C][C]0.008898[/C][C]0.0816[/C][C]0.467599[/C][/ROW]
[ROW][C]40[/C][C]0.01317[/C][C]0.1207[/C][C]0.452105[/C][/ROW]
[ROW][C]41[/C][C]-0.062099[/C][C]-0.5691[/C][C]0.285388[/C][/ROW]
[ROW][C]42[/C][C]0.008347[/C][C]0.0765[/C][C]0.4696[/C][/ROW]
[ROW][C]43[/C][C]-0.032217[/C][C]-0.2953[/C][C]0.384256[/C][/ROW]
[ROW][C]44[/C][C]-0.025454[/C][C]-0.2333[/C][C]0.408051[/C][/ROW]
[ROW][C]45[/C][C]-0.019442[/C][C]-0.1782[/C][C]0.429502[/C][/ROW]
[ROW][C]46[/C][C]-0.07362[/C][C]-0.6747[/C][C]0.250847[/C][/ROW]
[ROW][C]47[/C][C]0.016732[/C][C]0.1534[/C][C]0.439245[/C][/ROW]
[ROW][C]48[/C][C]0.040558[/C][C]0.3717[/C][C]0.35552[/C][/ROW]
[/TABLE]
Source: https://freestatistics.org/blog/index.php?pk=120505&T=2

Globally Unique Identifier (entire table): ba.freestatistics.org/blog/index.php?pk=120505&T=2

As an alternative you can also use a QR Code:  

The GUIDs for individual cells are displayed in the table below:

Partial Autocorrelation Function
Time lag kPACF(k)T-STATP-value
10.8975258.2260
2-0.28178-2.58260.00577
30.1370991.25650.106202
40.1135611.04080.150477
50.1306131.19710.11732
6-0.129754-1.18920.118854
70.0184410.1690.433095
8-0.014553-0.13340.447105
90.2270782.08120.02023
100.0860520.78870.216261
110.1662791.5240.065636
12-0.173845-1.59330.057422
13-0.554238-5.07971e-06
14-0.008947-0.0820.46742
15-0.069332-0.63540.263436
16-0.021383-0.1960.422552
17-0.026994-0.24740.4026
18-0.017766-0.16280.435524
190.0629090.57660.282886
20-0.026368-0.24170.404813
210.0109220.10010.460253
22-0.038204-0.35010.363553
23-0.056631-0.5190.302551
240.0444750.40760.342294
25-0.159012-1.45740.074371
26-0.006828-0.06260.475126
27-0.011898-0.1090.456714
28-0.044257-0.40560.343025
29-0.050787-0.46550.3214
300.0179740.16470.434773
31-0.002094-0.01920.492367
32-0.014769-0.13540.446325
33-0.034459-0.31580.37646
340.0077720.07120.47169
35-0.00926-0.08490.466283
36-0.008969-0.08220.467342
37-0.118333-1.08450.140614
380.0084420.07740.469257
390.0088980.08160.467599
400.013170.12070.452105
41-0.062099-0.56910.285388
420.0083470.07650.4696
43-0.032217-0.29530.384256
44-0.025454-0.23330.408051
45-0.019442-0.17820.429502
46-0.07362-0.67470.250847
470.0167320.15340.439245
480.0405580.37170.35552


Parameters (Session):
par1 = 48 ; par2 = 1 ; par3 = 0 ; par4 = 0 ; par5 = 12 ; par6 = White Noise ; par7 = 0.95 ;
Parameters (R input):
par1 = 48 ; par2 = 1 ; par3 = 0 ; par4 = 0 ; par5 = 12 ; par6 = White Noise ; par7 = 0.95 ; par8 = ;
R code (references can be found in the software module):
if (par1 == 'Default') {
par1 = 10*log10(length(x))
} else {
par1 <- as.numeric(par1)
}
par2 <- as.numeric(par2)
par3 <- as.numeric(par3)
par4 <- as.numeric(par4)
par5 <- as.numeric(par5)
if (par6 == 'White Noise') par6 <- 'white' else par6 <- 'ma'
par7 <- as.numeric(par7)
if (par8 != '') par8 <- as.numeric(par8)
ox <- x
if (par8 == '') {
if (par2 == 0) {
x <- log(x)
} else {
x <- (x ^ par2 - 1) / par2
}
} else {
x <- log(x,base=par8)
}
if (par3 > 0) x <- diff(x,lag=1,difference=par3)
if (par4 > 0) x <- diff(x,lag=par5,difference=par4)
bitmap(file='picts.png')
op <- par(mfrow=c(2,1))
plot(ox,type='l',main='Original Time Series',xlab='time',ylab='value')
if (par8=='') {
mytitle <- paste('Working Time Series (lambda=',par2,', d=',par3,', D=',par4,')',sep='')
mysub <- paste('(lambda=',par2,', d=',par3,', D=',par4,', CI=', par7, ', CI type=',par6,')',sep='')
} else {
mytitle <- paste('Working Time Series (base=',par8,', d=',par3,', D=',par4,')',sep='')
mysub <- paste('(base=',par8,', d=',par3,', D=',par4,', CI=', par7, ', CI type=',par6,')',sep='')
}
plot(x,type='l', main=mytitle,xlab='time',ylab='value')
par(op)
dev.off()
bitmap(file='pic1.png')
racf <- acf(x, par1, main='Autocorrelation', xlab='time lag', ylab='ACF', ci.type=par6, ci=par7, sub=mysub)
dev.off()
bitmap(file='pic2.png')
rpacf <- pacf(x,par1,main='Partial Autocorrelation',xlab='lags',ylab='PACF',sub=mysub)
dev.off()
(myacf <- c(racf$acf))
(mypacf <- c(rpacf$acf))
lengthx <- length(x)
sqrtn <- sqrt(lengthx)
load(file='createtable')
a<-table.start()
a<-table.row.start(a)
a<-table.element(a,'Autocorrelation Function',4,TRUE)
a<-table.row.end(a)
a<-table.row.start(a)
a<-table.element(a,'Time lag k',header=TRUE)
a<-table.element(a,hyperlink('basics.htm','ACF(k)','click here for more information about the Autocorrelation Function'),header=TRUE)
a<-table.element(a,'T-STAT',header=TRUE)
a<-table.element(a,'P-value',header=TRUE)
a<-table.row.end(a)
for (i in 2:(par1+1)) {
a<-table.row.start(a)
a<-table.element(a,i-1,header=TRUE)
a<-table.element(a,round(myacf[i],6))
mytstat <- myacf[i]*sqrtn
a<-table.element(a,round(mytstat,4))
a<-table.element(a,round(1-pt(abs(mytstat),lengthx),6))
a<-table.row.end(a)
}
a<-table.end(a)
table.save(a,file='mytable.tab')
a<-table.start()
a<-table.row.start(a)
a<-table.element(a,'Partial Autocorrelation Function',4,TRUE)
a<-table.row.end(a)
a<-table.row.start(a)
a<-table.element(a,'Time lag k',header=TRUE)
a<-table.element(a,hyperlink('basics.htm','PACF(k)','click here for more information about the Partial Autocorrelation Function'),header=TRUE)
a<-table.element(a,'T-STAT',header=TRUE)
a<-table.element(a,'P-value',header=TRUE)
a<-table.row.end(a)
for (i in 1:par1) {
a<-table.row.start(a)
a<-table.element(a,i,header=TRUE)
a<-table.element(a,round(mypacf[i],6))
mytstat <- mypacf[i]*sqrtn
a<-table.element(a,round(mytstat,4))
a<-table.element(a,round(1-pt(abs(mytstat),lengthx),6))
a<-table.row.end(a)
}
a<-table.end(a)
table.save(a,file='mytable1.tab')