Free Statistics

of Irreproducible Research!

Author's title

Author*Unverified author*
R Software Modulerwasp_autocorrelation.wasp
Title produced by software(Partial) Autocorrelation Function
Date of computationMon, 11 Apr 2011 21:21:20 +0000
Cite this page as followsStatistical Computations at FreeStatistics.org, Office for Research Development and Education, URL https://freestatistics.org/blog/index.php?v=date/2011/Apr/11/t1302556815ocmcut3ku1tx3y2.htm/, Retrieved Thu, 09 May 2024 11:06:12 +0000
Statistical Computations at FreeStatistics.org, Office for Research Development and Education, URL https://freestatistics.org/blog/index.php?pk=120503, Retrieved Thu, 09 May 2024 11:06:12 +0000
QR Codes:

Original text written by user:
IsPrivate?No (this computation is public)
User-defined keywordsKDGP2W12
Estimated Impact114
Family? (F = Feedback message, R = changed R code, M = changed R Module, P = changed Parameters, D = changed Data)
-       [(Partial) Autocorrelation Function] [Opdracht6bis: aut...] [2011-04-11 21:21:20] [d324b46bbfd5b5abf133f66a31553d9d] [Current]
Feedback Forum

Post a new message
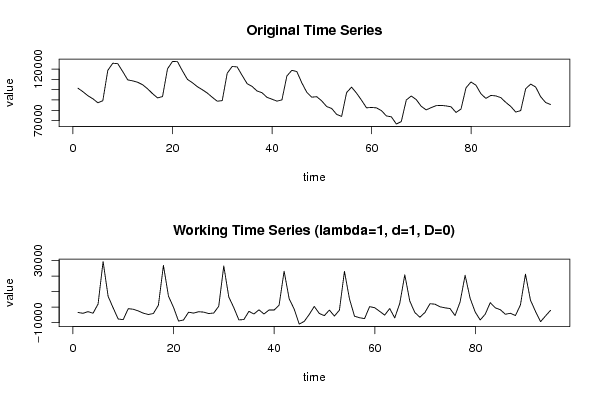
Dataseries X:
101397
97994
94044
91159
87239
89235
118647
125620
125154
117529
109459
108483
107137
104699
100804
96066
91971
93228
120144
127233
127166
118194
109940
106683
102834
99882
96666
92540
88744
89321
115870
122401
122030
113802
105791
103076
98658
96945
92497
90687
88796
90015
113228
118711
117460
106556
97347
92657
93118
89037
83570
81693
75956
73993
97088
102394
96549
89727
82336
82653
82303
79596
74472
73562
66618
69029
89899
93774
90305
83799
80320
82497
84420
84646
84186
83269
77793
81145
101691
107357
104253
95963
91432
94324
93855
92183
87600
83641
78195
79604
100846
105293
102518
93132
87479
85476


Summary of computational transaction
Raw Inputview raw input (R code)
Raw Outputview raw output of R engine
Computing time1 seconds
R Server'Gwilym Jenkins' @ www.wessa.org

\begin{tabular}{lllllllll}
\hline
Summary of computational transaction \tabularnewline
Raw Input & view raw input (R code)  \tabularnewline
Raw Output & view raw output of R engine  \tabularnewline
Computing time & 1 seconds \tabularnewline
R Server & 'Gwilym Jenkins' @ www.wessa.org \tabularnewline
\hline
\end{tabular}
%Source: https://freestatistics.org/blog/index.php?pk=120503&T=0

[TABLE]
[ROW][C]Summary of computational transaction[/C][/ROW]
[ROW][C]Raw Input[/C][C]view raw input (R code) [/C][/ROW]
[ROW][C]Raw Output[/C][C]view raw output of R engine [/C][/ROW]
[ROW][C]Computing time[/C][C]1 seconds[/C][/ROW]
[ROW][C]R Server[/C][C]'Gwilym Jenkins' @ www.wessa.org[/C][/ROW]
[/TABLE]
Source: https://freestatistics.org/blog/index.php?pk=120503&T=0

Globally Unique Identifier (entire table): ba.freestatistics.org/blog/index.php?pk=120503&T=0

As an alternative you can also use a QR Code:  

The GUIDs for individual cells are displayed in the table below:

Summary of computational transaction
Raw Inputview raw input (R code)
Raw Outputview raw output of R engine
Computing time1 seconds
R Server'Gwilym Jenkins' @ www.wessa.org


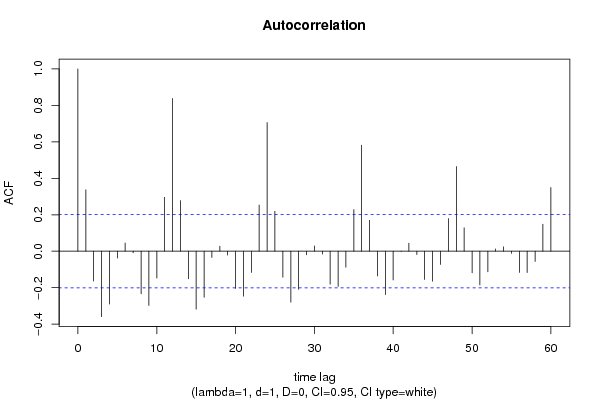
Autocorrelation Function
Time lag kACF(k)T-STATP-value
10.3370473.28510.000714
2-0.163731-1.59590.056922
3-0.358984-3.49890.000356
4-0.28979-2.82450.002885
5-0.037671-0.36720.357155
60.0450290.43890.33087
7-0.008603-0.08390.466674
8-0.233644-2.27730.012506
9-0.297766-2.90230.002303
10-0.147112-1.43390.077446
110.2957152.88230.002441
120.8380018.16780
130.2779952.70960.003997
14-0.151606-1.47770.071402
15-0.318096-3.10040.001272
16-0.252712-2.46310.007786
17-0.034272-0.3340.369543
180.027810.27110.393466
19-0.021174-0.20640.418467
20-0.204111-1.98940.024765
21-0.246812-2.40560.009041
22-0.116472-1.13520.129567
230.2529582.46550.007738
240.7060286.88150
250.2192712.13720.017575
26-0.142402-1.3880.084197
27-0.279849-2.72760.003799
28-0.208838-2.03550.022293
29-0.020046-0.19540.422754
300.0288090.28080.389738
31-0.0155-0.15110.440118
32-0.180883-1.7630.040555
33-0.193582-1.88680.031121
34-0.087895-0.85670.196884
350.2288092.23020.014046
360.5814295.66710
370.1699281.65630.050485
38-0.135898-1.32460.094246
39-0.237566-2.31550.011368
40-0.15751-1.53520.064027
41-0.000921-0.0090.49643
420.0437760.42670.33529
43-0.018288-0.17830.429452
44-0.154565-1.50650.067627
45-0.164569-1.6040.056014
46-0.072487-0.70650.240799
470.1790131.74480.042126
480.4647224.52959e-06
490.1286891.25430.106403
50-0.118367-1.15370.12576
51-0.185006-1.80320.037262
52-0.112945-1.10090.136871
530.0125520.12230.451444
540.0242580.23640.406802
55-0.011896-0.11590.45397
56-0.116149-1.13210.130226
57-0.117036-1.14070.128426
58-0.056091-0.54670.292931
590.1484931.44730.075548
600.3490033.40170.000491

\begin{tabular}{lllllllll}
\hline
Autocorrelation Function \tabularnewline
Time lag k & ACF(k) & T-STAT & P-value \tabularnewline
1 & 0.337047 & 3.2851 & 0.000714 \tabularnewline
2 & -0.163731 & -1.5959 & 0.056922 \tabularnewline
3 & -0.358984 & -3.4989 & 0.000356 \tabularnewline
4 & -0.28979 & -2.8245 & 0.002885 \tabularnewline
5 & -0.037671 & -0.3672 & 0.357155 \tabularnewline
6 & 0.045029 & 0.4389 & 0.33087 \tabularnewline
7 & -0.008603 & -0.0839 & 0.466674 \tabularnewline
8 & -0.233644 & -2.2773 & 0.012506 \tabularnewline
9 & -0.297766 & -2.9023 & 0.002303 \tabularnewline
10 & -0.147112 & -1.4339 & 0.077446 \tabularnewline
11 & 0.295715 & 2.8823 & 0.002441 \tabularnewline
12 & 0.838001 & 8.1678 & 0 \tabularnewline
13 & 0.277995 & 2.7096 & 0.003997 \tabularnewline
14 & -0.151606 & -1.4777 & 0.071402 \tabularnewline
15 & -0.318096 & -3.1004 & 0.001272 \tabularnewline
16 & -0.252712 & -2.4631 & 0.007786 \tabularnewline
17 & -0.034272 & -0.334 & 0.369543 \tabularnewline
18 & 0.02781 & 0.2711 & 0.393466 \tabularnewline
19 & -0.021174 & -0.2064 & 0.418467 \tabularnewline
20 & -0.204111 & -1.9894 & 0.024765 \tabularnewline
21 & -0.246812 & -2.4056 & 0.009041 \tabularnewline
22 & -0.116472 & -1.1352 & 0.129567 \tabularnewline
23 & 0.252958 & 2.4655 & 0.007738 \tabularnewline
24 & 0.706028 & 6.8815 & 0 \tabularnewline
25 & 0.219271 & 2.1372 & 0.017575 \tabularnewline
26 & -0.142402 & -1.388 & 0.084197 \tabularnewline
27 & -0.279849 & -2.7276 & 0.003799 \tabularnewline
28 & -0.208838 & -2.0355 & 0.022293 \tabularnewline
29 & -0.020046 & -0.1954 & 0.422754 \tabularnewline
30 & 0.028809 & 0.2808 & 0.389738 \tabularnewline
31 & -0.0155 & -0.1511 & 0.440118 \tabularnewline
32 & -0.180883 & -1.763 & 0.040555 \tabularnewline
33 & -0.193582 & -1.8868 & 0.031121 \tabularnewline
34 & -0.087895 & -0.8567 & 0.196884 \tabularnewline
35 & 0.228809 & 2.2302 & 0.014046 \tabularnewline
36 & 0.581429 & 5.6671 & 0 \tabularnewline
37 & 0.169928 & 1.6563 & 0.050485 \tabularnewline
38 & -0.135898 & -1.3246 & 0.094246 \tabularnewline
39 & -0.237566 & -2.3155 & 0.011368 \tabularnewline
40 & -0.15751 & -1.5352 & 0.064027 \tabularnewline
41 & -0.000921 & -0.009 & 0.49643 \tabularnewline
42 & 0.043776 & 0.4267 & 0.33529 \tabularnewline
43 & -0.018288 & -0.1783 & 0.429452 \tabularnewline
44 & -0.154565 & -1.5065 & 0.067627 \tabularnewline
45 & -0.164569 & -1.604 & 0.056014 \tabularnewline
46 & -0.072487 & -0.7065 & 0.240799 \tabularnewline
47 & 0.179013 & 1.7448 & 0.042126 \tabularnewline
48 & 0.464722 & 4.5295 & 9e-06 \tabularnewline
49 & 0.128689 & 1.2543 & 0.106403 \tabularnewline
50 & -0.118367 & -1.1537 & 0.12576 \tabularnewline
51 & -0.185006 & -1.8032 & 0.037262 \tabularnewline
52 & -0.112945 & -1.1009 & 0.136871 \tabularnewline
53 & 0.012552 & 0.1223 & 0.451444 \tabularnewline
54 & 0.024258 & 0.2364 & 0.406802 \tabularnewline
55 & -0.011896 & -0.1159 & 0.45397 \tabularnewline
56 & -0.116149 & -1.1321 & 0.130226 \tabularnewline
57 & -0.117036 & -1.1407 & 0.128426 \tabularnewline
58 & -0.056091 & -0.5467 & 0.292931 \tabularnewline
59 & 0.148493 & 1.4473 & 0.075548 \tabularnewline
60 & 0.349003 & 3.4017 & 0.000491 \tabularnewline
\hline
\end{tabular}
%Source: https://freestatistics.org/blog/index.php?pk=120503&T=1

[TABLE]
[ROW][C]Autocorrelation Function[/C][/ROW]
[ROW][C]Time lag k[/C][C]ACF(k)[/C][C]T-STAT[/C][C]P-value[/C][/ROW]
[ROW][C]1[/C][C]0.337047[/C][C]3.2851[/C][C]0.000714[/C][/ROW]
[ROW][C]2[/C][C]-0.163731[/C][C]-1.5959[/C][C]0.056922[/C][/ROW]
[ROW][C]3[/C][C]-0.358984[/C][C]-3.4989[/C][C]0.000356[/C][/ROW]
[ROW][C]4[/C][C]-0.28979[/C][C]-2.8245[/C][C]0.002885[/C][/ROW]
[ROW][C]5[/C][C]-0.037671[/C][C]-0.3672[/C][C]0.357155[/C][/ROW]
[ROW][C]6[/C][C]0.045029[/C][C]0.4389[/C][C]0.33087[/C][/ROW]
[ROW][C]7[/C][C]-0.008603[/C][C]-0.0839[/C][C]0.466674[/C][/ROW]
[ROW][C]8[/C][C]-0.233644[/C][C]-2.2773[/C][C]0.012506[/C][/ROW]
[ROW][C]9[/C][C]-0.297766[/C][C]-2.9023[/C][C]0.002303[/C][/ROW]
[ROW][C]10[/C][C]-0.147112[/C][C]-1.4339[/C][C]0.077446[/C][/ROW]
[ROW][C]11[/C][C]0.295715[/C][C]2.8823[/C][C]0.002441[/C][/ROW]
[ROW][C]12[/C][C]0.838001[/C][C]8.1678[/C][C]0[/C][/ROW]
[ROW][C]13[/C][C]0.277995[/C][C]2.7096[/C][C]0.003997[/C][/ROW]
[ROW][C]14[/C][C]-0.151606[/C][C]-1.4777[/C][C]0.071402[/C][/ROW]
[ROW][C]15[/C][C]-0.318096[/C][C]-3.1004[/C][C]0.001272[/C][/ROW]
[ROW][C]16[/C][C]-0.252712[/C][C]-2.4631[/C][C]0.007786[/C][/ROW]
[ROW][C]17[/C][C]-0.034272[/C][C]-0.334[/C][C]0.369543[/C][/ROW]
[ROW][C]18[/C][C]0.02781[/C][C]0.2711[/C][C]0.393466[/C][/ROW]
[ROW][C]19[/C][C]-0.021174[/C][C]-0.2064[/C][C]0.418467[/C][/ROW]
[ROW][C]20[/C][C]-0.204111[/C][C]-1.9894[/C][C]0.024765[/C][/ROW]
[ROW][C]21[/C][C]-0.246812[/C][C]-2.4056[/C][C]0.009041[/C][/ROW]
[ROW][C]22[/C][C]-0.116472[/C][C]-1.1352[/C][C]0.129567[/C][/ROW]
[ROW][C]23[/C][C]0.252958[/C][C]2.4655[/C][C]0.007738[/C][/ROW]
[ROW][C]24[/C][C]0.706028[/C][C]6.8815[/C][C]0[/C][/ROW]
[ROW][C]25[/C][C]0.219271[/C][C]2.1372[/C][C]0.017575[/C][/ROW]
[ROW][C]26[/C][C]-0.142402[/C][C]-1.388[/C][C]0.084197[/C][/ROW]
[ROW][C]27[/C][C]-0.279849[/C][C]-2.7276[/C][C]0.003799[/C][/ROW]
[ROW][C]28[/C][C]-0.208838[/C][C]-2.0355[/C][C]0.022293[/C][/ROW]
[ROW][C]29[/C][C]-0.020046[/C][C]-0.1954[/C][C]0.422754[/C][/ROW]
[ROW][C]30[/C][C]0.028809[/C][C]0.2808[/C][C]0.389738[/C][/ROW]
[ROW][C]31[/C][C]-0.0155[/C][C]-0.1511[/C][C]0.440118[/C][/ROW]
[ROW][C]32[/C][C]-0.180883[/C][C]-1.763[/C][C]0.040555[/C][/ROW]
[ROW][C]33[/C][C]-0.193582[/C][C]-1.8868[/C][C]0.031121[/C][/ROW]
[ROW][C]34[/C][C]-0.087895[/C][C]-0.8567[/C][C]0.196884[/C][/ROW]
[ROW][C]35[/C][C]0.228809[/C][C]2.2302[/C][C]0.014046[/C][/ROW]
[ROW][C]36[/C][C]0.581429[/C][C]5.6671[/C][C]0[/C][/ROW]
[ROW][C]37[/C][C]0.169928[/C][C]1.6563[/C][C]0.050485[/C][/ROW]
[ROW][C]38[/C][C]-0.135898[/C][C]-1.3246[/C][C]0.094246[/C][/ROW]
[ROW][C]39[/C][C]-0.237566[/C][C]-2.3155[/C][C]0.011368[/C][/ROW]
[ROW][C]40[/C][C]-0.15751[/C][C]-1.5352[/C][C]0.064027[/C][/ROW]
[ROW][C]41[/C][C]-0.000921[/C][C]-0.009[/C][C]0.49643[/C][/ROW]
[ROW][C]42[/C][C]0.043776[/C][C]0.4267[/C][C]0.33529[/C][/ROW]
[ROW][C]43[/C][C]-0.018288[/C][C]-0.1783[/C][C]0.429452[/C][/ROW]
[ROW][C]44[/C][C]-0.154565[/C][C]-1.5065[/C][C]0.067627[/C][/ROW]
[ROW][C]45[/C][C]-0.164569[/C][C]-1.604[/C][C]0.056014[/C][/ROW]
[ROW][C]46[/C][C]-0.072487[/C][C]-0.7065[/C][C]0.240799[/C][/ROW]
[ROW][C]47[/C][C]0.179013[/C][C]1.7448[/C][C]0.042126[/C][/ROW]
[ROW][C]48[/C][C]0.464722[/C][C]4.5295[/C][C]9e-06[/C][/ROW]
[ROW][C]49[/C][C]0.128689[/C][C]1.2543[/C][C]0.106403[/C][/ROW]
[ROW][C]50[/C][C]-0.118367[/C][C]-1.1537[/C][C]0.12576[/C][/ROW]
[ROW][C]51[/C][C]-0.185006[/C][C]-1.8032[/C][C]0.037262[/C][/ROW]
[ROW][C]52[/C][C]-0.112945[/C][C]-1.1009[/C][C]0.136871[/C][/ROW]
[ROW][C]53[/C][C]0.012552[/C][C]0.1223[/C][C]0.451444[/C][/ROW]
[ROW][C]54[/C][C]0.024258[/C][C]0.2364[/C][C]0.406802[/C][/ROW]
[ROW][C]55[/C][C]-0.011896[/C][C]-0.1159[/C][C]0.45397[/C][/ROW]
[ROW][C]56[/C][C]-0.116149[/C][C]-1.1321[/C][C]0.130226[/C][/ROW]
[ROW][C]57[/C][C]-0.117036[/C][C]-1.1407[/C][C]0.128426[/C][/ROW]
[ROW][C]58[/C][C]-0.056091[/C][C]-0.5467[/C][C]0.292931[/C][/ROW]
[ROW][C]59[/C][C]0.148493[/C][C]1.4473[/C][C]0.075548[/C][/ROW]
[ROW][C]60[/C][C]0.349003[/C][C]3.4017[/C][C]0.000491[/C][/ROW]
[/TABLE]
Source: https://freestatistics.org/blog/index.php?pk=120503&T=1

Globally Unique Identifier (entire table): ba.freestatistics.org/blog/index.php?pk=120503&T=1

As an alternative you can also use a QR Code:  

The GUIDs for individual cells are displayed in the table below:

Autocorrelation Function
Time lag kACF(k)T-STATP-value
10.3370473.28510.000714
2-0.163731-1.59590.056922
3-0.358984-3.49890.000356
4-0.28979-2.82450.002885
5-0.037671-0.36720.357155
60.0450290.43890.33087
7-0.008603-0.08390.466674
8-0.233644-2.27730.012506
9-0.297766-2.90230.002303
10-0.147112-1.43390.077446
110.2957152.88230.002441
120.8380018.16780
130.2779952.70960.003997
14-0.151606-1.47770.071402
15-0.318096-3.10040.001272
16-0.252712-2.46310.007786
17-0.034272-0.3340.369543
180.027810.27110.393466
19-0.021174-0.20640.418467
20-0.204111-1.98940.024765
21-0.246812-2.40560.009041
22-0.116472-1.13520.129567
230.2529582.46550.007738
240.7060286.88150
250.2192712.13720.017575
26-0.142402-1.3880.084197
27-0.279849-2.72760.003799
28-0.208838-2.03550.022293
29-0.020046-0.19540.422754
300.0288090.28080.389738
31-0.0155-0.15110.440118
32-0.180883-1.7630.040555
33-0.193582-1.88680.031121
34-0.087895-0.85670.196884
350.2288092.23020.014046
360.5814295.66710
370.1699281.65630.050485
38-0.135898-1.32460.094246
39-0.237566-2.31550.011368
40-0.15751-1.53520.064027
41-0.000921-0.0090.49643
420.0437760.42670.33529
43-0.018288-0.17830.429452
44-0.154565-1.50650.067627
45-0.164569-1.6040.056014
46-0.072487-0.70650.240799
470.1790131.74480.042126
480.4647224.52959e-06
490.1286891.25430.106403
50-0.118367-1.15370.12576
51-0.185006-1.80320.037262
52-0.112945-1.10090.136871
530.0125520.12230.451444
540.0242580.23640.406802
55-0.011896-0.11590.45397
56-0.116149-1.13210.130226
57-0.117036-1.14070.128426
58-0.056091-0.54670.292931
590.1484931.44730.075548
600.3490033.40170.000491


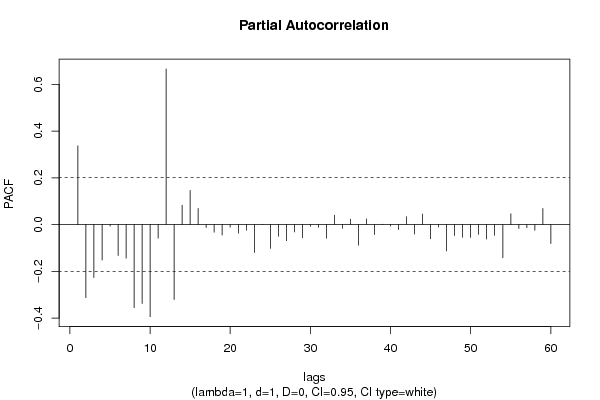
Partial Autocorrelation Function
Time lag kPACF(k)T-STATP-value
10.3370473.28510.000714
2-0.312874-3.04950.001485
3-0.226455-2.20720.014854
4-0.151417-1.47580.071648
5-0.006261-0.0610.475733
6-0.131605-1.28270.101354
7-0.143699-1.40060.082295
8-0.355409-3.46414e-04
9-0.337207-3.28670.000711
10-0.393738-3.83770.000112
11-0.057906-0.56440.286905
120.6660116.49150
13-0.320241-3.12130.001193
140.0829160.80820.210506
150.1461841.42480.078743
160.0690020.67250.251434
17-0.012574-0.12260.451357
18-0.032442-0.31620.376268
19-0.044922-0.43780.331247
20-0.011168-0.10890.456773
21-0.0369-0.35970.35995
22-0.023831-0.23230.408412
23-0.119667-1.16640.123193
240.0011010.01070.49573
25-0.102122-0.99540.161045
26-0.049949-0.48680.313745
27-0.068596-0.66860.25269
28-0.031243-0.30450.380701
29-0.056386-0.54960.291947
30-0.007031-0.06850.472755
31-0.010913-0.10640.457758
32-0.05802-0.56550.286531
330.0406130.39580.346553
34-0.01566-0.15260.439507
350.0232740.22680.410517
36-0.088111-0.85880.196307
370.024390.23770.406302
38-0.042615-0.41540.339407
390.0016380.0160.493648
40-0.005387-0.05250.479118
41-0.020937-0.20410.419368
420.0338970.33040.370917
43-0.040425-0.3940.347228
440.0453360.44190.329789
45-0.060949-0.59410.276944
46-0.010606-0.10340.458942
47-0.112631-1.09780.137535
48-0.047056-0.45860.323767
49-0.054469-0.53090.298364
50-0.054926-0.53530.29683
51-0.041772-0.40710.34241
52-0.061796-0.60230.274202
53-0.045658-0.4450.328659
54-0.141775-1.38190.085129
550.0461250.44960.32702
56-0.016192-0.15780.437467
57-0.013052-0.12720.449521
58-0.024318-0.2370.406574
590.0693860.67630.250249
60-0.081271-0.79210.215128

\begin{tabular}{lllllllll}
\hline
Partial Autocorrelation Function \tabularnewline
Time lag k & PACF(k) & T-STAT & P-value \tabularnewline
1 & 0.337047 & 3.2851 & 0.000714 \tabularnewline
2 & -0.312874 & -3.0495 & 0.001485 \tabularnewline
3 & -0.226455 & -2.2072 & 0.014854 \tabularnewline
4 & -0.151417 & -1.4758 & 0.071648 \tabularnewline
5 & -0.006261 & -0.061 & 0.475733 \tabularnewline
6 & -0.131605 & -1.2827 & 0.101354 \tabularnewline
7 & -0.143699 & -1.4006 & 0.082295 \tabularnewline
8 & -0.355409 & -3.4641 & 4e-04 \tabularnewline
9 & -0.337207 & -3.2867 & 0.000711 \tabularnewline
10 & -0.393738 & -3.8377 & 0.000112 \tabularnewline
11 & -0.057906 & -0.5644 & 0.286905 \tabularnewline
12 & 0.666011 & 6.4915 & 0 \tabularnewline
13 & -0.320241 & -3.1213 & 0.001193 \tabularnewline
14 & 0.082916 & 0.8082 & 0.210506 \tabularnewline
15 & 0.146184 & 1.4248 & 0.078743 \tabularnewline
16 & 0.069002 & 0.6725 & 0.251434 \tabularnewline
17 & -0.012574 & -0.1226 & 0.451357 \tabularnewline
18 & -0.032442 & -0.3162 & 0.376268 \tabularnewline
19 & -0.044922 & -0.4378 & 0.331247 \tabularnewline
20 & -0.011168 & -0.1089 & 0.456773 \tabularnewline
21 & -0.0369 & -0.3597 & 0.35995 \tabularnewline
22 & -0.023831 & -0.2323 & 0.408412 \tabularnewline
23 & -0.119667 & -1.1664 & 0.123193 \tabularnewline
24 & 0.001101 & 0.0107 & 0.49573 \tabularnewline
25 & -0.102122 & -0.9954 & 0.161045 \tabularnewline
26 & -0.049949 & -0.4868 & 0.313745 \tabularnewline
27 & -0.068596 & -0.6686 & 0.25269 \tabularnewline
28 & -0.031243 & -0.3045 & 0.380701 \tabularnewline
29 & -0.056386 & -0.5496 & 0.291947 \tabularnewline
30 & -0.007031 & -0.0685 & 0.472755 \tabularnewline
31 & -0.010913 & -0.1064 & 0.457758 \tabularnewline
32 & -0.05802 & -0.5655 & 0.286531 \tabularnewline
33 & 0.040613 & 0.3958 & 0.346553 \tabularnewline
34 & -0.01566 & -0.1526 & 0.439507 \tabularnewline
35 & 0.023274 & 0.2268 & 0.410517 \tabularnewline
36 & -0.088111 & -0.8588 & 0.196307 \tabularnewline
37 & 0.02439 & 0.2377 & 0.406302 \tabularnewline
38 & -0.042615 & -0.4154 & 0.339407 \tabularnewline
39 & 0.001638 & 0.016 & 0.493648 \tabularnewline
40 & -0.005387 & -0.0525 & 0.479118 \tabularnewline
41 & -0.020937 & -0.2041 & 0.419368 \tabularnewline
42 & 0.033897 & 0.3304 & 0.370917 \tabularnewline
43 & -0.040425 & -0.394 & 0.347228 \tabularnewline
44 & 0.045336 & 0.4419 & 0.329789 \tabularnewline
45 & -0.060949 & -0.5941 & 0.276944 \tabularnewline
46 & -0.010606 & -0.1034 & 0.458942 \tabularnewline
47 & -0.112631 & -1.0978 & 0.137535 \tabularnewline
48 & -0.047056 & -0.4586 & 0.323767 \tabularnewline
49 & -0.054469 & -0.5309 & 0.298364 \tabularnewline
50 & -0.054926 & -0.5353 & 0.29683 \tabularnewline
51 & -0.041772 & -0.4071 & 0.34241 \tabularnewline
52 & -0.061796 & -0.6023 & 0.274202 \tabularnewline
53 & -0.045658 & -0.445 & 0.328659 \tabularnewline
54 & -0.141775 & -1.3819 & 0.085129 \tabularnewline
55 & 0.046125 & 0.4496 & 0.32702 \tabularnewline
56 & -0.016192 & -0.1578 & 0.437467 \tabularnewline
57 & -0.013052 & -0.1272 & 0.449521 \tabularnewline
58 & -0.024318 & -0.237 & 0.406574 \tabularnewline
59 & 0.069386 & 0.6763 & 0.250249 \tabularnewline
60 & -0.081271 & -0.7921 & 0.215128 \tabularnewline
\hline
\end{tabular}
%Source: https://freestatistics.org/blog/index.php?pk=120503&T=2

[TABLE]
[ROW][C]Partial Autocorrelation Function[/C][/ROW]
[ROW][C]Time lag k[/C][C]PACF(k)[/C][C]T-STAT[/C][C]P-value[/C][/ROW]
[ROW][C]1[/C][C]0.337047[/C][C]3.2851[/C][C]0.000714[/C][/ROW]
[ROW][C]2[/C][C]-0.312874[/C][C]-3.0495[/C][C]0.001485[/C][/ROW]
[ROW][C]3[/C][C]-0.226455[/C][C]-2.2072[/C][C]0.014854[/C][/ROW]
[ROW][C]4[/C][C]-0.151417[/C][C]-1.4758[/C][C]0.071648[/C][/ROW]
[ROW][C]5[/C][C]-0.006261[/C][C]-0.061[/C][C]0.475733[/C][/ROW]
[ROW][C]6[/C][C]-0.131605[/C][C]-1.2827[/C][C]0.101354[/C][/ROW]
[ROW][C]7[/C][C]-0.143699[/C][C]-1.4006[/C][C]0.082295[/C][/ROW]
[ROW][C]8[/C][C]-0.355409[/C][C]-3.4641[/C][C]4e-04[/C][/ROW]
[ROW][C]9[/C][C]-0.337207[/C][C]-3.2867[/C][C]0.000711[/C][/ROW]
[ROW][C]10[/C][C]-0.393738[/C][C]-3.8377[/C][C]0.000112[/C][/ROW]
[ROW][C]11[/C][C]-0.057906[/C][C]-0.5644[/C][C]0.286905[/C][/ROW]
[ROW][C]12[/C][C]0.666011[/C][C]6.4915[/C][C]0[/C][/ROW]
[ROW][C]13[/C][C]-0.320241[/C][C]-3.1213[/C][C]0.001193[/C][/ROW]
[ROW][C]14[/C][C]0.082916[/C][C]0.8082[/C][C]0.210506[/C][/ROW]
[ROW][C]15[/C][C]0.146184[/C][C]1.4248[/C][C]0.078743[/C][/ROW]
[ROW][C]16[/C][C]0.069002[/C][C]0.6725[/C][C]0.251434[/C][/ROW]
[ROW][C]17[/C][C]-0.012574[/C][C]-0.1226[/C][C]0.451357[/C][/ROW]
[ROW][C]18[/C][C]-0.032442[/C][C]-0.3162[/C][C]0.376268[/C][/ROW]
[ROW][C]19[/C][C]-0.044922[/C][C]-0.4378[/C][C]0.331247[/C][/ROW]
[ROW][C]20[/C][C]-0.011168[/C][C]-0.1089[/C][C]0.456773[/C][/ROW]
[ROW][C]21[/C][C]-0.0369[/C][C]-0.3597[/C][C]0.35995[/C][/ROW]
[ROW][C]22[/C][C]-0.023831[/C][C]-0.2323[/C][C]0.408412[/C][/ROW]
[ROW][C]23[/C][C]-0.119667[/C][C]-1.1664[/C][C]0.123193[/C][/ROW]
[ROW][C]24[/C][C]0.001101[/C][C]0.0107[/C][C]0.49573[/C][/ROW]
[ROW][C]25[/C][C]-0.102122[/C][C]-0.9954[/C][C]0.161045[/C][/ROW]
[ROW][C]26[/C][C]-0.049949[/C][C]-0.4868[/C][C]0.313745[/C][/ROW]
[ROW][C]27[/C][C]-0.068596[/C][C]-0.6686[/C][C]0.25269[/C][/ROW]
[ROW][C]28[/C][C]-0.031243[/C][C]-0.3045[/C][C]0.380701[/C][/ROW]
[ROW][C]29[/C][C]-0.056386[/C][C]-0.5496[/C][C]0.291947[/C][/ROW]
[ROW][C]30[/C][C]-0.007031[/C][C]-0.0685[/C][C]0.472755[/C][/ROW]
[ROW][C]31[/C][C]-0.010913[/C][C]-0.1064[/C][C]0.457758[/C][/ROW]
[ROW][C]32[/C][C]-0.05802[/C][C]-0.5655[/C][C]0.286531[/C][/ROW]
[ROW][C]33[/C][C]0.040613[/C][C]0.3958[/C][C]0.346553[/C][/ROW]
[ROW][C]34[/C][C]-0.01566[/C][C]-0.1526[/C][C]0.439507[/C][/ROW]
[ROW][C]35[/C][C]0.023274[/C][C]0.2268[/C][C]0.410517[/C][/ROW]
[ROW][C]36[/C][C]-0.088111[/C][C]-0.8588[/C][C]0.196307[/C][/ROW]
[ROW][C]37[/C][C]0.02439[/C][C]0.2377[/C][C]0.406302[/C][/ROW]
[ROW][C]38[/C][C]-0.042615[/C][C]-0.4154[/C][C]0.339407[/C][/ROW]
[ROW][C]39[/C][C]0.001638[/C][C]0.016[/C][C]0.493648[/C][/ROW]
[ROW][C]40[/C][C]-0.005387[/C][C]-0.0525[/C][C]0.479118[/C][/ROW]
[ROW][C]41[/C][C]-0.020937[/C][C]-0.2041[/C][C]0.419368[/C][/ROW]
[ROW][C]42[/C][C]0.033897[/C][C]0.3304[/C][C]0.370917[/C][/ROW]
[ROW][C]43[/C][C]-0.040425[/C][C]-0.394[/C][C]0.347228[/C][/ROW]
[ROW][C]44[/C][C]0.045336[/C][C]0.4419[/C][C]0.329789[/C][/ROW]
[ROW][C]45[/C][C]-0.060949[/C][C]-0.5941[/C][C]0.276944[/C][/ROW]
[ROW][C]46[/C][C]-0.010606[/C][C]-0.1034[/C][C]0.458942[/C][/ROW]
[ROW][C]47[/C][C]-0.112631[/C][C]-1.0978[/C][C]0.137535[/C][/ROW]
[ROW][C]48[/C][C]-0.047056[/C][C]-0.4586[/C][C]0.323767[/C][/ROW]
[ROW][C]49[/C][C]-0.054469[/C][C]-0.5309[/C][C]0.298364[/C][/ROW]
[ROW][C]50[/C][C]-0.054926[/C][C]-0.5353[/C][C]0.29683[/C][/ROW]
[ROW][C]51[/C][C]-0.041772[/C][C]-0.4071[/C][C]0.34241[/C][/ROW]
[ROW][C]52[/C][C]-0.061796[/C][C]-0.6023[/C][C]0.274202[/C][/ROW]
[ROW][C]53[/C][C]-0.045658[/C][C]-0.445[/C][C]0.328659[/C][/ROW]
[ROW][C]54[/C][C]-0.141775[/C][C]-1.3819[/C][C]0.085129[/C][/ROW]
[ROW][C]55[/C][C]0.046125[/C][C]0.4496[/C][C]0.32702[/C][/ROW]
[ROW][C]56[/C][C]-0.016192[/C][C]-0.1578[/C][C]0.437467[/C][/ROW]
[ROW][C]57[/C][C]-0.013052[/C][C]-0.1272[/C][C]0.449521[/C][/ROW]
[ROW][C]58[/C][C]-0.024318[/C][C]-0.237[/C][C]0.406574[/C][/ROW]
[ROW][C]59[/C][C]0.069386[/C][C]0.6763[/C][C]0.250249[/C][/ROW]
[ROW][C]60[/C][C]-0.081271[/C][C]-0.7921[/C][C]0.215128[/C][/ROW]
[/TABLE]
Source: https://freestatistics.org/blog/index.php?pk=120503&T=2

Globally Unique Identifier (entire table): ba.freestatistics.org/blog/index.php?pk=120503&T=2

As an alternative you can also use a QR Code:  

The GUIDs for individual cells are displayed in the table below:

Partial Autocorrelation Function
Time lag kPACF(k)T-STATP-value
10.3370473.28510.000714
2-0.312874-3.04950.001485
3-0.226455-2.20720.014854
4-0.151417-1.47580.071648
5-0.006261-0.0610.475733
6-0.131605-1.28270.101354
7-0.143699-1.40060.082295
8-0.355409-3.46414e-04
9-0.337207-3.28670.000711
10-0.393738-3.83770.000112
11-0.057906-0.56440.286905
120.6660116.49150
13-0.320241-3.12130.001193
140.0829160.80820.210506
150.1461841.42480.078743
160.0690020.67250.251434
17-0.012574-0.12260.451357
18-0.032442-0.31620.376268
19-0.044922-0.43780.331247
20-0.011168-0.10890.456773
21-0.0369-0.35970.35995
22-0.023831-0.23230.408412
23-0.119667-1.16640.123193
240.0011010.01070.49573
25-0.102122-0.99540.161045
26-0.049949-0.48680.313745
27-0.068596-0.66860.25269
28-0.031243-0.30450.380701
29-0.056386-0.54960.291947
30-0.007031-0.06850.472755
31-0.010913-0.10640.457758
32-0.05802-0.56550.286531
330.0406130.39580.346553
34-0.01566-0.15260.439507
350.0232740.22680.410517
36-0.088111-0.85880.196307
370.024390.23770.406302
38-0.042615-0.41540.339407
390.0016380.0160.493648
40-0.005387-0.05250.479118
41-0.020937-0.20410.419368
420.0338970.33040.370917
43-0.040425-0.3940.347228
440.0453360.44190.329789
45-0.060949-0.59410.276944
46-0.010606-0.10340.458942
47-0.112631-1.09780.137535
48-0.047056-0.45860.323767
49-0.054469-0.53090.298364
50-0.054926-0.53530.29683
51-0.041772-0.40710.34241
52-0.061796-0.60230.274202
53-0.045658-0.4450.328659
54-0.141775-1.38190.085129
550.0461250.44960.32702
56-0.016192-0.15780.437467
57-0.013052-0.12720.449521
58-0.024318-0.2370.406574
590.0693860.67630.250249
60-0.081271-0.79210.215128


Parameters (Session):
par1 = 60 ; par2 = 1 ; par3 = 1 ; par4 = 0 ; par5 = 12 ; par6 = White Noise ; par7 = 0.95 ;
Parameters (R input):
par1 = 60 ; par2 = 1 ; par3 = 1 ; par4 = 0 ; par5 = 12 ; par6 = White Noise ; par7 = 0.95 ; par8 = ;
R code (references can be found in the software module):
if (par1 == 'Default') {
par1 = 10*log10(length(x))
} else {
par1 <- as.numeric(par1)
}
par2 <- as.numeric(par2)
par3 <- as.numeric(par3)
par4 <- as.numeric(par4)
par5 <- as.numeric(par5)
if (par6 == 'White Noise') par6 <- 'white' else par6 <- 'ma'
par7 <- as.numeric(par7)
if (par8 != '') par8 <- as.numeric(par8)
ox <- x
if (par8 == '') {
if (par2 == 0) {
x <- log(x)
} else {
x <- (x ^ par2 - 1) / par2
}
} else {
x <- log(x,base=par8)
}
if (par3 > 0) x <- diff(x,lag=1,difference=par3)
if (par4 > 0) x <- diff(x,lag=par5,difference=par4)
bitmap(file='picts.png')
op <- par(mfrow=c(2,1))
plot(ox,type='l',main='Original Time Series',xlab='time',ylab='value')
if (par8=='') {
mytitle <- paste('Working Time Series (lambda=',par2,', d=',par3,', D=',par4,')',sep='')
mysub <- paste('(lambda=',par2,', d=',par3,', D=',par4,', CI=', par7, ', CI type=',par6,')',sep='')
} else {
mytitle <- paste('Working Time Series (base=',par8,', d=',par3,', D=',par4,')',sep='')
mysub <- paste('(base=',par8,', d=',par3,', D=',par4,', CI=', par7, ', CI type=',par6,')',sep='')
}
plot(x,type='l', main=mytitle,xlab='time',ylab='value')
par(op)
dev.off()
bitmap(file='pic1.png')
racf <- acf(x, par1, main='Autocorrelation', xlab='time lag', ylab='ACF', ci.type=par6, ci=par7, sub=mysub)
dev.off()
bitmap(file='pic2.png')
rpacf <- pacf(x,par1,main='Partial Autocorrelation',xlab='lags',ylab='PACF',sub=mysub)
dev.off()
(myacf <- c(racf$acf))
(mypacf <- c(rpacf$acf))
lengthx <- length(x)
sqrtn <- sqrt(lengthx)
load(file='createtable')
a<-table.start()
a<-table.row.start(a)
a<-table.element(a,'Autocorrelation Function',4,TRUE)
a<-table.row.end(a)
a<-table.row.start(a)
a<-table.element(a,'Time lag k',header=TRUE)
a<-table.element(a,hyperlink('basics.htm','ACF(k)','click here for more information about the Autocorrelation Function'),header=TRUE)
a<-table.element(a,'T-STAT',header=TRUE)
a<-table.element(a,'P-value',header=TRUE)
a<-table.row.end(a)
for (i in 2:(par1+1)) {
a<-table.row.start(a)
a<-table.element(a,i-1,header=TRUE)
a<-table.element(a,round(myacf[i],6))
mytstat <- myacf[i]*sqrtn
a<-table.element(a,round(mytstat,4))
a<-table.element(a,round(1-pt(abs(mytstat),lengthx),6))
a<-table.row.end(a)
}
a<-table.end(a)
table.save(a,file='mytable.tab')
a<-table.start()
a<-table.row.start(a)
a<-table.element(a,'Partial Autocorrelation Function',4,TRUE)
a<-table.row.end(a)
a<-table.row.start(a)
a<-table.element(a,'Time lag k',header=TRUE)
a<-table.element(a,hyperlink('basics.htm','PACF(k)','click here for more information about the Partial Autocorrelation Function'),header=TRUE)
a<-table.element(a,'T-STAT',header=TRUE)
a<-table.element(a,'P-value',header=TRUE)
a<-table.row.end(a)
for (i in 1:par1) {
a<-table.row.start(a)
a<-table.element(a,i,header=TRUE)
a<-table.element(a,round(mypacf[i],6))
mytstat <- mypacf[i]*sqrtn
a<-table.element(a,round(mytstat,4))
a<-table.element(a,round(1-pt(abs(mytstat),lengthx),6))
a<-table.row.end(a)
}
a<-table.end(a)
table.save(a,file='mytable1.tab')