Free Statistics

of Irreproducible Research!

Author's title

Author*Unverified author*
R Software Modulerwasp_autocorrelation.wasp
Title produced by software(Partial) Autocorrelation Function
Date of computationMon, 11 Apr 2011 21:16:33 +0000
Cite this page as followsStatistical Computations at FreeStatistics.org, Office for Research Development and Education, URL https://freestatistics.org/blog/index.php?v=date/2011/Apr/11/t1302556444x2ddr84jz0pcamp.htm/, Retrieved Thu, 09 May 2024 13:14:20 +0000
Statistical Computations at FreeStatistics.org, Office for Research Development and Education, URL https://freestatistics.org/blog/index.php?pk=120502, Retrieved Thu, 09 May 2024 13:14:20 +0000
QR Codes:

Original text written by user:
IsPrivate?No (this computation is public)
User-defined keywordsKDGP2W12
Estimated Impact115
Family? (F = Feedback message, R = changed R code, M = changed R Module, P = changed Parameters, D = changed Data)
-       [(Partial) Autocorrelation Function] [Opdracht6bis: aut...] [2011-04-11 21:16:33] [d324b46bbfd5b5abf133f66a31553d9d] [Current]
Feedback Forum

Post a new message
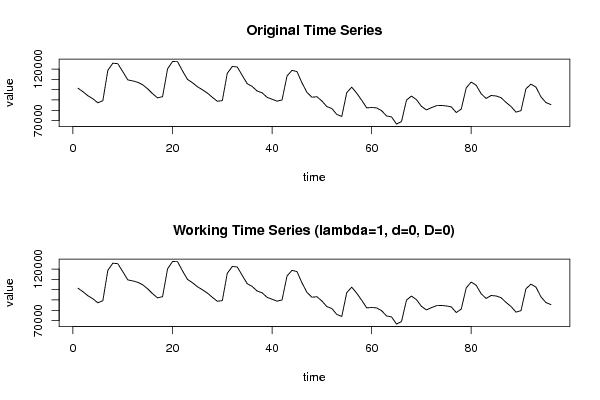
Dataseries X:
101397
97994
94044
91159
87239
89235
118647
125620
125154
117529
109459
108483
107137
104699
100804
96066
91971
93228
120144
127233
127166
118194
109940
106683
102834
99882
96666
92540
88744
89321
115870
122401
122030
113802
105791
103076
98658
96945
92497
90687
88796
90015
113228
118711
117460
106556
97347
92657
93118
89037
83570
81693
75956
73993
97088
102394
96549
89727
82336
82653
82303
79596
74472
73562
66618
69029
89899
93774
90305
83799
80320
82497
84420
84646
84186
83269
77793
81145
101691
107357
104253
95963
91432
94324
93855
92183
87600
83641
78195
79604
100846
105293
102518
93132
87479
85476


Summary of computational transaction
Raw Inputview raw input (R code)
Raw Outputview raw output of R engine
Computing time2 seconds
R Server'Herman Ole Andreas Wold' @ www.yougetit.org

\begin{tabular}{lllllllll}
\hline
Summary of computational transaction \tabularnewline
Raw Input & view raw input (R code)  \tabularnewline
Raw Output & view raw output of R engine  \tabularnewline
Computing time & 2 seconds \tabularnewline
R Server & 'Herman Ole Andreas Wold' @ www.yougetit.org \tabularnewline
\hline
\end{tabular}
%Source: https://freestatistics.org/blog/index.php?pk=120502&T=0

[TABLE]
[ROW][C]Summary of computational transaction[/C][/ROW]
[ROW][C]Raw Input[/C][C]view raw input (R code) [/C][/ROW]
[ROW][C]Raw Output[/C][C]view raw output of R engine [/C][/ROW]
[ROW][C]Computing time[/C][C]2 seconds[/C][/ROW]
[ROW][C]R Server[/C][C]'Herman Ole Andreas Wold' @ www.yougetit.org[/C][/ROW]
[/TABLE]
Source: https://freestatistics.org/blog/index.php?pk=120502&T=0

Globally Unique Identifier (entire table): ba.freestatistics.org/blog/index.php?pk=120502&T=0

As an alternative you can also use a QR Code:  

The GUIDs for individual cells are displayed in the table below:

Summary of computational transaction
Raw Inputview raw input (R code)
Raw Outputview raw output of R engine
Computing time2 seconds
R Server'Herman Ole Andreas Wold' @ www.yougetit.org


Autocorrelation Function
Time lag kACF(k)T-STATP-value
10.8206418.04060
20.5249675.14361e-06
30.2910892.85210.002659
40.1894681.85640.033232
50.192431.88540.031199
60.2056282.01470.023365
70.182231.78550.038671
80.1586231.55420.061715
90.219872.15430.016861
100.3897923.81920.000119
110.6160926.03640
120.7396537.24710
130.5695365.58030
140.3007492.94670.002015
150.0887970.870.193226
16-0.005387-0.05280.479009
17-0.007811-0.07650.469578
18-0.001716-0.01680.493311
19-0.025082-0.24580.4032
20-0.04541-0.44490.328687
210.008610.08440.466473
220.1520281.48960.069809
230.3386993.31860.00064
240.4371354.2832.2e-05
250.2875042.8170.002943
260.0602950.59080.278032
27-0.114188-1.11880.133007
28-0.185626-1.81880.036033
29-0.180697-1.77050.039913
30-0.171124-1.67670.048431
31-0.191529-1.87660.031805
32-0.210273-2.06020.021041
33-0.161964-1.58690.05791
34-0.043227-0.42350.336424
350.1112711.09020.139172
360.187511.83720.034636
370.0608930.59660.276079
38-0.125255-1.22720.111366
39-0.258324-2.5310.006499
40-0.303622-2.97490.001854
41-0.289716-2.83860.002765
42-0.278834-2.7320.003747
43-0.303437-2.97310.001864
44-0.322527-3.16010.001055
45-0.284139-2.7840.003234
46-0.184068-1.80350.037224
47-0.052965-0.5190.302495
480.0188750.18490.426835
49-0.072903-0.71430.238388
50-0.206038-2.01880.023151
51-0.290717-2.84840.002688
52-0.3035-2.97370.00186
53-0.273978-2.68440.00428
54-0.251127-2.46050.00783
55-0.256672-2.51490.006785
56-0.260453-2.55190.006146
57-0.220852-2.16390.016477
58-0.137249-1.34480.090936
59-0.029279-0.28690.387412
600.0274910.26940.394115

\begin{tabular}{lllllllll}
\hline
Autocorrelation Function \tabularnewline
Time lag k & ACF(k) & T-STAT & P-value \tabularnewline
1 & 0.820641 & 8.0406 & 0 \tabularnewline
2 & 0.524967 & 5.1436 & 1e-06 \tabularnewline
3 & 0.291089 & 2.8521 & 0.002659 \tabularnewline
4 & 0.189468 & 1.8564 & 0.033232 \tabularnewline
5 & 0.19243 & 1.8854 & 0.031199 \tabularnewline
6 & 0.205628 & 2.0147 & 0.023365 \tabularnewline
7 & 0.18223 & 1.7855 & 0.038671 \tabularnewline
8 & 0.158623 & 1.5542 & 0.061715 \tabularnewline
9 & 0.21987 & 2.1543 & 0.016861 \tabularnewline
10 & 0.389792 & 3.8192 & 0.000119 \tabularnewline
11 & 0.616092 & 6.0364 & 0 \tabularnewline
12 & 0.739653 & 7.2471 & 0 \tabularnewline
13 & 0.569536 & 5.5803 & 0 \tabularnewline
14 & 0.300749 & 2.9467 & 0.002015 \tabularnewline
15 & 0.088797 & 0.87 & 0.193226 \tabularnewline
16 & -0.005387 & -0.0528 & 0.479009 \tabularnewline
17 & -0.007811 & -0.0765 & 0.469578 \tabularnewline
18 & -0.001716 & -0.0168 & 0.493311 \tabularnewline
19 & -0.025082 & -0.2458 & 0.4032 \tabularnewline
20 & -0.04541 & -0.4449 & 0.328687 \tabularnewline
21 & 0.00861 & 0.0844 & 0.466473 \tabularnewline
22 & 0.152028 & 1.4896 & 0.069809 \tabularnewline
23 & 0.338699 & 3.3186 & 0.00064 \tabularnewline
24 & 0.437135 & 4.283 & 2.2e-05 \tabularnewline
25 & 0.287504 & 2.817 & 0.002943 \tabularnewline
26 & 0.060295 & 0.5908 & 0.278032 \tabularnewline
27 & -0.114188 & -1.1188 & 0.133007 \tabularnewline
28 & -0.185626 & -1.8188 & 0.036033 \tabularnewline
29 & -0.180697 & -1.7705 & 0.039913 \tabularnewline
30 & -0.171124 & -1.6767 & 0.048431 \tabularnewline
31 & -0.191529 & -1.8766 & 0.031805 \tabularnewline
32 & -0.210273 & -2.0602 & 0.021041 \tabularnewline
33 & -0.161964 & -1.5869 & 0.05791 \tabularnewline
34 & -0.043227 & -0.4235 & 0.336424 \tabularnewline
35 & 0.111271 & 1.0902 & 0.139172 \tabularnewline
36 & 0.18751 & 1.8372 & 0.034636 \tabularnewline
37 & 0.060893 & 0.5966 & 0.276079 \tabularnewline
38 & -0.125255 & -1.2272 & 0.111366 \tabularnewline
39 & -0.258324 & -2.531 & 0.006499 \tabularnewline
40 & -0.303622 & -2.9749 & 0.001854 \tabularnewline
41 & -0.289716 & -2.8386 & 0.002765 \tabularnewline
42 & -0.278834 & -2.732 & 0.003747 \tabularnewline
43 & -0.303437 & -2.9731 & 0.001864 \tabularnewline
44 & -0.322527 & -3.1601 & 0.001055 \tabularnewline
45 & -0.284139 & -2.784 & 0.003234 \tabularnewline
46 & -0.184068 & -1.8035 & 0.037224 \tabularnewline
47 & -0.052965 & -0.519 & 0.302495 \tabularnewline
48 & 0.018875 & 0.1849 & 0.426835 \tabularnewline
49 & -0.072903 & -0.7143 & 0.238388 \tabularnewline
50 & -0.206038 & -2.0188 & 0.023151 \tabularnewline
51 & -0.290717 & -2.8484 & 0.002688 \tabularnewline
52 & -0.3035 & -2.9737 & 0.00186 \tabularnewline
53 & -0.273978 & -2.6844 & 0.00428 \tabularnewline
54 & -0.251127 & -2.4605 & 0.00783 \tabularnewline
55 & -0.256672 & -2.5149 & 0.006785 \tabularnewline
56 & -0.260453 & -2.5519 & 0.006146 \tabularnewline
57 & -0.220852 & -2.1639 & 0.016477 \tabularnewline
58 & -0.137249 & -1.3448 & 0.090936 \tabularnewline
59 & -0.029279 & -0.2869 & 0.387412 \tabularnewline
60 & 0.027491 & 0.2694 & 0.394115 \tabularnewline
\hline
\end{tabular}
%Source: https://freestatistics.org/blog/index.php?pk=120502&T=1

[TABLE]
[ROW][C]Autocorrelation Function[/C][/ROW]
[ROW][C]Time lag k[/C][C]ACF(k)[/C][C]T-STAT[/C][C]P-value[/C][/ROW]
[ROW][C]1[/C][C]0.820641[/C][C]8.0406[/C][C]0[/C][/ROW]
[ROW][C]2[/C][C]0.524967[/C][C]5.1436[/C][C]1e-06[/C][/ROW]
[ROW][C]3[/C][C]0.291089[/C][C]2.8521[/C][C]0.002659[/C][/ROW]
[ROW][C]4[/C][C]0.189468[/C][C]1.8564[/C][C]0.033232[/C][/ROW]
[ROW][C]5[/C][C]0.19243[/C][C]1.8854[/C][C]0.031199[/C][/ROW]
[ROW][C]6[/C][C]0.205628[/C][C]2.0147[/C][C]0.023365[/C][/ROW]
[ROW][C]7[/C][C]0.18223[/C][C]1.7855[/C][C]0.038671[/C][/ROW]
[ROW][C]8[/C][C]0.158623[/C][C]1.5542[/C][C]0.061715[/C][/ROW]
[ROW][C]9[/C][C]0.21987[/C][C]2.1543[/C][C]0.016861[/C][/ROW]
[ROW][C]10[/C][C]0.389792[/C][C]3.8192[/C][C]0.000119[/C][/ROW]
[ROW][C]11[/C][C]0.616092[/C][C]6.0364[/C][C]0[/C][/ROW]
[ROW][C]12[/C][C]0.739653[/C][C]7.2471[/C][C]0[/C][/ROW]
[ROW][C]13[/C][C]0.569536[/C][C]5.5803[/C][C]0[/C][/ROW]
[ROW][C]14[/C][C]0.300749[/C][C]2.9467[/C][C]0.002015[/C][/ROW]
[ROW][C]15[/C][C]0.088797[/C][C]0.87[/C][C]0.193226[/C][/ROW]
[ROW][C]16[/C][C]-0.005387[/C][C]-0.0528[/C][C]0.479009[/C][/ROW]
[ROW][C]17[/C][C]-0.007811[/C][C]-0.0765[/C][C]0.469578[/C][/ROW]
[ROW][C]18[/C][C]-0.001716[/C][C]-0.0168[/C][C]0.493311[/C][/ROW]
[ROW][C]19[/C][C]-0.025082[/C][C]-0.2458[/C][C]0.4032[/C][/ROW]
[ROW][C]20[/C][C]-0.04541[/C][C]-0.4449[/C][C]0.328687[/C][/ROW]
[ROW][C]21[/C][C]0.00861[/C][C]0.0844[/C][C]0.466473[/C][/ROW]
[ROW][C]22[/C][C]0.152028[/C][C]1.4896[/C][C]0.069809[/C][/ROW]
[ROW][C]23[/C][C]0.338699[/C][C]3.3186[/C][C]0.00064[/C][/ROW]
[ROW][C]24[/C][C]0.437135[/C][C]4.283[/C][C]2.2e-05[/C][/ROW]
[ROW][C]25[/C][C]0.287504[/C][C]2.817[/C][C]0.002943[/C][/ROW]
[ROW][C]26[/C][C]0.060295[/C][C]0.5908[/C][C]0.278032[/C][/ROW]
[ROW][C]27[/C][C]-0.114188[/C][C]-1.1188[/C][C]0.133007[/C][/ROW]
[ROW][C]28[/C][C]-0.185626[/C][C]-1.8188[/C][C]0.036033[/C][/ROW]
[ROW][C]29[/C][C]-0.180697[/C][C]-1.7705[/C][C]0.039913[/C][/ROW]
[ROW][C]30[/C][C]-0.171124[/C][C]-1.6767[/C][C]0.048431[/C][/ROW]
[ROW][C]31[/C][C]-0.191529[/C][C]-1.8766[/C][C]0.031805[/C][/ROW]
[ROW][C]32[/C][C]-0.210273[/C][C]-2.0602[/C][C]0.021041[/C][/ROW]
[ROW][C]33[/C][C]-0.161964[/C][C]-1.5869[/C][C]0.05791[/C][/ROW]
[ROW][C]34[/C][C]-0.043227[/C][C]-0.4235[/C][C]0.336424[/C][/ROW]
[ROW][C]35[/C][C]0.111271[/C][C]1.0902[/C][C]0.139172[/C][/ROW]
[ROW][C]36[/C][C]0.18751[/C][C]1.8372[/C][C]0.034636[/C][/ROW]
[ROW][C]37[/C][C]0.060893[/C][C]0.5966[/C][C]0.276079[/C][/ROW]
[ROW][C]38[/C][C]-0.125255[/C][C]-1.2272[/C][C]0.111366[/C][/ROW]
[ROW][C]39[/C][C]-0.258324[/C][C]-2.531[/C][C]0.006499[/C][/ROW]
[ROW][C]40[/C][C]-0.303622[/C][C]-2.9749[/C][C]0.001854[/C][/ROW]
[ROW][C]41[/C][C]-0.289716[/C][C]-2.8386[/C][C]0.002765[/C][/ROW]
[ROW][C]42[/C][C]-0.278834[/C][C]-2.732[/C][C]0.003747[/C][/ROW]
[ROW][C]43[/C][C]-0.303437[/C][C]-2.9731[/C][C]0.001864[/C][/ROW]
[ROW][C]44[/C][C]-0.322527[/C][C]-3.1601[/C][C]0.001055[/C][/ROW]
[ROW][C]45[/C][C]-0.284139[/C][C]-2.784[/C][C]0.003234[/C][/ROW]
[ROW][C]46[/C][C]-0.184068[/C][C]-1.8035[/C][C]0.037224[/C][/ROW]
[ROW][C]47[/C][C]-0.052965[/C][C]-0.519[/C][C]0.302495[/C][/ROW]
[ROW][C]48[/C][C]0.018875[/C][C]0.1849[/C][C]0.426835[/C][/ROW]
[ROW][C]49[/C][C]-0.072903[/C][C]-0.7143[/C][C]0.238388[/C][/ROW]
[ROW][C]50[/C][C]-0.206038[/C][C]-2.0188[/C][C]0.023151[/C][/ROW]
[ROW][C]51[/C][C]-0.290717[/C][C]-2.8484[/C][C]0.002688[/C][/ROW]
[ROW][C]52[/C][C]-0.3035[/C][C]-2.9737[/C][C]0.00186[/C][/ROW]
[ROW][C]53[/C][C]-0.273978[/C][C]-2.6844[/C][C]0.00428[/C][/ROW]
[ROW][C]54[/C][C]-0.251127[/C][C]-2.4605[/C][C]0.00783[/C][/ROW]
[ROW][C]55[/C][C]-0.256672[/C][C]-2.5149[/C][C]0.006785[/C][/ROW]
[ROW][C]56[/C][C]-0.260453[/C][C]-2.5519[/C][C]0.006146[/C][/ROW]
[ROW][C]57[/C][C]-0.220852[/C][C]-2.1639[/C][C]0.016477[/C][/ROW]
[ROW][C]58[/C][C]-0.137249[/C][C]-1.3448[/C][C]0.090936[/C][/ROW]
[ROW][C]59[/C][C]-0.029279[/C][C]-0.2869[/C][C]0.387412[/C][/ROW]
[ROW][C]60[/C][C]0.027491[/C][C]0.2694[/C][C]0.394115[/C][/ROW]
[/TABLE]
Source: https://freestatistics.org/blog/index.php?pk=120502&T=1

Globally Unique Identifier (entire table): ba.freestatistics.org/blog/index.php?pk=120502&T=1

As an alternative you can also use a QR Code:  

The GUIDs for individual cells are displayed in the table below:

Autocorrelation Function
Time lag kACF(k)T-STATP-value
10.8206418.04060
20.5249675.14361e-06
30.2910892.85210.002659
40.1894681.85640.033232
50.192431.88540.031199
60.2056282.01470.023365
70.182231.78550.038671
80.1586231.55420.061715
90.219872.15430.016861
100.3897923.81920.000119
110.6160926.03640
120.7396537.24710
130.5695365.58030
140.3007492.94670.002015
150.0887970.870.193226
16-0.005387-0.05280.479009
17-0.007811-0.07650.469578
18-0.001716-0.01680.493311
19-0.025082-0.24580.4032
20-0.04541-0.44490.328687
210.008610.08440.466473
220.1520281.48960.069809
230.3386993.31860.00064
240.4371354.2832.2e-05
250.2875042.8170.002943
260.0602950.59080.278032
27-0.114188-1.11880.133007
28-0.185626-1.81880.036033
29-0.180697-1.77050.039913
30-0.171124-1.67670.048431
31-0.191529-1.87660.031805
32-0.210273-2.06020.021041
33-0.161964-1.58690.05791
34-0.043227-0.42350.336424
350.1112711.09020.139172
360.187511.83720.034636
370.0608930.59660.276079
38-0.125255-1.22720.111366
39-0.258324-2.5310.006499
40-0.303622-2.97490.001854
41-0.289716-2.83860.002765
42-0.278834-2.7320.003747
43-0.303437-2.97310.001864
44-0.322527-3.16010.001055
45-0.284139-2.7840.003234
46-0.184068-1.80350.037224
47-0.052965-0.5190.302495
480.0188750.18490.426835
49-0.072903-0.71430.238388
50-0.206038-2.01880.023151
51-0.290717-2.84840.002688
52-0.3035-2.97370.00186
53-0.273978-2.68440.00428
54-0.251127-2.46050.00783
55-0.256672-2.51490.006785
56-0.260453-2.55190.006146
57-0.220852-2.16390.016477
58-0.137249-1.34480.090936
59-0.029279-0.28690.387412
600.0274910.26940.394115


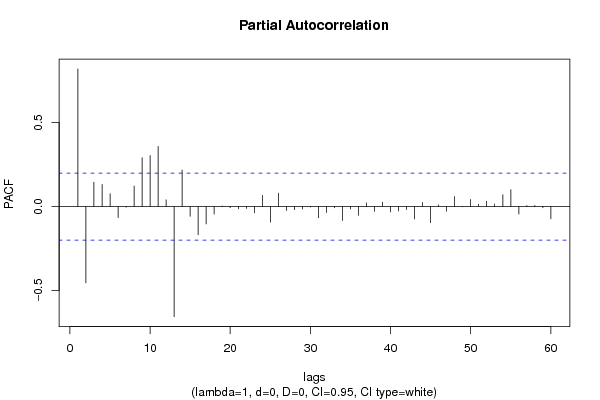
Partial Autocorrelation Function
Time lag kPACF(k)T-STATP-value
10.8206418.04060
2-0.454711-4.45521.1e-05
30.1449261.420.079427
40.1316561.290.100082
50.0761660.74630.228664
6-0.06543-0.64110.261498
7-0.003673-0.0360.485684
80.1218341.19370.117764
90.2912242.85340.002649
100.3036982.97560.00185
110.3578573.50630.000346
120.0399440.39140.348195
13-0.656723-6.43450
140.2173882.130.017866
15-0.057834-0.56670.286136
16-0.168087-1.64690.051423
17-0.10358-1.01490.156358
18-0.044454-0.43560.332068
190.003740.03660.485421
20-0.007556-0.0740.47057
21-0.013192-0.12930.448712
22-0.011051-0.10830.457
23-0.037508-0.36750.357026
240.0668350.65480.257066
25-0.093156-0.91270.181832
260.0796050.780.218666
27-0.02383-0.23350.407942
28-0.018393-0.18020.428681
29-0.014632-0.14340.443151
30-0.002527-0.02480.49015
31-0.066897-0.65550.256872
32-0.036069-0.35340.362281
33-0.007718-0.07560.46994
34-0.083527-0.81840.207578
35-0.015061-0.14760.441499
36-0.052419-0.51360.304358
370.0217320.21290.415915
38-0.028363-0.27790.390842
390.0261970.25670.398989
40-0.031708-0.31070.378361
41-0.026069-0.25540.399471
42-0.017955-0.17590.430364
43-0.073506-0.72020.236572
440.0240420.23560.407136
45-0.09616-0.94220.174235
460.009180.08990.464261
47-0.027367-0.26810.394582
480.0592110.58010.281588
49-0.001406-0.01380.494518
500.0419810.41130.340875
510.0136540.13380.446927
520.0312590.30630.380028
530.014630.14330.443158
540.0700930.68680.246941
550.0997280.97710.165481
56-0.044642-0.43740.331402
570.0056750.05560.477887
580.0062970.06170.475466
59-0.007313-0.07170.471514
60-0.073189-0.71710.237525

\begin{tabular}{lllllllll}
\hline
Partial Autocorrelation Function \tabularnewline
Time lag k & PACF(k) & T-STAT & P-value \tabularnewline
1 & 0.820641 & 8.0406 & 0 \tabularnewline
2 & -0.454711 & -4.4552 & 1.1e-05 \tabularnewline
3 & 0.144926 & 1.42 & 0.079427 \tabularnewline
4 & 0.131656 & 1.29 & 0.100082 \tabularnewline
5 & 0.076166 & 0.7463 & 0.228664 \tabularnewline
6 & -0.06543 & -0.6411 & 0.261498 \tabularnewline
7 & -0.003673 & -0.036 & 0.485684 \tabularnewline
8 & 0.121834 & 1.1937 & 0.117764 \tabularnewline
9 & 0.291224 & 2.8534 & 0.002649 \tabularnewline
10 & 0.303698 & 2.9756 & 0.00185 \tabularnewline
11 & 0.357857 & 3.5063 & 0.000346 \tabularnewline
12 & 0.039944 & 0.3914 & 0.348195 \tabularnewline
13 & -0.656723 & -6.4345 & 0 \tabularnewline
14 & 0.217388 & 2.13 & 0.017866 \tabularnewline
15 & -0.057834 & -0.5667 & 0.286136 \tabularnewline
16 & -0.168087 & -1.6469 & 0.051423 \tabularnewline
17 & -0.10358 & -1.0149 & 0.156358 \tabularnewline
18 & -0.044454 & -0.4356 & 0.332068 \tabularnewline
19 & 0.00374 & 0.0366 & 0.485421 \tabularnewline
20 & -0.007556 & -0.074 & 0.47057 \tabularnewline
21 & -0.013192 & -0.1293 & 0.448712 \tabularnewline
22 & -0.011051 & -0.1083 & 0.457 \tabularnewline
23 & -0.037508 & -0.3675 & 0.357026 \tabularnewline
24 & 0.066835 & 0.6548 & 0.257066 \tabularnewline
25 & -0.093156 & -0.9127 & 0.181832 \tabularnewline
26 & 0.079605 & 0.78 & 0.218666 \tabularnewline
27 & -0.02383 & -0.2335 & 0.407942 \tabularnewline
28 & -0.018393 & -0.1802 & 0.428681 \tabularnewline
29 & -0.014632 & -0.1434 & 0.443151 \tabularnewline
30 & -0.002527 & -0.0248 & 0.49015 \tabularnewline
31 & -0.066897 & -0.6555 & 0.256872 \tabularnewline
32 & -0.036069 & -0.3534 & 0.362281 \tabularnewline
33 & -0.007718 & -0.0756 & 0.46994 \tabularnewline
34 & -0.083527 & -0.8184 & 0.207578 \tabularnewline
35 & -0.015061 & -0.1476 & 0.441499 \tabularnewline
36 & -0.052419 & -0.5136 & 0.304358 \tabularnewline
37 & 0.021732 & 0.2129 & 0.415915 \tabularnewline
38 & -0.028363 & -0.2779 & 0.390842 \tabularnewline
39 & 0.026197 & 0.2567 & 0.398989 \tabularnewline
40 & -0.031708 & -0.3107 & 0.378361 \tabularnewline
41 & -0.026069 & -0.2554 & 0.399471 \tabularnewline
42 & -0.017955 & -0.1759 & 0.430364 \tabularnewline
43 & -0.073506 & -0.7202 & 0.236572 \tabularnewline
44 & 0.024042 & 0.2356 & 0.407136 \tabularnewline
45 & -0.09616 & -0.9422 & 0.174235 \tabularnewline
46 & 0.00918 & 0.0899 & 0.464261 \tabularnewline
47 & -0.027367 & -0.2681 & 0.394582 \tabularnewline
48 & 0.059211 & 0.5801 & 0.281588 \tabularnewline
49 & -0.001406 & -0.0138 & 0.494518 \tabularnewline
50 & 0.041981 & 0.4113 & 0.340875 \tabularnewline
51 & 0.013654 & 0.1338 & 0.446927 \tabularnewline
52 & 0.031259 & 0.3063 & 0.380028 \tabularnewline
53 & 0.01463 & 0.1433 & 0.443158 \tabularnewline
54 & 0.070093 & 0.6868 & 0.246941 \tabularnewline
55 & 0.099728 & 0.9771 & 0.165481 \tabularnewline
56 & -0.044642 & -0.4374 & 0.331402 \tabularnewline
57 & 0.005675 & 0.0556 & 0.477887 \tabularnewline
58 & 0.006297 & 0.0617 & 0.475466 \tabularnewline
59 & -0.007313 & -0.0717 & 0.471514 \tabularnewline
60 & -0.073189 & -0.7171 & 0.237525 \tabularnewline
\hline
\end{tabular}
%Source: https://freestatistics.org/blog/index.php?pk=120502&T=2

[TABLE]
[ROW][C]Partial Autocorrelation Function[/C][/ROW]
[ROW][C]Time lag k[/C][C]PACF(k)[/C][C]T-STAT[/C][C]P-value[/C][/ROW]
[ROW][C]1[/C][C]0.820641[/C][C]8.0406[/C][C]0[/C][/ROW]
[ROW][C]2[/C][C]-0.454711[/C][C]-4.4552[/C][C]1.1e-05[/C][/ROW]
[ROW][C]3[/C][C]0.144926[/C][C]1.42[/C][C]0.079427[/C][/ROW]
[ROW][C]4[/C][C]0.131656[/C][C]1.29[/C][C]0.100082[/C][/ROW]
[ROW][C]5[/C][C]0.076166[/C][C]0.7463[/C][C]0.228664[/C][/ROW]
[ROW][C]6[/C][C]-0.06543[/C][C]-0.6411[/C][C]0.261498[/C][/ROW]
[ROW][C]7[/C][C]-0.003673[/C][C]-0.036[/C][C]0.485684[/C][/ROW]
[ROW][C]8[/C][C]0.121834[/C][C]1.1937[/C][C]0.117764[/C][/ROW]
[ROW][C]9[/C][C]0.291224[/C][C]2.8534[/C][C]0.002649[/C][/ROW]
[ROW][C]10[/C][C]0.303698[/C][C]2.9756[/C][C]0.00185[/C][/ROW]
[ROW][C]11[/C][C]0.357857[/C][C]3.5063[/C][C]0.000346[/C][/ROW]
[ROW][C]12[/C][C]0.039944[/C][C]0.3914[/C][C]0.348195[/C][/ROW]
[ROW][C]13[/C][C]-0.656723[/C][C]-6.4345[/C][C]0[/C][/ROW]
[ROW][C]14[/C][C]0.217388[/C][C]2.13[/C][C]0.017866[/C][/ROW]
[ROW][C]15[/C][C]-0.057834[/C][C]-0.5667[/C][C]0.286136[/C][/ROW]
[ROW][C]16[/C][C]-0.168087[/C][C]-1.6469[/C][C]0.051423[/C][/ROW]
[ROW][C]17[/C][C]-0.10358[/C][C]-1.0149[/C][C]0.156358[/C][/ROW]
[ROW][C]18[/C][C]-0.044454[/C][C]-0.4356[/C][C]0.332068[/C][/ROW]
[ROW][C]19[/C][C]0.00374[/C][C]0.0366[/C][C]0.485421[/C][/ROW]
[ROW][C]20[/C][C]-0.007556[/C][C]-0.074[/C][C]0.47057[/C][/ROW]
[ROW][C]21[/C][C]-0.013192[/C][C]-0.1293[/C][C]0.448712[/C][/ROW]
[ROW][C]22[/C][C]-0.011051[/C][C]-0.1083[/C][C]0.457[/C][/ROW]
[ROW][C]23[/C][C]-0.037508[/C][C]-0.3675[/C][C]0.357026[/C][/ROW]
[ROW][C]24[/C][C]0.066835[/C][C]0.6548[/C][C]0.257066[/C][/ROW]
[ROW][C]25[/C][C]-0.093156[/C][C]-0.9127[/C][C]0.181832[/C][/ROW]
[ROW][C]26[/C][C]0.079605[/C][C]0.78[/C][C]0.218666[/C][/ROW]
[ROW][C]27[/C][C]-0.02383[/C][C]-0.2335[/C][C]0.407942[/C][/ROW]
[ROW][C]28[/C][C]-0.018393[/C][C]-0.1802[/C][C]0.428681[/C][/ROW]
[ROW][C]29[/C][C]-0.014632[/C][C]-0.1434[/C][C]0.443151[/C][/ROW]
[ROW][C]30[/C][C]-0.002527[/C][C]-0.0248[/C][C]0.49015[/C][/ROW]
[ROW][C]31[/C][C]-0.066897[/C][C]-0.6555[/C][C]0.256872[/C][/ROW]
[ROW][C]32[/C][C]-0.036069[/C][C]-0.3534[/C][C]0.362281[/C][/ROW]
[ROW][C]33[/C][C]-0.007718[/C][C]-0.0756[/C][C]0.46994[/C][/ROW]
[ROW][C]34[/C][C]-0.083527[/C][C]-0.8184[/C][C]0.207578[/C][/ROW]
[ROW][C]35[/C][C]-0.015061[/C][C]-0.1476[/C][C]0.441499[/C][/ROW]
[ROW][C]36[/C][C]-0.052419[/C][C]-0.5136[/C][C]0.304358[/C][/ROW]
[ROW][C]37[/C][C]0.021732[/C][C]0.2129[/C][C]0.415915[/C][/ROW]
[ROW][C]38[/C][C]-0.028363[/C][C]-0.2779[/C][C]0.390842[/C][/ROW]
[ROW][C]39[/C][C]0.026197[/C][C]0.2567[/C][C]0.398989[/C][/ROW]
[ROW][C]40[/C][C]-0.031708[/C][C]-0.3107[/C][C]0.378361[/C][/ROW]
[ROW][C]41[/C][C]-0.026069[/C][C]-0.2554[/C][C]0.399471[/C][/ROW]
[ROW][C]42[/C][C]-0.017955[/C][C]-0.1759[/C][C]0.430364[/C][/ROW]
[ROW][C]43[/C][C]-0.073506[/C][C]-0.7202[/C][C]0.236572[/C][/ROW]
[ROW][C]44[/C][C]0.024042[/C][C]0.2356[/C][C]0.407136[/C][/ROW]
[ROW][C]45[/C][C]-0.09616[/C][C]-0.9422[/C][C]0.174235[/C][/ROW]
[ROW][C]46[/C][C]0.00918[/C][C]0.0899[/C][C]0.464261[/C][/ROW]
[ROW][C]47[/C][C]-0.027367[/C][C]-0.2681[/C][C]0.394582[/C][/ROW]
[ROW][C]48[/C][C]0.059211[/C][C]0.5801[/C][C]0.281588[/C][/ROW]
[ROW][C]49[/C][C]-0.001406[/C][C]-0.0138[/C][C]0.494518[/C][/ROW]
[ROW][C]50[/C][C]0.041981[/C][C]0.4113[/C][C]0.340875[/C][/ROW]
[ROW][C]51[/C][C]0.013654[/C][C]0.1338[/C][C]0.446927[/C][/ROW]
[ROW][C]52[/C][C]0.031259[/C][C]0.3063[/C][C]0.380028[/C][/ROW]
[ROW][C]53[/C][C]0.01463[/C][C]0.1433[/C][C]0.443158[/C][/ROW]
[ROW][C]54[/C][C]0.070093[/C][C]0.6868[/C][C]0.246941[/C][/ROW]
[ROW][C]55[/C][C]0.099728[/C][C]0.9771[/C][C]0.165481[/C][/ROW]
[ROW][C]56[/C][C]-0.044642[/C][C]-0.4374[/C][C]0.331402[/C][/ROW]
[ROW][C]57[/C][C]0.005675[/C][C]0.0556[/C][C]0.477887[/C][/ROW]
[ROW][C]58[/C][C]0.006297[/C][C]0.0617[/C][C]0.475466[/C][/ROW]
[ROW][C]59[/C][C]-0.007313[/C][C]-0.0717[/C][C]0.471514[/C][/ROW]
[ROW][C]60[/C][C]-0.073189[/C][C]-0.7171[/C][C]0.237525[/C][/ROW]
[/TABLE]
Source: https://freestatistics.org/blog/index.php?pk=120502&T=2

Globally Unique Identifier (entire table): ba.freestatistics.org/blog/index.php?pk=120502&T=2

As an alternative you can also use a QR Code:  

The GUIDs for individual cells are displayed in the table below:

Partial Autocorrelation Function
Time lag kPACF(k)T-STATP-value
10.8206418.04060
2-0.454711-4.45521.1e-05
30.1449261.420.079427
40.1316561.290.100082
50.0761660.74630.228664
6-0.06543-0.64110.261498
7-0.003673-0.0360.485684
80.1218341.19370.117764
90.2912242.85340.002649
100.3036982.97560.00185
110.3578573.50630.000346
120.0399440.39140.348195
13-0.656723-6.43450
140.2173882.130.017866
15-0.057834-0.56670.286136
16-0.168087-1.64690.051423
17-0.10358-1.01490.156358
18-0.044454-0.43560.332068
190.003740.03660.485421
20-0.007556-0.0740.47057
21-0.013192-0.12930.448712
22-0.011051-0.10830.457
23-0.037508-0.36750.357026
240.0668350.65480.257066
25-0.093156-0.91270.181832
260.0796050.780.218666
27-0.02383-0.23350.407942
28-0.018393-0.18020.428681
29-0.014632-0.14340.443151
30-0.002527-0.02480.49015
31-0.066897-0.65550.256872
32-0.036069-0.35340.362281
33-0.007718-0.07560.46994
34-0.083527-0.81840.207578
35-0.015061-0.14760.441499
36-0.052419-0.51360.304358
370.0217320.21290.415915
38-0.028363-0.27790.390842
390.0261970.25670.398989
40-0.031708-0.31070.378361
41-0.026069-0.25540.399471
42-0.017955-0.17590.430364
43-0.073506-0.72020.236572
440.0240420.23560.407136
45-0.09616-0.94220.174235
460.009180.08990.464261
47-0.027367-0.26810.394582
480.0592110.58010.281588
49-0.001406-0.01380.494518
500.0419810.41130.340875
510.0136540.13380.446927
520.0312590.30630.380028
530.014630.14330.443158
540.0700930.68680.246941
550.0997280.97710.165481
56-0.044642-0.43740.331402
570.0056750.05560.477887
580.0062970.06170.475466
59-0.007313-0.07170.471514
60-0.073189-0.71710.237525


Parameters (Session):
par1 = 60 ; par2 = 1 ; par3 = 0 ; par4 = 0 ; par5 = 12 ; par6 = White Noise ; par7 = 0.95 ;
Parameters (R input):
par1 = 60 ; par2 = 1 ; par3 = 0 ; par4 = 0 ; par5 = 12 ; par6 = White Noise ; par7 = 0.95 ; par8 = ;
R code (references can be found in the software module):
if (par1 == 'Default') {
par1 = 10*log10(length(x))
} else {
par1 <- as.numeric(par1)
}
par2 <- as.numeric(par2)
par3 <- as.numeric(par3)
par4 <- as.numeric(par4)
par5 <- as.numeric(par5)
if (par6 == 'White Noise') par6 <- 'white' else par6 <- 'ma'
par7 <- as.numeric(par7)
if (par8 != '') par8 <- as.numeric(par8)
ox <- x
if (par8 == '') {
if (par2 == 0) {
x <- log(x)
} else {
x <- (x ^ par2 - 1) / par2
}
} else {
x <- log(x,base=par8)
}
if (par3 > 0) x <- diff(x,lag=1,difference=par3)
if (par4 > 0) x <- diff(x,lag=par5,difference=par4)
bitmap(file='picts.png')
op <- par(mfrow=c(2,1))
plot(ox,type='l',main='Original Time Series',xlab='time',ylab='value')
if (par8=='') {
mytitle <- paste('Working Time Series (lambda=',par2,', d=',par3,', D=',par4,')',sep='')
mysub <- paste('(lambda=',par2,', d=',par3,', D=',par4,', CI=', par7, ', CI type=',par6,')',sep='')
} else {
mytitle <- paste('Working Time Series (base=',par8,', d=',par3,', D=',par4,')',sep='')
mysub <- paste('(base=',par8,', d=',par3,', D=',par4,', CI=', par7, ', CI type=',par6,')',sep='')
}
plot(x,type='l', main=mytitle,xlab='time',ylab='value')
par(op)
dev.off()
bitmap(file='pic1.png')
racf <- acf(x, par1, main='Autocorrelation', xlab='time lag', ylab='ACF', ci.type=par6, ci=par7, sub=mysub)
dev.off()
bitmap(file='pic2.png')
rpacf <- pacf(x,par1,main='Partial Autocorrelation',xlab='lags',ylab='PACF',sub=mysub)
dev.off()
(myacf <- c(racf$acf))
(mypacf <- c(rpacf$acf))
lengthx <- length(x)
sqrtn <- sqrt(lengthx)
load(file='createtable')
a<-table.start()
a<-table.row.start(a)
a<-table.element(a,'Autocorrelation Function',4,TRUE)
a<-table.row.end(a)
a<-table.row.start(a)
a<-table.element(a,'Time lag k',header=TRUE)
a<-table.element(a,hyperlink('basics.htm','ACF(k)','click here for more information about the Autocorrelation Function'),header=TRUE)
a<-table.element(a,'T-STAT',header=TRUE)
a<-table.element(a,'P-value',header=TRUE)
a<-table.row.end(a)
for (i in 2:(par1+1)) {
a<-table.row.start(a)
a<-table.element(a,i-1,header=TRUE)
a<-table.element(a,round(myacf[i],6))
mytstat <- myacf[i]*sqrtn
a<-table.element(a,round(mytstat,4))
a<-table.element(a,round(1-pt(abs(mytstat),lengthx),6))
a<-table.row.end(a)
}
a<-table.end(a)
table.save(a,file='mytable.tab')
a<-table.start()
a<-table.row.start(a)
a<-table.element(a,'Partial Autocorrelation Function',4,TRUE)
a<-table.row.end(a)
a<-table.row.start(a)
a<-table.element(a,'Time lag k',header=TRUE)
a<-table.element(a,hyperlink('basics.htm','PACF(k)','click here for more information about the Partial Autocorrelation Function'),header=TRUE)
a<-table.element(a,'T-STAT',header=TRUE)
a<-table.element(a,'P-value',header=TRUE)
a<-table.row.end(a)
for (i in 1:par1) {
a<-table.row.start(a)
a<-table.element(a,i,header=TRUE)
a<-table.element(a,round(mypacf[i],6))
mytstat <- mypacf[i]*sqrtn
a<-table.element(a,round(mytstat,4))
a<-table.element(a,round(1-pt(abs(mytstat),lengthx),6))
a<-table.row.end(a)
}
a<-table.end(a)
table.save(a,file='mytable1.tab')