Free Statistics

of Irreproducible Research!

Author's title

Author*Unverified author*
R Software Modulerwasp_autocorrelation.wasp
Title produced by software(Partial) Autocorrelation Function
Date of computationMon, 11 Apr 2011 21:03:04 +0000
Cite this page as followsStatistical Computations at FreeStatistics.org, Office for Research Development and Education, URL https://freestatistics.org/blog/index.php?v=date/2011/Apr/11/t1302555603hgp0t1i6xfalbuh.htm/, Retrieved Thu, 09 May 2024 05:18:10 +0000
Statistical Computations at FreeStatistics.org, Office for Research Development and Education, URL https://freestatistics.org/blog/index.php?pk=120500, Retrieved Thu, 09 May 2024 05:18:10 +0000
QR Codes:

Original text written by user:
IsPrivate?No (this computation is public)
User-defined keywords KDGP2W12
Estimated Impact103
Family? (F = Feedback message, R = changed R code, M = changed R Module, P = changed Parameters, D = changed Data)
-       [(Partial) Autocorrelation Function] [] [2011-04-11 21:03:04] [cedc01334dbefab590f7f4b747b64ab1] [Current]
Feedback Forum

Post a new message
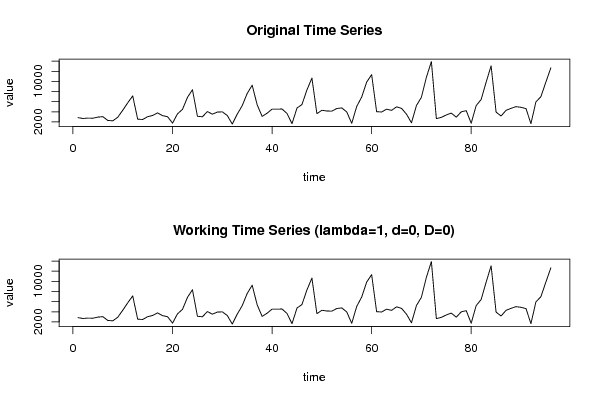
Dataseries X:
2851
2672
2755
2721
2946
3036
2282
2212
2922
4301
5764
7132
2541
2475
3031
3266
3776
3230
3028
1759
3595
4474
6838
8357
3113
3006
4047
3523
3937
3986
3260
1573
3528
5211
7614
9254
5375
3088
3718
4514
4520
4539
3663
1643
4734
5428
8314
10651
3633
4292
4154
4121
4647
4753
3965
1723
5048
6923
9858
11331
4016
3957
4510
4276
4968
4677
3523
1821
5222
6872
10803
13916
2639
2899
3370
3740
2927
3986
4217
1738
5221
6424
9842
13076
3934
3162
4286
4676
5010
4874
4633
1659
5951
6981
9851
12670


Summary of computational transaction
Raw Inputview raw input (R code)
Raw Outputview raw output of R engine
Computing time2 seconds
R Server'Herman Ole Andreas Wold' @ www.yougetit.org

\begin{tabular}{lllllllll}
\hline
Summary of computational transaction \tabularnewline
Raw Input & view raw input (R code)  \tabularnewline
Raw Output & view raw output of R engine  \tabularnewline
Computing time & 2 seconds \tabularnewline
R Server & 'Herman Ole Andreas Wold' @ www.yougetit.org \tabularnewline
\hline
\end{tabular}
%Source: https://freestatistics.org/blog/index.php?pk=120500&T=0

[TABLE]
[ROW][C]Summary of computational transaction[/C][/ROW]
[ROW][C]Raw Input[/C][C]view raw input (R code) [/C][/ROW]
[ROW][C]Raw Output[/C][C]view raw output of R engine [/C][/ROW]
[ROW][C]Computing time[/C][C]2 seconds[/C][/ROW]
[ROW][C]R Server[/C][C]'Herman Ole Andreas Wold' @ www.yougetit.org[/C][/ROW]
[/TABLE]
Source: https://freestatistics.org/blog/index.php?pk=120500&T=0

Globally Unique Identifier (entire table): ba.freestatistics.org/blog/index.php?pk=120500&T=0

As an alternative you can also use a QR Code:  

The GUIDs for individual cells are displayed in the table below:

Summary of computational transaction
Raw Inputview raw input (R code)
Raw Outputview raw output of R engine
Computing time2 seconds
R Server'Herman Ole Andreas Wold' @ www.yougetit.org


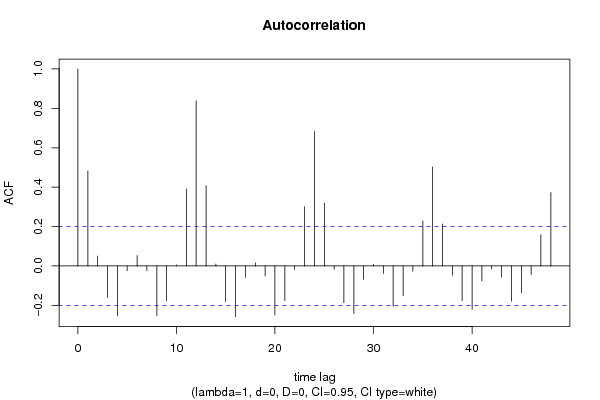
Autocorrelation Function
Time lag kACF(k)T-STATP-value
10.4815894.71864e-06
20.0499290.48920.312906
3-0.158794-1.55590.061516
4-0.253166-2.48050.00743
5-0.024456-0.23960.405567
60.0525480.51490.303914
7-0.024601-0.2410.405019
8-0.25167-2.46590.007722
9-0.176707-1.73140.0433
100.00550.05390.47857
110.3903813.82490.000116
120.8383978.21460
130.4074013.99176.4e-05
140.0100160.09810.461013
15-0.181035-1.77380.039636
16-0.257236-2.52040.006686
17-0.057245-0.56090.288091
180.0156910.15370.439069
19-0.051334-0.5030.30807
20-0.248932-2.4390.008282
21-0.175664-1.72120.044222
22-0.019552-0.19160.424243
230.3002212.94160.002047
240.6823516.68560
250.3197383.13280.001148
26-0.016167-0.15840.437236
27-0.186037-1.82280.035725
28-0.24071-2.35850.010189
29-0.067543-0.66180.254849
300.0078090.07650.469587
31-0.038387-0.37610.353832
32-0.203689-1.99570.024398
33-0.151456-1.4840.070547
34-0.026905-0.26360.396321
350.228662.24040.013685
360.5024914.92342e-06
370.2130582.08750.019744
38-0.047451-0.46490.321519
39-0.17648-1.72910.043499
40-0.219477-2.15040.017017
41-0.075371-0.73850.231011
42-0.013943-0.13660.445811
43-0.055681-0.54560.293317
44-0.17949-1.75860.040913
45-0.135742-1.330.093335
46-0.043478-0.4260.335533
470.1587431.55540.061576
480.3725013.64970.000214

\begin{tabular}{lllllllll}
\hline
Autocorrelation Function \tabularnewline
Time lag k & ACF(k) & T-STAT & P-value \tabularnewline
1 & 0.481589 & 4.7186 & 4e-06 \tabularnewline
2 & 0.049929 & 0.4892 & 0.312906 \tabularnewline
3 & -0.158794 & -1.5559 & 0.061516 \tabularnewline
4 & -0.253166 & -2.4805 & 0.00743 \tabularnewline
5 & -0.024456 & -0.2396 & 0.405567 \tabularnewline
6 & 0.052548 & 0.5149 & 0.303914 \tabularnewline
7 & -0.024601 & -0.241 & 0.405019 \tabularnewline
8 & -0.25167 & -2.4659 & 0.007722 \tabularnewline
9 & -0.176707 & -1.7314 & 0.0433 \tabularnewline
10 & 0.0055 & 0.0539 & 0.47857 \tabularnewline
11 & 0.390381 & 3.8249 & 0.000116 \tabularnewline
12 & 0.838397 & 8.2146 & 0 \tabularnewline
13 & 0.407401 & 3.9917 & 6.4e-05 \tabularnewline
14 & 0.010016 & 0.0981 & 0.461013 \tabularnewline
15 & -0.181035 & -1.7738 & 0.039636 \tabularnewline
16 & -0.257236 & -2.5204 & 0.006686 \tabularnewline
17 & -0.057245 & -0.5609 & 0.288091 \tabularnewline
18 & 0.015691 & 0.1537 & 0.439069 \tabularnewline
19 & -0.051334 & -0.503 & 0.30807 \tabularnewline
20 & -0.248932 & -2.439 & 0.008282 \tabularnewline
21 & -0.175664 & -1.7212 & 0.044222 \tabularnewline
22 & -0.019552 & -0.1916 & 0.424243 \tabularnewline
23 & 0.300221 & 2.9416 & 0.002047 \tabularnewline
24 & 0.682351 & 6.6856 & 0 \tabularnewline
25 & 0.319738 & 3.1328 & 0.001148 \tabularnewline
26 & -0.016167 & -0.1584 & 0.437236 \tabularnewline
27 & -0.186037 & -1.8228 & 0.035725 \tabularnewline
28 & -0.24071 & -2.3585 & 0.010189 \tabularnewline
29 & -0.067543 & -0.6618 & 0.254849 \tabularnewline
30 & 0.007809 & 0.0765 & 0.469587 \tabularnewline
31 & -0.038387 & -0.3761 & 0.353832 \tabularnewline
32 & -0.203689 & -1.9957 & 0.024398 \tabularnewline
33 & -0.151456 & -1.484 & 0.070547 \tabularnewline
34 & -0.026905 & -0.2636 & 0.396321 \tabularnewline
35 & 0.22866 & 2.2404 & 0.013685 \tabularnewline
36 & 0.502491 & 4.9234 & 2e-06 \tabularnewline
37 & 0.213058 & 2.0875 & 0.019744 \tabularnewline
38 & -0.047451 & -0.4649 & 0.321519 \tabularnewline
39 & -0.17648 & -1.7291 & 0.043499 \tabularnewline
40 & -0.219477 & -2.1504 & 0.017017 \tabularnewline
41 & -0.075371 & -0.7385 & 0.231011 \tabularnewline
42 & -0.013943 & -0.1366 & 0.445811 \tabularnewline
43 & -0.055681 & -0.5456 & 0.293317 \tabularnewline
44 & -0.17949 & -1.7586 & 0.040913 \tabularnewline
45 & -0.135742 & -1.33 & 0.093335 \tabularnewline
46 & -0.043478 & -0.426 & 0.335533 \tabularnewline
47 & 0.158743 & 1.5554 & 0.061576 \tabularnewline
48 & 0.372501 & 3.6497 & 0.000214 \tabularnewline
\hline
\end{tabular}
%Source: https://freestatistics.org/blog/index.php?pk=120500&T=1

[TABLE]
[ROW][C]Autocorrelation Function[/C][/ROW]
[ROW][C]Time lag k[/C][C]ACF(k)[/C][C]T-STAT[/C][C]P-value[/C][/ROW]
[ROW][C]1[/C][C]0.481589[/C][C]4.7186[/C][C]4e-06[/C][/ROW]
[ROW][C]2[/C][C]0.049929[/C][C]0.4892[/C][C]0.312906[/C][/ROW]
[ROW][C]3[/C][C]-0.158794[/C][C]-1.5559[/C][C]0.061516[/C][/ROW]
[ROW][C]4[/C][C]-0.253166[/C][C]-2.4805[/C][C]0.00743[/C][/ROW]
[ROW][C]5[/C][C]-0.024456[/C][C]-0.2396[/C][C]0.405567[/C][/ROW]
[ROW][C]6[/C][C]0.052548[/C][C]0.5149[/C][C]0.303914[/C][/ROW]
[ROW][C]7[/C][C]-0.024601[/C][C]-0.241[/C][C]0.405019[/C][/ROW]
[ROW][C]8[/C][C]-0.25167[/C][C]-2.4659[/C][C]0.007722[/C][/ROW]
[ROW][C]9[/C][C]-0.176707[/C][C]-1.7314[/C][C]0.0433[/C][/ROW]
[ROW][C]10[/C][C]0.0055[/C][C]0.0539[/C][C]0.47857[/C][/ROW]
[ROW][C]11[/C][C]0.390381[/C][C]3.8249[/C][C]0.000116[/C][/ROW]
[ROW][C]12[/C][C]0.838397[/C][C]8.2146[/C][C]0[/C][/ROW]
[ROW][C]13[/C][C]0.407401[/C][C]3.9917[/C][C]6.4e-05[/C][/ROW]
[ROW][C]14[/C][C]0.010016[/C][C]0.0981[/C][C]0.461013[/C][/ROW]
[ROW][C]15[/C][C]-0.181035[/C][C]-1.7738[/C][C]0.039636[/C][/ROW]
[ROW][C]16[/C][C]-0.257236[/C][C]-2.5204[/C][C]0.006686[/C][/ROW]
[ROW][C]17[/C][C]-0.057245[/C][C]-0.5609[/C][C]0.288091[/C][/ROW]
[ROW][C]18[/C][C]0.015691[/C][C]0.1537[/C][C]0.439069[/C][/ROW]
[ROW][C]19[/C][C]-0.051334[/C][C]-0.503[/C][C]0.30807[/C][/ROW]
[ROW][C]20[/C][C]-0.248932[/C][C]-2.439[/C][C]0.008282[/C][/ROW]
[ROW][C]21[/C][C]-0.175664[/C][C]-1.7212[/C][C]0.044222[/C][/ROW]
[ROW][C]22[/C][C]-0.019552[/C][C]-0.1916[/C][C]0.424243[/C][/ROW]
[ROW][C]23[/C][C]0.300221[/C][C]2.9416[/C][C]0.002047[/C][/ROW]
[ROW][C]24[/C][C]0.682351[/C][C]6.6856[/C][C]0[/C][/ROW]
[ROW][C]25[/C][C]0.319738[/C][C]3.1328[/C][C]0.001148[/C][/ROW]
[ROW][C]26[/C][C]-0.016167[/C][C]-0.1584[/C][C]0.437236[/C][/ROW]
[ROW][C]27[/C][C]-0.186037[/C][C]-1.8228[/C][C]0.035725[/C][/ROW]
[ROW][C]28[/C][C]-0.24071[/C][C]-2.3585[/C][C]0.010189[/C][/ROW]
[ROW][C]29[/C][C]-0.067543[/C][C]-0.6618[/C][C]0.254849[/C][/ROW]
[ROW][C]30[/C][C]0.007809[/C][C]0.0765[/C][C]0.469587[/C][/ROW]
[ROW][C]31[/C][C]-0.038387[/C][C]-0.3761[/C][C]0.353832[/C][/ROW]
[ROW][C]32[/C][C]-0.203689[/C][C]-1.9957[/C][C]0.024398[/C][/ROW]
[ROW][C]33[/C][C]-0.151456[/C][C]-1.484[/C][C]0.070547[/C][/ROW]
[ROW][C]34[/C][C]-0.026905[/C][C]-0.2636[/C][C]0.396321[/C][/ROW]
[ROW][C]35[/C][C]0.22866[/C][C]2.2404[/C][C]0.013685[/C][/ROW]
[ROW][C]36[/C][C]0.502491[/C][C]4.9234[/C][C]2e-06[/C][/ROW]
[ROW][C]37[/C][C]0.213058[/C][C]2.0875[/C][C]0.019744[/C][/ROW]
[ROW][C]38[/C][C]-0.047451[/C][C]-0.4649[/C][C]0.321519[/C][/ROW]
[ROW][C]39[/C][C]-0.17648[/C][C]-1.7291[/C][C]0.043499[/C][/ROW]
[ROW][C]40[/C][C]-0.219477[/C][C]-2.1504[/C][C]0.017017[/C][/ROW]
[ROW][C]41[/C][C]-0.075371[/C][C]-0.7385[/C][C]0.231011[/C][/ROW]
[ROW][C]42[/C][C]-0.013943[/C][C]-0.1366[/C][C]0.445811[/C][/ROW]
[ROW][C]43[/C][C]-0.055681[/C][C]-0.5456[/C][C]0.293317[/C][/ROW]
[ROW][C]44[/C][C]-0.17949[/C][C]-1.7586[/C][C]0.040913[/C][/ROW]
[ROW][C]45[/C][C]-0.135742[/C][C]-1.33[/C][C]0.093335[/C][/ROW]
[ROW][C]46[/C][C]-0.043478[/C][C]-0.426[/C][C]0.335533[/C][/ROW]
[ROW][C]47[/C][C]0.158743[/C][C]1.5554[/C][C]0.061576[/C][/ROW]
[ROW][C]48[/C][C]0.372501[/C][C]3.6497[/C][C]0.000214[/C][/ROW]
[/TABLE]
Source: https://freestatistics.org/blog/index.php?pk=120500&T=1

Globally Unique Identifier (entire table): ba.freestatistics.org/blog/index.php?pk=120500&T=1

As an alternative you can also use a QR Code:  

The GUIDs for individual cells are displayed in the table below:

Autocorrelation Function
Time lag kACF(k)T-STATP-value
10.4815894.71864e-06
20.0499290.48920.312906
3-0.158794-1.55590.061516
4-0.253166-2.48050.00743
5-0.024456-0.23960.405567
60.0525480.51490.303914
7-0.024601-0.2410.405019
8-0.25167-2.46590.007722
9-0.176707-1.73140.0433
100.00550.05390.47857
110.3903813.82490.000116
120.8383978.21460
130.4074013.99176.4e-05
140.0100160.09810.461013
15-0.181035-1.77380.039636
16-0.257236-2.52040.006686
17-0.057245-0.56090.288091
180.0156910.15370.439069
19-0.051334-0.5030.30807
20-0.248932-2.4390.008282
21-0.175664-1.72120.044222
22-0.019552-0.19160.424243
230.3002212.94160.002047
240.6823516.68560
250.3197383.13280.001148
26-0.016167-0.15840.437236
27-0.186037-1.82280.035725
28-0.24071-2.35850.010189
29-0.067543-0.66180.254849
300.0078090.07650.469587
31-0.038387-0.37610.353832
32-0.203689-1.99570.024398
33-0.151456-1.4840.070547
34-0.026905-0.26360.396321
350.228662.24040.013685
360.5024914.92342e-06
370.2130582.08750.019744
38-0.047451-0.46490.321519
39-0.17648-1.72910.043499
40-0.219477-2.15040.017017
41-0.075371-0.73850.231011
42-0.013943-0.13660.445811
43-0.055681-0.54560.293317
44-0.17949-1.75860.040913
45-0.135742-1.330.093335
46-0.043478-0.4260.335533
470.1587431.55540.061576
480.3725013.64970.000214


Partial Autocorrelation Function
Time lag kPACF(k)T-STATP-value
10.4815894.71864e-06
2-0.236955-2.32170.011182
3-0.102659-1.00580.158509
4-0.14529-1.42350.078911
50.2213152.16840.016298
6-0.108049-1.05870.146207
7-0.096252-0.94310.174007
8-0.318893-3.12450.001178
90.2480992.43090.00846
10-0.020293-0.19880.421406
110.5433455.32370
120.6100525.97730
13-0.377138-3.69520.000183
14-0.059897-0.58690.279335
150.0267410.2620.396938
160.0170320.16690.433907
17-0.140839-1.37990.085406
18-0.056628-0.55480.290147
190.015530.15220.439688
200.0554220.5430.294187
210.0160740.15750.437595
22-0.046121-0.45190.326184
23-0.083662-0.81970.207203
24-0.009692-0.0950.46227
25-0.039127-0.38340.351148
260.0747910.73280.232734
27-0.052069-0.51020.305551
280.0431060.42230.336858
29-0.012894-0.12630.449867
300.0959580.94020.174739
310.0217260.21290.415939
320.0528010.51730.303054
33-0.109173-1.06970.143724
340.0360740.35350.362262
35-0.053194-0.52120.301715
36-0.214118-2.09790.019269
370.0103880.10180.45957
380.0677030.66340.254347
390.0488250.47840.316732
40-0.095486-0.93560.175922
410.0193850.18990.42488
42-0.045833-0.44910.327196
43-0.057012-0.55860.288868
44-0.032204-0.31550.376522
45-0.013471-0.1320.447634
46-0.077417-0.75850.224998
470.0206090.20190.4202
480.139541.36720.087377

\begin{tabular}{lllllllll}
\hline
Partial Autocorrelation Function \tabularnewline
Time lag k & PACF(k) & T-STAT & P-value \tabularnewline
1 & 0.481589 & 4.7186 & 4e-06 \tabularnewline
2 & -0.236955 & -2.3217 & 0.011182 \tabularnewline
3 & -0.102659 & -1.0058 & 0.158509 \tabularnewline
4 & -0.14529 & -1.4235 & 0.078911 \tabularnewline
5 & 0.221315 & 2.1684 & 0.016298 \tabularnewline
6 & -0.108049 & -1.0587 & 0.146207 \tabularnewline
7 & -0.096252 & -0.9431 & 0.174007 \tabularnewline
8 & -0.318893 & -3.1245 & 0.001178 \tabularnewline
9 & 0.248099 & 2.4309 & 0.00846 \tabularnewline
10 & -0.020293 & -0.1988 & 0.421406 \tabularnewline
11 & 0.543345 & 5.3237 & 0 \tabularnewline
12 & 0.610052 & 5.9773 & 0 \tabularnewline
13 & -0.377138 & -3.6952 & 0.000183 \tabularnewline
14 & -0.059897 & -0.5869 & 0.279335 \tabularnewline
15 & 0.026741 & 0.262 & 0.396938 \tabularnewline
16 & 0.017032 & 0.1669 & 0.433907 \tabularnewline
17 & -0.140839 & -1.3799 & 0.085406 \tabularnewline
18 & -0.056628 & -0.5548 & 0.290147 \tabularnewline
19 & 0.01553 & 0.1522 & 0.439688 \tabularnewline
20 & 0.055422 & 0.543 & 0.294187 \tabularnewline
21 & 0.016074 & 0.1575 & 0.437595 \tabularnewline
22 & -0.046121 & -0.4519 & 0.326184 \tabularnewline
23 & -0.083662 & -0.8197 & 0.207203 \tabularnewline
24 & -0.009692 & -0.095 & 0.46227 \tabularnewline
25 & -0.039127 & -0.3834 & 0.351148 \tabularnewline
26 & 0.074791 & 0.7328 & 0.232734 \tabularnewline
27 & -0.052069 & -0.5102 & 0.305551 \tabularnewline
28 & 0.043106 & 0.4223 & 0.336858 \tabularnewline
29 & -0.012894 & -0.1263 & 0.449867 \tabularnewline
30 & 0.095958 & 0.9402 & 0.174739 \tabularnewline
31 & 0.021726 & 0.2129 & 0.415939 \tabularnewline
32 & 0.052801 & 0.5173 & 0.303054 \tabularnewline
33 & -0.109173 & -1.0697 & 0.143724 \tabularnewline
34 & 0.036074 & 0.3535 & 0.362262 \tabularnewline
35 & -0.053194 & -0.5212 & 0.301715 \tabularnewline
36 & -0.214118 & -2.0979 & 0.019269 \tabularnewline
37 & 0.010388 & 0.1018 & 0.45957 \tabularnewline
38 & 0.067703 & 0.6634 & 0.254347 \tabularnewline
39 & 0.048825 & 0.4784 & 0.316732 \tabularnewline
40 & -0.095486 & -0.9356 & 0.175922 \tabularnewline
41 & 0.019385 & 0.1899 & 0.42488 \tabularnewline
42 & -0.045833 & -0.4491 & 0.327196 \tabularnewline
43 & -0.057012 & -0.5586 & 0.288868 \tabularnewline
44 & -0.032204 & -0.3155 & 0.376522 \tabularnewline
45 & -0.013471 & -0.132 & 0.447634 \tabularnewline
46 & -0.077417 & -0.7585 & 0.224998 \tabularnewline
47 & 0.020609 & 0.2019 & 0.4202 \tabularnewline
48 & 0.13954 & 1.3672 & 0.087377 \tabularnewline
\hline
\end{tabular}
%Source: https://freestatistics.org/blog/index.php?pk=120500&T=2

[TABLE]
[ROW][C]Partial Autocorrelation Function[/C][/ROW]
[ROW][C]Time lag k[/C][C]PACF(k)[/C][C]T-STAT[/C][C]P-value[/C][/ROW]
[ROW][C]1[/C][C]0.481589[/C][C]4.7186[/C][C]4e-06[/C][/ROW]
[ROW][C]2[/C][C]-0.236955[/C][C]-2.3217[/C][C]0.011182[/C][/ROW]
[ROW][C]3[/C][C]-0.102659[/C][C]-1.0058[/C][C]0.158509[/C][/ROW]
[ROW][C]4[/C][C]-0.14529[/C][C]-1.4235[/C][C]0.078911[/C][/ROW]
[ROW][C]5[/C][C]0.221315[/C][C]2.1684[/C][C]0.016298[/C][/ROW]
[ROW][C]6[/C][C]-0.108049[/C][C]-1.0587[/C][C]0.146207[/C][/ROW]
[ROW][C]7[/C][C]-0.096252[/C][C]-0.9431[/C][C]0.174007[/C][/ROW]
[ROW][C]8[/C][C]-0.318893[/C][C]-3.1245[/C][C]0.001178[/C][/ROW]
[ROW][C]9[/C][C]0.248099[/C][C]2.4309[/C][C]0.00846[/C][/ROW]
[ROW][C]10[/C][C]-0.020293[/C][C]-0.1988[/C][C]0.421406[/C][/ROW]
[ROW][C]11[/C][C]0.543345[/C][C]5.3237[/C][C]0[/C][/ROW]
[ROW][C]12[/C][C]0.610052[/C][C]5.9773[/C][C]0[/C][/ROW]
[ROW][C]13[/C][C]-0.377138[/C][C]-3.6952[/C][C]0.000183[/C][/ROW]
[ROW][C]14[/C][C]-0.059897[/C][C]-0.5869[/C][C]0.279335[/C][/ROW]
[ROW][C]15[/C][C]0.026741[/C][C]0.262[/C][C]0.396938[/C][/ROW]
[ROW][C]16[/C][C]0.017032[/C][C]0.1669[/C][C]0.433907[/C][/ROW]
[ROW][C]17[/C][C]-0.140839[/C][C]-1.3799[/C][C]0.085406[/C][/ROW]
[ROW][C]18[/C][C]-0.056628[/C][C]-0.5548[/C][C]0.290147[/C][/ROW]
[ROW][C]19[/C][C]0.01553[/C][C]0.1522[/C][C]0.439688[/C][/ROW]
[ROW][C]20[/C][C]0.055422[/C][C]0.543[/C][C]0.294187[/C][/ROW]
[ROW][C]21[/C][C]0.016074[/C][C]0.1575[/C][C]0.437595[/C][/ROW]
[ROW][C]22[/C][C]-0.046121[/C][C]-0.4519[/C][C]0.326184[/C][/ROW]
[ROW][C]23[/C][C]-0.083662[/C][C]-0.8197[/C][C]0.207203[/C][/ROW]
[ROW][C]24[/C][C]-0.009692[/C][C]-0.095[/C][C]0.46227[/C][/ROW]
[ROW][C]25[/C][C]-0.039127[/C][C]-0.3834[/C][C]0.351148[/C][/ROW]
[ROW][C]26[/C][C]0.074791[/C][C]0.7328[/C][C]0.232734[/C][/ROW]
[ROW][C]27[/C][C]-0.052069[/C][C]-0.5102[/C][C]0.305551[/C][/ROW]
[ROW][C]28[/C][C]0.043106[/C][C]0.4223[/C][C]0.336858[/C][/ROW]
[ROW][C]29[/C][C]-0.012894[/C][C]-0.1263[/C][C]0.449867[/C][/ROW]
[ROW][C]30[/C][C]0.095958[/C][C]0.9402[/C][C]0.174739[/C][/ROW]
[ROW][C]31[/C][C]0.021726[/C][C]0.2129[/C][C]0.415939[/C][/ROW]
[ROW][C]32[/C][C]0.052801[/C][C]0.5173[/C][C]0.303054[/C][/ROW]
[ROW][C]33[/C][C]-0.109173[/C][C]-1.0697[/C][C]0.143724[/C][/ROW]
[ROW][C]34[/C][C]0.036074[/C][C]0.3535[/C][C]0.362262[/C][/ROW]
[ROW][C]35[/C][C]-0.053194[/C][C]-0.5212[/C][C]0.301715[/C][/ROW]
[ROW][C]36[/C][C]-0.214118[/C][C]-2.0979[/C][C]0.019269[/C][/ROW]
[ROW][C]37[/C][C]0.010388[/C][C]0.1018[/C][C]0.45957[/C][/ROW]
[ROW][C]38[/C][C]0.067703[/C][C]0.6634[/C][C]0.254347[/C][/ROW]
[ROW][C]39[/C][C]0.048825[/C][C]0.4784[/C][C]0.316732[/C][/ROW]
[ROW][C]40[/C][C]-0.095486[/C][C]-0.9356[/C][C]0.175922[/C][/ROW]
[ROW][C]41[/C][C]0.019385[/C][C]0.1899[/C][C]0.42488[/C][/ROW]
[ROW][C]42[/C][C]-0.045833[/C][C]-0.4491[/C][C]0.327196[/C][/ROW]
[ROW][C]43[/C][C]-0.057012[/C][C]-0.5586[/C][C]0.288868[/C][/ROW]
[ROW][C]44[/C][C]-0.032204[/C][C]-0.3155[/C][C]0.376522[/C][/ROW]
[ROW][C]45[/C][C]-0.013471[/C][C]-0.132[/C][C]0.447634[/C][/ROW]
[ROW][C]46[/C][C]-0.077417[/C][C]-0.7585[/C][C]0.224998[/C][/ROW]
[ROW][C]47[/C][C]0.020609[/C][C]0.2019[/C][C]0.4202[/C][/ROW]
[ROW][C]48[/C][C]0.13954[/C][C]1.3672[/C][C]0.087377[/C][/ROW]
[/TABLE]
Source: https://freestatistics.org/blog/index.php?pk=120500&T=2

Globally Unique Identifier (entire table): ba.freestatistics.org/blog/index.php?pk=120500&T=2

As an alternative you can also use a QR Code:  

The GUIDs for individual cells are displayed in the table below:

Partial Autocorrelation Function
Time lag kPACF(k)T-STATP-value
10.4815894.71864e-06
2-0.236955-2.32170.011182
3-0.102659-1.00580.158509
4-0.14529-1.42350.078911
50.2213152.16840.016298
6-0.108049-1.05870.146207
7-0.096252-0.94310.174007
8-0.318893-3.12450.001178
90.2480992.43090.00846
10-0.020293-0.19880.421406
110.5433455.32370
120.6100525.97730
13-0.377138-3.69520.000183
14-0.059897-0.58690.279335
150.0267410.2620.396938
160.0170320.16690.433907
17-0.140839-1.37990.085406
18-0.056628-0.55480.290147
190.015530.15220.439688
200.0554220.5430.294187
210.0160740.15750.437595
22-0.046121-0.45190.326184
23-0.083662-0.81970.207203
24-0.009692-0.0950.46227
25-0.039127-0.38340.351148
260.0747910.73280.232734
27-0.052069-0.51020.305551
280.0431060.42230.336858
29-0.012894-0.12630.449867
300.0959580.94020.174739
310.0217260.21290.415939
320.0528010.51730.303054
33-0.109173-1.06970.143724
340.0360740.35350.362262
35-0.053194-0.52120.301715
36-0.214118-2.09790.019269
370.0103880.10180.45957
380.0677030.66340.254347
390.0488250.47840.316732
40-0.095486-0.93560.175922
410.0193850.18990.42488
42-0.045833-0.44910.327196
43-0.057012-0.55860.288868
44-0.032204-0.31550.376522
45-0.013471-0.1320.447634
46-0.077417-0.75850.224998
470.0206090.20190.4202
480.139541.36720.087377


Parameters (Session):
par1 = 48 ; par2 = 1 ; par3 = 0 ; par4 = 0 ; par5 = 12 ; par6 = White Noise ; par7 = 0.95 ;
Parameters (R input):
par1 = 48 ; par2 = 1 ; par3 = 0 ; par4 = 0 ; par5 = 12 ; par6 = White Noise ; par7 = 0.95 ; par8 = ;
R code (references can be found in the software module):
if (par1 == 'Default') {
par1 = 10*log10(length(x))
} else {
par1 <- as.numeric(par1)
}
par2 <- as.numeric(par2)
par3 <- as.numeric(par3)
par4 <- as.numeric(par4)
par5 <- as.numeric(par5)
if (par6 == 'White Noise') par6 <- 'white' else par6 <- 'ma'
par7 <- as.numeric(par7)
if (par8 != '') par8 <- as.numeric(par8)
ox <- x
if (par8 == '') {
if (par2 == 0) {
x <- log(x)
} else {
x <- (x ^ par2 - 1) / par2
}
} else {
x <- log(x,base=par8)
}
if (par3 > 0) x <- diff(x,lag=1,difference=par3)
if (par4 > 0) x <- diff(x,lag=par5,difference=par4)
bitmap(file='picts.png')
op <- par(mfrow=c(2,1))
plot(ox,type='l',main='Original Time Series',xlab='time',ylab='value')
if (par8=='') {
mytitle <- paste('Working Time Series (lambda=',par2,', d=',par3,', D=',par4,')',sep='')
mysub <- paste('(lambda=',par2,', d=',par3,', D=',par4,', CI=', par7, ', CI type=',par6,')',sep='')
} else {
mytitle <- paste('Working Time Series (base=',par8,', d=',par3,', D=',par4,')',sep='')
mysub <- paste('(base=',par8,', d=',par3,', D=',par4,', CI=', par7, ', CI type=',par6,')',sep='')
}
plot(x,type='l', main=mytitle,xlab='time',ylab='value')
par(op)
dev.off()
bitmap(file='pic1.png')
racf <- acf(x, par1, main='Autocorrelation', xlab='time lag', ylab='ACF', ci.type=par6, ci=par7, sub=mysub)
dev.off()
bitmap(file='pic2.png')
rpacf <- pacf(x,par1,main='Partial Autocorrelation',xlab='lags',ylab='PACF',sub=mysub)
dev.off()
(myacf <- c(racf$acf))
(mypacf <- c(rpacf$acf))
lengthx <- length(x)
sqrtn <- sqrt(lengthx)
load(file='createtable')
a<-table.start()
a<-table.row.start(a)
a<-table.element(a,'Autocorrelation Function',4,TRUE)
a<-table.row.end(a)
a<-table.row.start(a)
a<-table.element(a,'Time lag k',header=TRUE)
a<-table.element(a,hyperlink('basics.htm','ACF(k)','click here for more information about the Autocorrelation Function'),header=TRUE)
a<-table.element(a,'T-STAT',header=TRUE)
a<-table.element(a,'P-value',header=TRUE)
a<-table.row.end(a)
for (i in 2:(par1+1)) {
a<-table.row.start(a)
a<-table.element(a,i-1,header=TRUE)
a<-table.element(a,round(myacf[i],6))
mytstat <- myacf[i]*sqrtn
a<-table.element(a,round(mytstat,4))
a<-table.element(a,round(1-pt(abs(mytstat),lengthx),6))
a<-table.row.end(a)
}
a<-table.end(a)
table.save(a,file='mytable.tab')
a<-table.start()
a<-table.row.start(a)
a<-table.element(a,'Partial Autocorrelation Function',4,TRUE)
a<-table.row.end(a)
a<-table.row.start(a)
a<-table.element(a,'Time lag k',header=TRUE)
a<-table.element(a,hyperlink('basics.htm','PACF(k)','click here for more information about the Partial Autocorrelation Function'),header=TRUE)
a<-table.element(a,'T-STAT',header=TRUE)
a<-table.element(a,'P-value',header=TRUE)
a<-table.row.end(a)
for (i in 1:par1) {
a<-table.row.start(a)
a<-table.element(a,i,header=TRUE)
a<-table.element(a,round(mypacf[i],6))
mytstat <- mypacf[i]*sqrtn
a<-table.element(a,round(mytstat,4))
a<-table.element(a,round(1-pt(abs(mytstat),lengthx),6))
a<-table.row.end(a)
}
a<-table.end(a)
table.save(a,file='mytable1.tab')