Free Statistics

of Irreproducible Research!

Author's title

differentiatie autocorrelatie-Inschrijvingen nieuwe personenwagens (eigen r...

Author*Unverified author*
R Software Modulerwasp_autocorrelation.wasp
Title produced by software(Partial) Autocorrelation Function
Date of computationMon, 11 Apr 2011 19:36:46 +0000
Cite this page as followsStatistical Computations at FreeStatistics.org, Office for Research Development and Education, URL https://freestatistics.org/blog/index.php?v=date/2011/Apr/11/t1302550519ap73ovks83he6jw.htm/, Retrieved Thu, 09 May 2024 07:35:41 +0000
Statistical Computations at FreeStatistics.org, Office for Research Development and Education, URL https://freestatistics.org/blog/index.php?pk=120492, Retrieved Thu, 09 May 2024 07:35:41 +0000
QR Codes:

Original text written by user:
IsPrivate?No (this computation is public)
User-defined keywordsKDGP2W12
Estimated Impact138
Family? (F = Feedback message, R = changed R code, M = changed R Module, P = changed Parameters, D = changed Data)
-       [(Partial) Autocorrelation Function] [differentiatie au...] [2011-04-11 19:36:46] [ebb64913e7d7e5b0e5266ebfea2a3acd] [Current]
Feedback Forum

Post a new message
Dataseries X:
26281
23899
25727
30733
28599
16723
43738
45272
46532
41032
37967
35366
33892
21560
26588
33527
24859
17952
45504
40129
40357
41913
33730
37842
33025
24050
30429
34507
25189
20253
48527
44446
46380
48950
38883
42928
37107
30186
32602
39892
32194
21629
59968
45694
55756
48554
41052
49822
39191
31994
35735
38930
33658
23849
58972
59249
63955
53785
52760
44795
37348
32370
32717
40974
33591
21124
58608
46865
51378
46235
47206
45382
41227
33795
31295
42625
33625
21538
56421
53152
53536
52408
41454
38271
35306
26414
31917
38030
27534
18387


Summary of computational transaction
Raw Inputview raw input (R code)
Raw Outputview raw output of R engine
Computing time2 seconds
R Server'George Udny Yule' @ 216.218.223.82

\begin{tabular}{lllllllll}
\hline
Summary of computational transaction \tabularnewline
Raw Input & view raw input (R code)  \tabularnewline
Raw Output & view raw output of R engine  \tabularnewline
Computing time & 2 seconds \tabularnewline
R Server & 'George Udny Yule' @ 216.218.223.82 \tabularnewline
\hline
\end{tabular}
%Source: https://freestatistics.org/blog/index.php?pk=120492&T=0

[TABLE]
[ROW][C]Summary of computational transaction[/C][/ROW]
[ROW][C]Raw Input[/C][C]view raw input (R code) [/C][/ROW]
[ROW][C]Raw Output[/C][C]view raw output of R engine [/C][/ROW]
[ROW][C]Computing time[/C][C]2 seconds[/C][/ROW]
[ROW][C]R Server[/C][C]'George Udny Yule' @ 216.218.223.82[/C][/ROW]
[/TABLE]
Source: https://freestatistics.org/blog/index.php?pk=120492&T=0

Globally Unique Identifier (entire table): ba.freestatistics.org/blog/index.php?pk=120492&T=0

As an alternative you can also use a QR Code:  

The GUIDs for individual cells are displayed in the table below:

Summary of computational transaction
Raw Inputview raw input (R code)
Raw Outputview raw output of R engine
Computing time2 seconds
R Server'George Udny Yule' @ 216.218.223.82


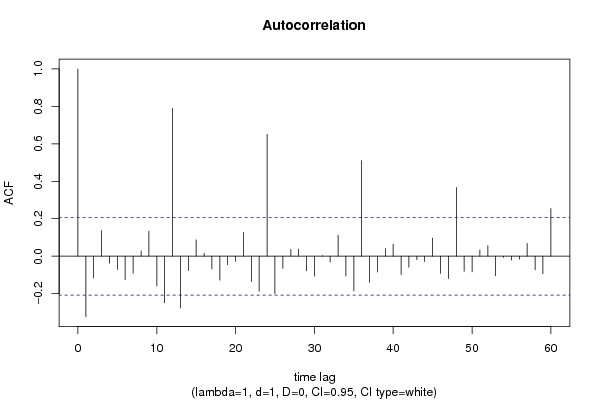
Autocorrelation Function
Time lag kACF(k)T-STATP-value
1-0.32303-3.04750.001519
2-0.115901-1.09340.138583
30.1367941.29050.100109
4-0.038033-0.35880.360296
5-0.070451-0.66460.254001
6-0.124491-1.17440.121676
7-0.09064-0.85510.197398
80.0273730.25820.398409
90.1333681.25820.105807
10-0.158787-1.4980.068837
11-0.248642-2.34570.010607
120.789697.44990
13-0.276585-2.60930.005321
14-0.076437-0.72110.236367
150.087290.82350.206215
160.0148690.14030.444381
17-0.068958-0.65060.258506
18-0.127939-1.2070.11532
19-0.045988-0.43380.332725
20-0.027374-0.25820.398407
210.1264781.19320.117983
22-0.135194-1.27540.102739
23-0.187809-1.77180.039926
240.6505886.13760
25-0.200583-1.89230.030851
26-0.066092-0.62350.267273
270.0354740.33470.369335
280.0374160.3530.362467
29-0.077952-0.73540.232017
30-0.106443-1.00420.159007
310.0030820.02910.488435
32-0.031499-0.29720.383518
330.111171.04880.148561
34-0.106043-1.00040.159914
35-0.185597-1.75090.041703
360.5096644.80823e-06
37-0.139901-1.31980.095139
38-0.084671-0.79880.213271
390.0413120.38970.348831
400.0637440.60140.274564
41-0.098285-0.92720.178161
42-0.058433-0.55130.29142
43-0.018368-0.17330.43141
44-0.028604-0.26990.393949
450.0963050.90850.183022
46-0.092028-0.86820.193814
47-0.119438-1.12680.131433
480.3672853.4650.000409
49-0.0808-0.76230.223959
50-0.083747-0.79010.215795
510.0322760.30450.380731
520.0560730.5290.299063
53-0.104666-0.98740.163057
54-0.006532-0.06160.475501
55-0.020821-0.19640.422361
56-0.015363-0.14490.442547
570.0673540.63540.263395
58-0.072793-0.68670.247021
59-0.093429-0.88140.190236
600.2539972.39620.00933

\begin{tabular}{lllllllll}
\hline
Autocorrelation Function \tabularnewline
Time lag k & ACF(k) & T-STAT & P-value \tabularnewline
1 & -0.32303 & -3.0475 & 0.001519 \tabularnewline
2 & -0.115901 & -1.0934 & 0.138583 \tabularnewline
3 & 0.136794 & 1.2905 & 0.100109 \tabularnewline
4 & -0.038033 & -0.3588 & 0.360296 \tabularnewline
5 & -0.070451 & -0.6646 & 0.254001 \tabularnewline
6 & -0.124491 & -1.1744 & 0.121676 \tabularnewline
7 & -0.09064 & -0.8551 & 0.197398 \tabularnewline
8 & 0.027373 & 0.2582 & 0.398409 \tabularnewline
9 & 0.133368 & 1.2582 & 0.105807 \tabularnewline
10 & -0.158787 & -1.498 & 0.068837 \tabularnewline
11 & -0.248642 & -2.3457 & 0.010607 \tabularnewline
12 & 0.78969 & 7.4499 & 0 \tabularnewline
13 & -0.276585 & -2.6093 & 0.005321 \tabularnewline
14 & -0.076437 & -0.7211 & 0.236367 \tabularnewline
15 & 0.08729 & 0.8235 & 0.206215 \tabularnewline
16 & 0.014869 & 0.1403 & 0.444381 \tabularnewline
17 & -0.068958 & -0.6506 & 0.258506 \tabularnewline
18 & -0.127939 & -1.207 & 0.11532 \tabularnewline
19 & -0.045988 & -0.4338 & 0.332725 \tabularnewline
20 & -0.027374 & -0.2582 & 0.398407 \tabularnewline
21 & 0.126478 & 1.1932 & 0.117983 \tabularnewline
22 & -0.135194 & -1.2754 & 0.102739 \tabularnewline
23 & -0.187809 & -1.7718 & 0.039926 \tabularnewline
24 & 0.650588 & 6.1376 & 0 \tabularnewline
25 & -0.200583 & -1.8923 & 0.030851 \tabularnewline
26 & -0.066092 & -0.6235 & 0.267273 \tabularnewline
27 & 0.035474 & 0.3347 & 0.369335 \tabularnewline
28 & 0.037416 & 0.353 & 0.362467 \tabularnewline
29 & -0.077952 & -0.7354 & 0.232017 \tabularnewline
30 & -0.106443 & -1.0042 & 0.159007 \tabularnewline
31 & 0.003082 & 0.0291 & 0.488435 \tabularnewline
32 & -0.031499 & -0.2972 & 0.383518 \tabularnewline
33 & 0.11117 & 1.0488 & 0.148561 \tabularnewline
34 & -0.106043 & -1.0004 & 0.159914 \tabularnewline
35 & -0.185597 & -1.7509 & 0.041703 \tabularnewline
36 & 0.509664 & 4.8082 & 3e-06 \tabularnewline
37 & -0.139901 & -1.3198 & 0.095139 \tabularnewline
38 & -0.084671 & -0.7988 & 0.213271 \tabularnewline
39 & 0.041312 & 0.3897 & 0.348831 \tabularnewline
40 & 0.063744 & 0.6014 & 0.274564 \tabularnewline
41 & -0.098285 & -0.9272 & 0.178161 \tabularnewline
42 & -0.058433 & -0.5513 & 0.29142 \tabularnewline
43 & -0.018368 & -0.1733 & 0.43141 \tabularnewline
44 & -0.028604 & -0.2699 & 0.393949 \tabularnewline
45 & 0.096305 & 0.9085 & 0.183022 \tabularnewline
46 & -0.092028 & -0.8682 & 0.193814 \tabularnewline
47 & -0.119438 & -1.1268 & 0.131433 \tabularnewline
48 & 0.367285 & 3.465 & 0.000409 \tabularnewline
49 & -0.0808 & -0.7623 & 0.223959 \tabularnewline
50 & -0.083747 & -0.7901 & 0.215795 \tabularnewline
51 & 0.032276 & 0.3045 & 0.380731 \tabularnewline
52 & 0.056073 & 0.529 & 0.299063 \tabularnewline
53 & -0.104666 & -0.9874 & 0.163057 \tabularnewline
54 & -0.006532 & -0.0616 & 0.475501 \tabularnewline
55 & -0.020821 & -0.1964 & 0.422361 \tabularnewline
56 & -0.015363 & -0.1449 & 0.442547 \tabularnewline
57 & 0.067354 & 0.6354 & 0.263395 \tabularnewline
58 & -0.072793 & -0.6867 & 0.247021 \tabularnewline
59 & -0.093429 & -0.8814 & 0.190236 \tabularnewline
60 & 0.253997 & 2.3962 & 0.00933 \tabularnewline
\hline
\end{tabular}
%Source: https://freestatistics.org/blog/index.php?pk=120492&T=1

[TABLE]
[ROW][C]Autocorrelation Function[/C][/ROW]
[ROW][C]Time lag k[/C][C]ACF(k)[/C][C]T-STAT[/C][C]P-value[/C][/ROW]
[ROW][C]1[/C][C]-0.32303[/C][C]-3.0475[/C][C]0.001519[/C][/ROW]
[ROW][C]2[/C][C]-0.115901[/C][C]-1.0934[/C][C]0.138583[/C][/ROW]
[ROW][C]3[/C][C]0.136794[/C][C]1.2905[/C][C]0.100109[/C][/ROW]
[ROW][C]4[/C][C]-0.038033[/C][C]-0.3588[/C][C]0.360296[/C][/ROW]
[ROW][C]5[/C][C]-0.070451[/C][C]-0.6646[/C][C]0.254001[/C][/ROW]
[ROW][C]6[/C][C]-0.124491[/C][C]-1.1744[/C][C]0.121676[/C][/ROW]
[ROW][C]7[/C][C]-0.09064[/C][C]-0.8551[/C][C]0.197398[/C][/ROW]
[ROW][C]8[/C][C]0.027373[/C][C]0.2582[/C][C]0.398409[/C][/ROW]
[ROW][C]9[/C][C]0.133368[/C][C]1.2582[/C][C]0.105807[/C][/ROW]
[ROW][C]10[/C][C]-0.158787[/C][C]-1.498[/C][C]0.068837[/C][/ROW]
[ROW][C]11[/C][C]-0.248642[/C][C]-2.3457[/C][C]0.010607[/C][/ROW]
[ROW][C]12[/C][C]0.78969[/C][C]7.4499[/C][C]0[/C][/ROW]
[ROW][C]13[/C][C]-0.276585[/C][C]-2.6093[/C][C]0.005321[/C][/ROW]
[ROW][C]14[/C][C]-0.076437[/C][C]-0.7211[/C][C]0.236367[/C][/ROW]
[ROW][C]15[/C][C]0.08729[/C][C]0.8235[/C][C]0.206215[/C][/ROW]
[ROW][C]16[/C][C]0.014869[/C][C]0.1403[/C][C]0.444381[/C][/ROW]
[ROW][C]17[/C][C]-0.068958[/C][C]-0.6506[/C][C]0.258506[/C][/ROW]
[ROW][C]18[/C][C]-0.127939[/C][C]-1.207[/C][C]0.11532[/C][/ROW]
[ROW][C]19[/C][C]-0.045988[/C][C]-0.4338[/C][C]0.332725[/C][/ROW]
[ROW][C]20[/C][C]-0.027374[/C][C]-0.2582[/C][C]0.398407[/C][/ROW]
[ROW][C]21[/C][C]0.126478[/C][C]1.1932[/C][C]0.117983[/C][/ROW]
[ROW][C]22[/C][C]-0.135194[/C][C]-1.2754[/C][C]0.102739[/C][/ROW]
[ROW][C]23[/C][C]-0.187809[/C][C]-1.7718[/C][C]0.039926[/C][/ROW]
[ROW][C]24[/C][C]0.650588[/C][C]6.1376[/C][C]0[/C][/ROW]
[ROW][C]25[/C][C]-0.200583[/C][C]-1.8923[/C][C]0.030851[/C][/ROW]
[ROW][C]26[/C][C]-0.066092[/C][C]-0.6235[/C][C]0.267273[/C][/ROW]
[ROW][C]27[/C][C]0.035474[/C][C]0.3347[/C][C]0.369335[/C][/ROW]
[ROW][C]28[/C][C]0.037416[/C][C]0.353[/C][C]0.362467[/C][/ROW]
[ROW][C]29[/C][C]-0.077952[/C][C]-0.7354[/C][C]0.232017[/C][/ROW]
[ROW][C]30[/C][C]-0.106443[/C][C]-1.0042[/C][C]0.159007[/C][/ROW]
[ROW][C]31[/C][C]0.003082[/C][C]0.0291[/C][C]0.488435[/C][/ROW]
[ROW][C]32[/C][C]-0.031499[/C][C]-0.2972[/C][C]0.383518[/C][/ROW]
[ROW][C]33[/C][C]0.11117[/C][C]1.0488[/C][C]0.148561[/C][/ROW]
[ROW][C]34[/C][C]-0.106043[/C][C]-1.0004[/C][C]0.159914[/C][/ROW]
[ROW][C]35[/C][C]-0.185597[/C][C]-1.7509[/C][C]0.041703[/C][/ROW]
[ROW][C]36[/C][C]0.509664[/C][C]4.8082[/C][C]3e-06[/C][/ROW]
[ROW][C]37[/C][C]-0.139901[/C][C]-1.3198[/C][C]0.095139[/C][/ROW]
[ROW][C]38[/C][C]-0.084671[/C][C]-0.7988[/C][C]0.213271[/C][/ROW]
[ROW][C]39[/C][C]0.041312[/C][C]0.3897[/C][C]0.348831[/C][/ROW]
[ROW][C]40[/C][C]0.063744[/C][C]0.6014[/C][C]0.274564[/C][/ROW]
[ROW][C]41[/C][C]-0.098285[/C][C]-0.9272[/C][C]0.178161[/C][/ROW]
[ROW][C]42[/C][C]-0.058433[/C][C]-0.5513[/C][C]0.29142[/C][/ROW]
[ROW][C]43[/C][C]-0.018368[/C][C]-0.1733[/C][C]0.43141[/C][/ROW]
[ROW][C]44[/C][C]-0.028604[/C][C]-0.2699[/C][C]0.393949[/C][/ROW]
[ROW][C]45[/C][C]0.096305[/C][C]0.9085[/C][C]0.183022[/C][/ROW]
[ROW][C]46[/C][C]-0.092028[/C][C]-0.8682[/C][C]0.193814[/C][/ROW]
[ROW][C]47[/C][C]-0.119438[/C][C]-1.1268[/C][C]0.131433[/C][/ROW]
[ROW][C]48[/C][C]0.367285[/C][C]3.465[/C][C]0.000409[/C][/ROW]
[ROW][C]49[/C][C]-0.0808[/C][C]-0.7623[/C][C]0.223959[/C][/ROW]
[ROW][C]50[/C][C]-0.083747[/C][C]-0.7901[/C][C]0.215795[/C][/ROW]
[ROW][C]51[/C][C]0.032276[/C][C]0.3045[/C][C]0.380731[/C][/ROW]
[ROW][C]52[/C][C]0.056073[/C][C]0.529[/C][C]0.299063[/C][/ROW]
[ROW][C]53[/C][C]-0.104666[/C][C]-0.9874[/C][C]0.163057[/C][/ROW]
[ROW][C]54[/C][C]-0.006532[/C][C]-0.0616[/C][C]0.475501[/C][/ROW]
[ROW][C]55[/C][C]-0.020821[/C][C]-0.1964[/C][C]0.422361[/C][/ROW]
[ROW][C]56[/C][C]-0.015363[/C][C]-0.1449[/C][C]0.442547[/C][/ROW]
[ROW][C]57[/C][C]0.067354[/C][C]0.6354[/C][C]0.263395[/C][/ROW]
[ROW][C]58[/C][C]-0.072793[/C][C]-0.6867[/C][C]0.247021[/C][/ROW]
[ROW][C]59[/C][C]-0.093429[/C][C]-0.8814[/C][C]0.190236[/C][/ROW]
[ROW][C]60[/C][C]0.253997[/C][C]2.3962[/C][C]0.00933[/C][/ROW]
[/TABLE]
Source: https://freestatistics.org/blog/index.php?pk=120492&T=1

Globally Unique Identifier (entire table): ba.freestatistics.org/blog/index.php?pk=120492&T=1

As an alternative you can also use a QR Code:  

The GUIDs for individual cells are displayed in the table below:

Autocorrelation Function
Time lag kACF(k)T-STATP-value
1-0.32303-3.04750.001519
2-0.115901-1.09340.138583
30.1367941.29050.100109
4-0.038033-0.35880.360296
5-0.070451-0.66460.254001
6-0.124491-1.17440.121676
7-0.09064-0.85510.197398
80.0273730.25820.398409
90.1333681.25820.105807
10-0.158787-1.4980.068837
11-0.248642-2.34570.010607
120.789697.44990
13-0.276585-2.60930.005321
14-0.076437-0.72110.236367
150.087290.82350.206215
160.0148690.14030.444381
17-0.068958-0.65060.258506
18-0.127939-1.2070.11532
19-0.045988-0.43380.332725
20-0.027374-0.25820.398407
210.1264781.19320.117983
22-0.135194-1.27540.102739
23-0.187809-1.77180.039926
240.6505886.13760
25-0.200583-1.89230.030851
26-0.066092-0.62350.267273
270.0354740.33470.369335
280.0374160.3530.362467
29-0.077952-0.73540.232017
30-0.106443-1.00420.159007
310.0030820.02910.488435
32-0.031499-0.29720.383518
330.111171.04880.148561
34-0.106043-1.00040.159914
35-0.185597-1.75090.041703
360.5096644.80823e-06
37-0.139901-1.31980.095139
38-0.084671-0.79880.213271
390.0413120.38970.348831
400.0637440.60140.274564
41-0.098285-0.92720.178161
42-0.058433-0.55130.29142
43-0.018368-0.17330.43141
44-0.028604-0.26990.393949
450.0963050.90850.183022
46-0.092028-0.86820.193814
47-0.119438-1.12680.131433
480.3672853.4650.000409
49-0.0808-0.76230.223959
50-0.083747-0.79010.215795
510.0322760.30450.380731
520.0560730.5290.299063
53-0.104666-0.98740.163057
54-0.006532-0.06160.475501
55-0.020821-0.19640.422361
56-0.015363-0.14490.442547
570.0673540.63540.263395
58-0.072793-0.68670.247021
59-0.093429-0.88140.190236
600.2539972.39620.00933


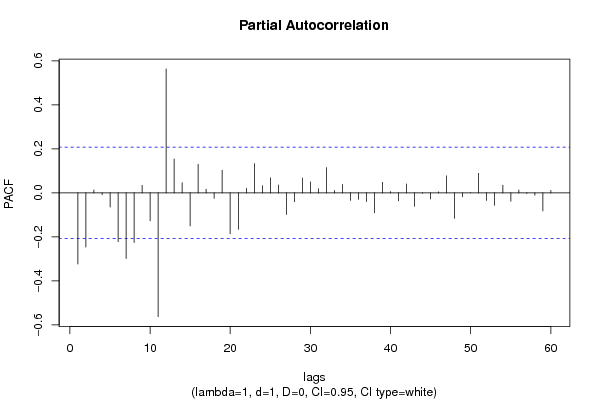
Partial Autocorrelation Function
Time lag kPACF(k)T-STATP-value
1-0.32303-3.04750.001519
2-0.245909-2.31990.011317
30.0127290.12010.452343
4-0.00856-0.08080.467909
5-0.064307-0.60670.272806
6-0.221704-2.09160.019664
7-0.297993-2.81130.003035
8-0.225778-2.130.017966
90.0340610.32130.374358
10-0.12672-1.19550.117538
11-0.562321-5.30490
120.5629875.31120
130.1540381.45320.074843
140.0457140.43130.33366
15-0.150133-1.41640.080081
160.1298641.22510.111879
170.0164480.15520.438518
18-0.024507-0.23120.408844
190.1031030.97270.166675
20-0.185815-1.7530.041524
21-0.165055-1.55710.061494
220.0210340.19840.42158
230.1330961.25560.106268
240.0320330.30220.381603
250.068320.64450.260446
260.0361690.34120.366871
27-0.098021-0.92470.178804
28-0.040197-0.37920.352716
290.0670230.63230.264409
300.0497950.46980.319837
310.0184080.17370.431262
320.1148181.08320.140825
330.0108680.10250.459282
340.0377740.35640.361206
35-0.03407-0.32140.374325
36-0.028978-0.27340.392598
37-0.0389-0.3670.357252
38-0.090482-0.85360.197807
390.0477610.45060.326697
400.0064830.06120.475684
41-0.03559-0.33580.368922
420.0403450.38060.352199
43-0.061154-0.57690.282723
44-0.001919-0.01810.492799
45-0.027759-0.26190.397011
460.0047020.04440.48236
470.077220.72850.234113
48-0.115758-1.09210.138877
49-0.017618-0.16620.434184
500.0004290.00410.498389
510.0885770.83560.202799
52-0.034632-0.32670.372324
53-0.056224-0.53040.298572
540.0350470.33060.37085
55-0.037801-0.35660.361113
560.0124610.11760.453344
57-0.002284-0.02150.491429
58-0.01091-0.10290.459128
59-0.081926-0.77290.220817
600.0106020.10.460276

\begin{tabular}{lllllllll}
\hline
Partial Autocorrelation Function \tabularnewline
Time lag k & PACF(k) & T-STAT & P-value \tabularnewline
1 & -0.32303 & -3.0475 & 0.001519 \tabularnewline
2 & -0.245909 & -2.3199 & 0.011317 \tabularnewline
3 & 0.012729 & 0.1201 & 0.452343 \tabularnewline
4 & -0.00856 & -0.0808 & 0.467909 \tabularnewline
5 & -0.064307 & -0.6067 & 0.272806 \tabularnewline
6 & -0.221704 & -2.0916 & 0.019664 \tabularnewline
7 & -0.297993 & -2.8113 & 0.003035 \tabularnewline
8 & -0.225778 & -2.13 & 0.017966 \tabularnewline
9 & 0.034061 & 0.3213 & 0.374358 \tabularnewline
10 & -0.12672 & -1.1955 & 0.117538 \tabularnewline
11 & -0.562321 & -5.3049 & 0 \tabularnewline
12 & 0.562987 & 5.3112 & 0 \tabularnewline
13 & 0.154038 & 1.4532 & 0.074843 \tabularnewline
14 & 0.045714 & 0.4313 & 0.33366 \tabularnewline
15 & -0.150133 & -1.4164 & 0.080081 \tabularnewline
16 & 0.129864 & 1.2251 & 0.111879 \tabularnewline
17 & 0.016448 & 0.1552 & 0.438518 \tabularnewline
18 & -0.024507 & -0.2312 & 0.408844 \tabularnewline
19 & 0.103103 & 0.9727 & 0.166675 \tabularnewline
20 & -0.185815 & -1.753 & 0.041524 \tabularnewline
21 & -0.165055 & -1.5571 & 0.061494 \tabularnewline
22 & 0.021034 & 0.1984 & 0.42158 \tabularnewline
23 & 0.133096 & 1.2556 & 0.106268 \tabularnewline
24 & 0.032033 & 0.3022 & 0.381603 \tabularnewline
25 & 0.06832 & 0.6445 & 0.260446 \tabularnewline
26 & 0.036169 & 0.3412 & 0.366871 \tabularnewline
27 & -0.098021 & -0.9247 & 0.178804 \tabularnewline
28 & -0.040197 & -0.3792 & 0.352716 \tabularnewline
29 & 0.067023 & 0.6323 & 0.264409 \tabularnewline
30 & 0.049795 & 0.4698 & 0.319837 \tabularnewline
31 & 0.018408 & 0.1737 & 0.431262 \tabularnewline
32 & 0.114818 & 1.0832 & 0.140825 \tabularnewline
33 & 0.010868 & 0.1025 & 0.459282 \tabularnewline
34 & 0.037774 & 0.3564 & 0.361206 \tabularnewline
35 & -0.03407 & -0.3214 & 0.374325 \tabularnewline
36 & -0.028978 & -0.2734 & 0.392598 \tabularnewline
37 & -0.0389 & -0.367 & 0.357252 \tabularnewline
38 & -0.090482 & -0.8536 & 0.197807 \tabularnewline
39 & 0.047761 & 0.4506 & 0.326697 \tabularnewline
40 & 0.006483 & 0.0612 & 0.475684 \tabularnewline
41 & -0.03559 & -0.3358 & 0.368922 \tabularnewline
42 & 0.040345 & 0.3806 & 0.352199 \tabularnewline
43 & -0.061154 & -0.5769 & 0.282723 \tabularnewline
44 & -0.001919 & -0.0181 & 0.492799 \tabularnewline
45 & -0.027759 & -0.2619 & 0.397011 \tabularnewline
46 & 0.004702 & 0.0444 & 0.48236 \tabularnewline
47 & 0.07722 & 0.7285 & 0.234113 \tabularnewline
48 & -0.115758 & -1.0921 & 0.138877 \tabularnewline
49 & -0.017618 & -0.1662 & 0.434184 \tabularnewline
50 & 0.000429 & 0.0041 & 0.498389 \tabularnewline
51 & 0.088577 & 0.8356 & 0.202799 \tabularnewline
52 & -0.034632 & -0.3267 & 0.372324 \tabularnewline
53 & -0.056224 & -0.5304 & 0.298572 \tabularnewline
54 & 0.035047 & 0.3306 & 0.37085 \tabularnewline
55 & -0.037801 & -0.3566 & 0.361113 \tabularnewline
56 & 0.012461 & 0.1176 & 0.453344 \tabularnewline
57 & -0.002284 & -0.0215 & 0.491429 \tabularnewline
58 & -0.01091 & -0.1029 & 0.459128 \tabularnewline
59 & -0.081926 & -0.7729 & 0.220817 \tabularnewline
60 & 0.010602 & 0.1 & 0.460276 \tabularnewline
\hline
\end{tabular}
%Source: https://freestatistics.org/blog/index.php?pk=120492&T=2

[TABLE]
[ROW][C]Partial Autocorrelation Function[/C][/ROW]
[ROW][C]Time lag k[/C][C]PACF(k)[/C][C]T-STAT[/C][C]P-value[/C][/ROW]
[ROW][C]1[/C][C]-0.32303[/C][C]-3.0475[/C][C]0.001519[/C][/ROW]
[ROW][C]2[/C][C]-0.245909[/C][C]-2.3199[/C][C]0.011317[/C][/ROW]
[ROW][C]3[/C][C]0.012729[/C][C]0.1201[/C][C]0.452343[/C][/ROW]
[ROW][C]4[/C][C]-0.00856[/C][C]-0.0808[/C][C]0.467909[/C][/ROW]
[ROW][C]5[/C][C]-0.064307[/C][C]-0.6067[/C][C]0.272806[/C][/ROW]
[ROW][C]6[/C][C]-0.221704[/C][C]-2.0916[/C][C]0.019664[/C][/ROW]
[ROW][C]7[/C][C]-0.297993[/C][C]-2.8113[/C][C]0.003035[/C][/ROW]
[ROW][C]8[/C][C]-0.225778[/C][C]-2.13[/C][C]0.017966[/C][/ROW]
[ROW][C]9[/C][C]0.034061[/C][C]0.3213[/C][C]0.374358[/C][/ROW]
[ROW][C]10[/C][C]-0.12672[/C][C]-1.1955[/C][C]0.117538[/C][/ROW]
[ROW][C]11[/C][C]-0.562321[/C][C]-5.3049[/C][C]0[/C][/ROW]
[ROW][C]12[/C][C]0.562987[/C][C]5.3112[/C][C]0[/C][/ROW]
[ROW][C]13[/C][C]0.154038[/C][C]1.4532[/C][C]0.074843[/C][/ROW]
[ROW][C]14[/C][C]0.045714[/C][C]0.4313[/C][C]0.33366[/C][/ROW]
[ROW][C]15[/C][C]-0.150133[/C][C]-1.4164[/C][C]0.080081[/C][/ROW]
[ROW][C]16[/C][C]0.129864[/C][C]1.2251[/C][C]0.111879[/C][/ROW]
[ROW][C]17[/C][C]0.016448[/C][C]0.1552[/C][C]0.438518[/C][/ROW]
[ROW][C]18[/C][C]-0.024507[/C][C]-0.2312[/C][C]0.408844[/C][/ROW]
[ROW][C]19[/C][C]0.103103[/C][C]0.9727[/C][C]0.166675[/C][/ROW]
[ROW][C]20[/C][C]-0.185815[/C][C]-1.753[/C][C]0.041524[/C][/ROW]
[ROW][C]21[/C][C]-0.165055[/C][C]-1.5571[/C][C]0.061494[/C][/ROW]
[ROW][C]22[/C][C]0.021034[/C][C]0.1984[/C][C]0.42158[/C][/ROW]
[ROW][C]23[/C][C]0.133096[/C][C]1.2556[/C][C]0.106268[/C][/ROW]
[ROW][C]24[/C][C]0.032033[/C][C]0.3022[/C][C]0.381603[/C][/ROW]
[ROW][C]25[/C][C]0.06832[/C][C]0.6445[/C][C]0.260446[/C][/ROW]
[ROW][C]26[/C][C]0.036169[/C][C]0.3412[/C][C]0.366871[/C][/ROW]
[ROW][C]27[/C][C]-0.098021[/C][C]-0.9247[/C][C]0.178804[/C][/ROW]
[ROW][C]28[/C][C]-0.040197[/C][C]-0.3792[/C][C]0.352716[/C][/ROW]
[ROW][C]29[/C][C]0.067023[/C][C]0.6323[/C][C]0.264409[/C][/ROW]
[ROW][C]30[/C][C]0.049795[/C][C]0.4698[/C][C]0.319837[/C][/ROW]
[ROW][C]31[/C][C]0.018408[/C][C]0.1737[/C][C]0.431262[/C][/ROW]
[ROW][C]32[/C][C]0.114818[/C][C]1.0832[/C][C]0.140825[/C][/ROW]
[ROW][C]33[/C][C]0.010868[/C][C]0.1025[/C][C]0.459282[/C][/ROW]
[ROW][C]34[/C][C]0.037774[/C][C]0.3564[/C][C]0.361206[/C][/ROW]
[ROW][C]35[/C][C]-0.03407[/C][C]-0.3214[/C][C]0.374325[/C][/ROW]
[ROW][C]36[/C][C]-0.028978[/C][C]-0.2734[/C][C]0.392598[/C][/ROW]
[ROW][C]37[/C][C]-0.0389[/C][C]-0.367[/C][C]0.357252[/C][/ROW]
[ROW][C]38[/C][C]-0.090482[/C][C]-0.8536[/C][C]0.197807[/C][/ROW]
[ROW][C]39[/C][C]0.047761[/C][C]0.4506[/C][C]0.326697[/C][/ROW]
[ROW][C]40[/C][C]0.006483[/C][C]0.0612[/C][C]0.475684[/C][/ROW]
[ROW][C]41[/C][C]-0.03559[/C][C]-0.3358[/C][C]0.368922[/C][/ROW]
[ROW][C]42[/C][C]0.040345[/C][C]0.3806[/C][C]0.352199[/C][/ROW]
[ROW][C]43[/C][C]-0.061154[/C][C]-0.5769[/C][C]0.282723[/C][/ROW]
[ROW][C]44[/C][C]-0.001919[/C][C]-0.0181[/C][C]0.492799[/C][/ROW]
[ROW][C]45[/C][C]-0.027759[/C][C]-0.2619[/C][C]0.397011[/C][/ROW]
[ROW][C]46[/C][C]0.004702[/C][C]0.0444[/C][C]0.48236[/C][/ROW]
[ROW][C]47[/C][C]0.07722[/C][C]0.7285[/C][C]0.234113[/C][/ROW]
[ROW][C]48[/C][C]-0.115758[/C][C]-1.0921[/C][C]0.138877[/C][/ROW]
[ROW][C]49[/C][C]-0.017618[/C][C]-0.1662[/C][C]0.434184[/C][/ROW]
[ROW][C]50[/C][C]0.000429[/C][C]0.0041[/C][C]0.498389[/C][/ROW]
[ROW][C]51[/C][C]0.088577[/C][C]0.8356[/C][C]0.202799[/C][/ROW]
[ROW][C]52[/C][C]-0.034632[/C][C]-0.3267[/C][C]0.372324[/C][/ROW]
[ROW][C]53[/C][C]-0.056224[/C][C]-0.5304[/C][C]0.298572[/C][/ROW]
[ROW][C]54[/C][C]0.035047[/C][C]0.3306[/C][C]0.37085[/C][/ROW]
[ROW][C]55[/C][C]-0.037801[/C][C]-0.3566[/C][C]0.361113[/C][/ROW]
[ROW][C]56[/C][C]0.012461[/C][C]0.1176[/C][C]0.453344[/C][/ROW]
[ROW][C]57[/C][C]-0.002284[/C][C]-0.0215[/C][C]0.491429[/C][/ROW]
[ROW][C]58[/C][C]-0.01091[/C][C]-0.1029[/C][C]0.459128[/C][/ROW]
[ROW][C]59[/C][C]-0.081926[/C][C]-0.7729[/C][C]0.220817[/C][/ROW]
[ROW][C]60[/C][C]0.010602[/C][C]0.1[/C][C]0.460276[/C][/ROW]
[/TABLE]
Source: https://freestatistics.org/blog/index.php?pk=120492&T=2

Globally Unique Identifier (entire table): ba.freestatistics.org/blog/index.php?pk=120492&T=2

As an alternative you can also use a QR Code:  

The GUIDs for individual cells are displayed in the table below:

Partial Autocorrelation Function
Time lag kPACF(k)T-STATP-value
1-0.32303-3.04750.001519
2-0.245909-2.31990.011317
30.0127290.12010.452343
4-0.00856-0.08080.467909
5-0.064307-0.60670.272806
6-0.221704-2.09160.019664
7-0.297993-2.81130.003035
8-0.225778-2.130.017966
90.0340610.32130.374358
10-0.12672-1.19550.117538
11-0.562321-5.30490
120.5629875.31120
130.1540381.45320.074843
140.0457140.43130.33366
15-0.150133-1.41640.080081
160.1298641.22510.111879
170.0164480.15520.438518
18-0.024507-0.23120.408844
190.1031030.97270.166675
20-0.185815-1.7530.041524
21-0.165055-1.55710.061494
220.0210340.19840.42158
230.1330961.25560.106268
240.0320330.30220.381603
250.068320.64450.260446
260.0361690.34120.366871
27-0.098021-0.92470.178804
28-0.040197-0.37920.352716
290.0670230.63230.264409
300.0497950.46980.319837
310.0184080.17370.431262
320.1148181.08320.140825
330.0108680.10250.459282
340.0377740.35640.361206
35-0.03407-0.32140.374325
36-0.028978-0.27340.392598
37-0.0389-0.3670.357252
38-0.090482-0.85360.197807
390.0477610.45060.326697
400.0064830.06120.475684
41-0.03559-0.33580.368922
420.0403450.38060.352199
43-0.061154-0.57690.282723
44-0.001919-0.01810.492799
45-0.027759-0.26190.397011
460.0047020.04440.48236
470.077220.72850.234113
48-0.115758-1.09210.138877
49-0.017618-0.16620.434184
500.0004290.00410.498389
510.0885770.83560.202799
52-0.034632-0.32670.372324
53-0.056224-0.53040.298572
540.0350470.33060.37085
55-0.037801-0.35660.361113
560.0124610.11760.453344
57-0.002284-0.02150.491429
58-0.01091-0.10290.459128
59-0.081926-0.77290.220817
600.0106020.10.460276


Parameters (Session):
par1 = 60 ; par2 = 1 ; par3 = 1 ; par4 = 0 ; par5 = 12 ; par6 = White Noise ; par7 = 0.95 ;
Parameters (R input):
par1 = 60 ; par2 = 1 ; par3 = 1 ; par4 = 0 ; par5 = 12 ; par6 = White Noise ; par7 = 0.95 ; par8 = ;
R code (references can be found in the software module):
if (par1 == 'Default') {
par1 = 10*log10(length(x))
} else {
par1 <- as.numeric(par1)
}
par2 <- as.numeric(par2)
par3 <- as.numeric(par3)
par4 <- as.numeric(par4)
par5 <- as.numeric(par5)
if (par6 == 'White Noise') par6 <- 'white' else par6 <- 'ma'
par7 <- as.numeric(par7)
if (par8 != '') par8 <- as.numeric(par8)
ox <- x
if (par8 == '') {
if (par2 == 0) {
x <- log(x)
} else {
x <- (x ^ par2 - 1) / par2
}
} else {
x <- log(x,base=par8)
}
if (par3 > 0) x <- diff(x,lag=1,difference=par3)
if (par4 > 0) x <- diff(x,lag=par5,difference=par4)
bitmap(file='picts.png')
op <- par(mfrow=c(2,1))
plot(ox,type='l',main='Original Time Series',xlab='time',ylab='value')
if (par8=='') {
mytitle <- paste('Working Time Series (lambda=',par2,', d=',par3,', D=',par4,')',sep='')
mysub <- paste('(lambda=',par2,', d=',par3,', D=',par4,', CI=', par7, ', CI type=',par6,')',sep='')
} else {
mytitle <- paste('Working Time Series (base=',par8,', d=',par3,', D=',par4,')',sep='')
mysub <- paste('(base=',par8,', d=',par3,', D=',par4,', CI=', par7, ', CI type=',par6,')',sep='')
}
plot(x,type='l', main=mytitle,xlab='time',ylab='value')
par(op)
dev.off()
bitmap(file='pic1.png')
racf <- acf(x, par1, main='Autocorrelation', xlab='time lag', ylab='ACF', ci.type=par6, ci=par7, sub=mysub)
dev.off()
bitmap(file='pic2.png')
rpacf <- pacf(x,par1,main='Partial Autocorrelation',xlab='lags',ylab='PACF',sub=mysub)
dev.off()
(myacf <- c(racf$acf))
(mypacf <- c(rpacf$acf))
lengthx <- length(x)
sqrtn <- sqrt(lengthx)
load(file='createtable')
a<-table.start()
a<-table.row.start(a)
a<-table.element(a,'Autocorrelation Function',4,TRUE)
a<-table.row.end(a)
a<-table.row.start(a)
a<-table.element(a,'Time lag k',header=TRUE)
a<-table.element(a,hyperlink('basics.htm','ACF(k)','click here for more information about the Autocorrelation Function'),header=TRUE)
a<-table.element(a,'T-STAT',header=TRUE)
a<-table.element(a,'P-value',header=TRUE)
a<-table.row.end(a)
for (i in 2:(par1+1)) {
a<-table.row.start(a)
a<-table.element(a,i-1,header=TRUE)
a<-table.element(a,round(myacf[i],6))
mytstat <- myacf[i]*sqrtn
a<-table.element(a,round(mytstat,4))
a<-table.element(a,round(1-pt(abs(mytstat),lengthx),6))
a<-table.row.end(a)
}
a<-table.end(a)
table.save(a,file='mytable.tab')
a<-table.start()
a<-table.row.start(a)
a<-table.element(a,'Partial Autocorrelation Function',4,TRUE)
a<-table.row.end(a)
a<-table.row.start(a)
a<-table.element(a,'Time lag k',header=TRUE)
a<-table.element(a,hyperlink('basics.htm','PACF(k)','click here for more information about the Partial Autocorrelation Function'),header=TRUE)
a<-table.element(a,'T-STAT',header=TRUE)
a<-table.element(a,'P-value',header=TRUE)
a<-table.row.end(a)
for (i in 1:par1) {
a<-table.row.start(a)
a<-table.element(a,i,header=TRUE)
a<-table.element(a,round(mypacf[i],6))
mytstat <- mypacf[i]*sqrtn
a<-table.element(a,round(mytstat,4))
a<-table.element(a,round(1-pt(abs(mytstat),lengthx),6))
a<-table.row.end(a)
}
a<-table.end(a)
table.save(a,file='mytable1.tab')