Free Statistics

of Irreproducible Research!

Author's title

Differentiatie autocorrelatie-Inschrijvingen nieuwe personenwagens (eigen r...

Author*Unverified author*
R Software Modulerwasp_autocorrelation.wasp
Title produced by software(Partial) Autocorrelation Function
Date of computationMon, 11 Apr 2011 19:16:52 +0000
Cite this page as followsStatistical Computations at FreeStatistics.org, Office for Research Development and Education, URL https://freestatistics.org/blog/index.php?v=date/2011/Apr/11/t13025493217vgaxzkkflpd6ur.htm/, Retrieved Thu, 09 May 2024 19:20:50 +0000
Statistical Computations at FreeStatistics.org, Office for Research Development and Education, URL https://freestatistics.org/blog/index.php?pk=120491, Retrieved Thu, 09 May 2024 19:20:50 +0000
QR Codes:

Original text written by user:
IsPrivate?No (this computation is public)
User-defined keywordsKDGP2W12
Estimated Impact132
Family? (F = Feedback message, R = changed R code, M = changed R Module, P = changed Parameters, D = changed Data)
-       [(Partial) Autocorrelation Function] [Differentiatie au...] [2011-04-11 19:16:52] [ebb64913e7d7e5b0e5266ebfea2a3acd] [Current]
Feedback Forum

Post a new message
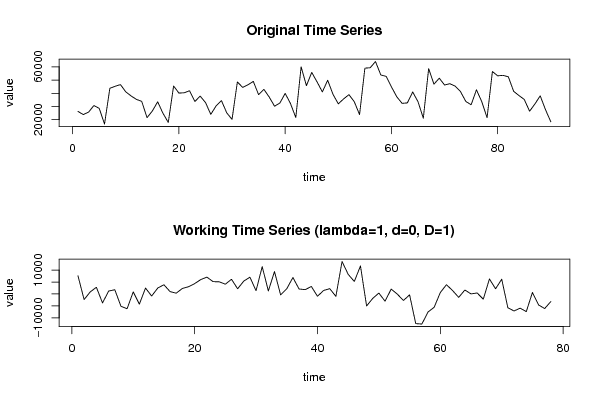
Dataseries X:
26281
23899
25727
30733
28599
16723
43738
45272
46532
41032
37967
35366
33892
21560
26588
33527
24859
17952
45504
40129
40357
41913
33730
37842
33025
24050
30429
34507
25189
20253
48527
44446
46380
48950
38883
42928
37107
30186
32602
39892
32194
21629
59968
45694
55756
48554
41052
49822
39191
31994
35735
38930
33658
23849
58972
59249
63955
53785
52760
44795
37348
32370
32717
40974
33591
21124
58608
46865
51378
46235
47206
45382
41227
33795
31295
42625
33625
21538
56421
53152
53536
52408
41454
38271
35306
26414
31917
38030
27534
18387


Summary of computational transaction
Raw Inputview raw input (R code)
Raw Outputview raw output of R engine
Computing time2 seconds
R Server'RServer@AstonUniversity' @ vre.aston.ac.uk

\begin{tabular}{lllllllll}
\hline
Summary of computational transaction \tabularnewline
Raw Input & view raw input (R code)  \tabularnewline
Raw Output & view raw output of R engine  \tabularnewline
Computing time & 2 seconds \tabularnewline
R Server & 'RServer@AstonUniversity' @ vre.aston.ac.uk \tabularnewline
\hline
\end{tabular}
%Source: https://freestatistics.org/blog/index.php?pk=120491&T=0

[TABLE]
[ROW][C]Summary of computational transaction[/C][/ROW]
[ROW][C]Raw Input[/C][C]view raw input (R code) [/C][/ROW]
[ROW][C]Raw Output[/C][C]view raw output of R engine [/C][/ROW]
[ROW][C]Computing time[/C][C]2 seconds[/C][/ROW]
[ROW][C]R Server[/C][C]'RServer@AstonUniversity' @ vre.aston.ac.uk[/C][/ROW]
[/TABLE]
Source: https://freestatistics.org/blog/index.php?pk=120491&T=0

Globally Unique Identifier (entire table): ba.freestatistics.org/blog/index.php?pk=120491&T=0

As an alternative you can also use a QR Code:  

The GUIDs for individual cells are displayed in the table below:

Summary of computational transaction
Raw Inputview raw input (R code)
Raw Outputview raw output of R engine
Computing time2 seconds
R Server'RServer@AstonUniversity' @ vre.aston.ac.uk


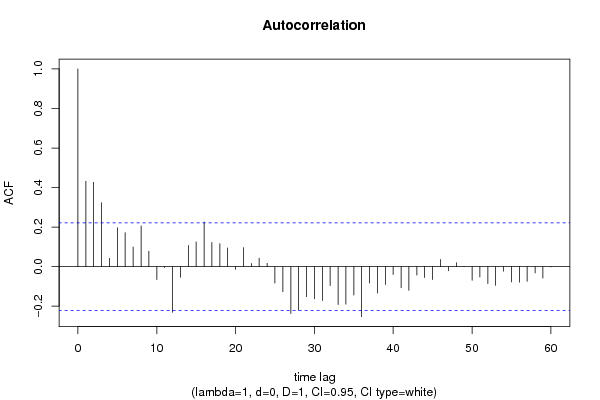
Autocorrelation Function
Time lag kACF(k)T-STATP-value
10.4323773.81860.000134
20.426253.76450.000161
30.3234042.85620.002746
40.0419420.37040.356035
50.1970711.74050.042859
60.1716021.51550.066838
70.0989490.87390.192429
80.2053161.81330.036816
90.0783150.69170.245604
10-0.065681-0.58010.281766
11-0.004769-0.04210.483254
12-0.231047-2.04060.02234
13-0.053917-0.47620.317637
140.1072850.94750.173152
150.1251831.10560.136152
160.2256891.99320.024866
170.1223841.08090.141544
180.1155141.02020.155397
190.0944520.83420.203364
20-0.013942-0.12310.451161
210.0962980.85050.198831
220.0162070.14310.443277
230.0429560.37940.35272
240.0166230.14680.441832
25-0.082656-0.730.233789
26-0.127064-1.12220.132611
27-0.237649-2.09890.019532
28-0.220262-1.94530.027671
29-0.151817-1.34080.091937
30-0.162191-1.43240.078008
31-0.171439-1.51410.06702
32-0.095611-0.84440.20051
33-0.19213-1.69680.046857
34-0.189887-1.6770.048769
35-0.143161-1.26440.104932
36-0.25298-2.23430.014165
37-0.082686-0.73030.233709
38-0.133442-1.17850.121085
39-0.090038-0.79520.214457
40-0.039981-0.35310.362482
41-0.106624-0.94170.174633
42-0.119657-1.05680.146937
43-0.042682-0.3770.353614
44-0.055484-0.490.312746
45-0.065399-0.57760.282604
460.0361030.31890.375344
47-0.020721-0.1830.427634
480.0201620.17810.429567
490.0011530.01020.495949
50-0.068813-0.60770.272561
51-0.051913-0.45850.323939
52-0.085209-0.75250.226995
53-0.094266-0.83250.203825
54-0.022841-0.20170.420329
55-0.077324-0.68290.248345
56-0.078615-0.69430.244777
57-0.073917-0.65280.257898
58-0.031617-0.27920.390403
59-0.057703-0.50960.30588
60-0.001328-0.01170.495336

\begin{tabular}{lllllllll}
\hline
Autocorrelation Function \tabularnewline
Time lag k & ACF(k) & T-STAT & P-value \tabularnewline
1 & 0.432377 & 3.8186 & 0.000134 \tabularnewline
2 & 0.42625 & 3.7645 & 0.000161 \tabularnewline
3 & 0.323404 & 2.8562 & 0.002746 \tabularnewline
4 & 0.041942 & 0.3704 & 0.356035 \tabularnewline
5 & 0.197071 & 1.7405 & 0.042859 \tabularnewline
6 & 0.171602 & 1.5155 & 0.066838 \tabularnewline
7 & 0.098949 & 0.8739 & 0.192429 \tabularnewline
8 & 0.205316 & 1.8133 & 0.036816 \tabularnewline
9 & 0.078315 & 0.6917 & 0.245604 \tabularnewline
10 & -0.065681 & -0.5801 & 0.281766 \tabularnewline
11 & -0.004769 & -0.0421 & 0.483254 \tabularnewline
12 & -0.231047 & -2.0406 & 0.02234 \tabularnewline
13 & -0.053917 & -0.4762 & 0.317637 \tabularnewline
14 & 0.107285 & 0.9475 & 0.173152 \tabularnewline
15 & 0.125183 & 1.1056 & 0.136152 \tabularnewline
16 & 0.225689 & 1.9932 & 0.024866 \tabularnewline
17 & 0.122384 & 1.0809 & 0.141544 \tabularnewline
18 & 0.115514 & 1.0202 & 0.155397 \tabularnewline
19 & 0.094452 & 0.8342 & 0.203364 \tabularnewline
20 & -0.013942 & -0.1231 & 0.451161 \tabularnewline
21 & 0.096298 & 0.8505 & 0.198831 \tabularnewline
22 & 0.016207 & 0.1431 & 0.443277 \tabularnewline
23 & 0.042956 & 0.3794 & 0.35272 \tabularnewline
24 & 0.016623 & 0.1468 & 0.441832 \tabularnewline
25 & -0.082656 & -0.73 & 0.233789 \tabularnewline
26 & -0.127064 & -1.1222 & 0.132611 \tabularnewline
27 & -0.237649 & -2.0989 & 0.019532 \tabularnewline
28 & -0.220262 & -1.9453 & 0.027671 \tabularnewline
29 & -0.151817 & -1.3408 & 0.091937 \tabularnewline
30 & -0.162191 & -1.4324 & 0.078008 \tabularnewline
31 & -0.171439 & -1.5141 & 0.06702 \tabularnewline
32 & -0.095611 & -0.8444 & 0.20051 \tabularnewline
33 & -0.19213 & -1.6968 & 0.046857 \tabularnewline
34 & -0.189887 & -1.677 & 0.048769 \tabularnewline
35 & -0.143161 & -1.2644 & 0.104932 \tabularnewline
36 & -0.25298 & -2.2343 & 0.014165 \tabularnewline
37 & -0.082686 & -0.7303 & 0.233709 \tabularnewline
38 & -0.133442 & -1.1785 & 0.121085 \tabularnewline
39 & -0.090038 & -0.7952 & 0.214457 \tabularnewline
40 & -0.039981 & -0.3531 & 0.362482 \tabularnewline
41 & -0.106624 & -0.9417 & 0.174633 \tabularnewline
42 & -0.119657 & -1.0568 & 0.146937 \tabularnewline
43 & -0.042682 & -0.377 & 0.353614 \tabularnewline
44 & -0.055484 & -0.49 & 0.312746 \tabularnewline
45 & -0.065399 & -0.5776 & 0.282604 \tabularnewline
46 & 0.036103 & 0.3189 & 0.375344 \tabularnewline
47 & -0.020721 & -0.183 & 0.427634 \tabularnewline
48 & 0.020162 & 0.1781 & 0.429567 \tabularnewline
49 & 0.001153 & 0.0102 & 0.495949 \tabularnewline
50 & -0.068813 & -0.6077 & 0.272561 \tabularnewline
51 & -0.051913 & -0.4585 & 0.323939 \tabularnewline
52 & -0.085209 & -0.7525 & 0.226995 \tabularnewline
53 & -0.094266 & -0.8325 & 0.203825 \tabularnewline
54 & -0.022841 & -0.2017 & 0.420329 \tabularnewline
55 & -0.077324 & -0.6829 & 0.248345 \tabularnewline
56 & -0.078615 & -0.6943 & 0.244777 \tabularnewline
57 & -0.073917 & -0.6528 & 0.257898 \tabularnewline
58 & -0.031617 & -0.2792 & 0.390403 \tabularnewline
59 & -0.057703 & -0.5096 & 0.30588 \tabularnewline
60 & -0.001328 & -0.0117 & 0.495336 \tabularnewline
\hline
\end{tabular}
%Source: https://freestatistics.org/blog/index.php?pk=120491&T=1

[TABLE]
[ROW][C]Autocorrelation Function[/C][/ROW]
[ROW][C]Time lag k[/C][C]ACF(k)[/C][C]T-STAT[/C][C]P-value[/C][/ROW]
[ROW][C]1[/C][C]0.432377[/C][C]3.8186[/C][C]0.000134[/C][/ROW]
[ROW][C]2[/C][C]0.42625[/C][C]3.7645[/C][C]0.000161[/C][/ROW]
[ROW][C]3[/C][C]0.323404[/C][C]2.8562[/C][C]0.002746[/C][/ROW]
[ROW][C]4[/C][C]0.041942[/C][C]0.3704[/C][C]0.356035[/C][/ROW]
[ROW][C]5[/C][C]0.197071[/C][C]1.7405[/C][C]0.042859[/C][/ROW]
[ROW][C]6[/C][C]0.171602[/C][C]1.5155[/C][C]0.066838[/C][/ROW]
[ROW][C]7[/C][C]0.098949[/C][C]0.8739[/C][C]0.192429[/C][/ROW]
[ROW][C]8[/C][C]0.205316[/C][C]1.8133[/C][C]0.036816[/C][/ROW]
[ROW][C]9[/C][C]0.078315[/C][C]0.6917[/C][C]0.245604[/C][/ROW]
[ROW][C]10[/C][C]-0.065681[/C][C]-0.5801[/C][C]0.281766[/C][/ROW]
[ROW][C]11[/C][C]-0.004769[/C][C]-0.0421[/C][C]0.483254[/C][/ROW]
[ROW][C]12[/C][C]-0.231047[/C][C]-2.0406[/C][C]0.02234[/C][/ROW]
[ROW][C]13[/C][C]-0.053917[/C][C]-0.4762[/C][C]0.317637[/C][/ROW]
[ROW][C]14[/C][C]0.107285[/C][C]0.9475[/C][C]0.173152[/C][/ROW]
[ROW][C]15[/C][C]0.125183[/C][C]1.1056[/C][C]0.136152[/C][/ROW]
[ROW][C]16[/C][C]0.225689[/C][C]1.9932[/C][C]0.024866[/C][/ROW]
[ROW][C]17[/C][C]0.122384[/C][C]1.0809[/C][C]0.141544[/C][/ROW]
[ROW][C]18[/C][C]0.115514[/C][C]1.0202[/C][C]0.155397[/C][/ROW]
[ROW][C]19[/C][C]0.094452[/C][C]0.8342[/C][C]0.203364[/C][/ROW]
[ROW][C]20[/C][C]-0.013942[/C][C]-0.1231[/C][C]0.451161[/C][/ROW]
[ROW][C]21[/C][C]0.096298[/C][C]0.8505[/C][C]0.198831[/C][/ROW]
[ROW][C]22[/C][C]0.016207[/C][C]0.1431[/C][C]0.443277[/C][/ROW]
[ROW][C]23[/C][C]0.042956[/C][C]0.3794[/C][C]0.35272[/C][/ROW]
[ROW][C]24[/C][C]0.016623[/C][C]0.1468[/C][C]0.441832[/C][/ROW]
[ROW][C]25[/C][C]-0.082656[/C][C]-0.73[/C][C]0.233789[/C][/ROW]
[ROW][C]26[/C][C]-0.127064[/C][C]-1.1222[/C][C]0.132611[/C][/ROW]
[ROW][C]27[/C][C]-0.237649[/C][C]-2.0989[/C][C]0.019532[/C][/ROW]
[ROW][C]28[/C][C]-0.220262[/C][C]-1.9453[/C][C]0.027671[/C][/ROW]
[ROW][C]29[/C][C]-0.151817[/C][C]-1.3408[/C][C]0.091937[/C][/ROW]
[ROW][C]30[/C][C]-0.162191[/C][C]-1.4324[/C][C]0.078008[/C][/ROW]
[ROW][C]31[/C][C]-0.171439[/C][C]-1.5141[/C][C]0.06702[/C][/ROW]
[ROW][C]32[/C][C]-0.095611[/C][C]-0.8444[/C][C]0.20051[/C][/ROW]
[ROW][C]33[/C][C]-0.19213[/C][C]-1.6968[/C][C]0.046857[/C][/ROW]
[ROW][C]34[/C][C]-0.189887[/C][C]-1.677[/C][C]0.048769[/C][/ROW]
[ROW][C]35[/C][C]-0.143161[/C][C]-1.2644[/C][C]0.104932[/C][/ROW]
[ROW][C]36[/C][C]-0.25298[/C][C]-2.2343[/C][C]0.014165[/C][/ROW]
[ROW][C]37[/C][C]-0.082686[/C][C]-0.7303[/C][C]0.233709[/C][/ROW]
[ROW][C]38[/C][C]-0.133442[/C][C]-1.1785[/C][C]0.121085[/C][/ROW]
[ROW][C]39[/C][C]-0.090038[/C][C]-0.7952[/C][C]0.214457[/C][/ROW]
[ROW][C]40[/C][C]-0.039981[/C][C]-0.3531[/C][C]0.362482[/C][/ROW]
[ROW][C]41[/C][C]-0.106624[/C][C]-0.9417[/C][C]0.174633[/C][/ROW]
[ROW][C]42[/C][C]-0.119657[/C][C]-1.0568[/C][C]0.146937[/C][/ROW]
[ROW][C]43[/C][C]-0.042682[/C][C]-0.377[/C][C]0.353614[/C][/ROW]
[ROW][C]44[/C][C]-0.055484[/C][C]-0.49[/C][C]0.312746[/C][/ROW]
[ROW][C]45[/C][C]-0.065399[/C][C]-0.5776[/C][C]0.282604[/C][/ROW]
[ROW][C]46[/C][C]0.036103[/C][C]0.3189[/C][C]0.375344[/C][/ROW]
[ROW][C]47[/C][C]-0.020721[/C][C]-0.183[/C][C]0.427634[/C][/ROW]
[ROW][C]48[/C][C]0.020162[/C][C]0.1781[/C][C]0.429567[/C][/ROW]
[ROW][C]49[/C][C]0.001153[/C][C]0.0102[/C][C]0.495949[/C][/ROW]
[ROW][C]50[/C][C]-0.068813[/C][C]-0.6077[/C][C]0.272561[/C][/ROW]
[ROW][C]51[/C][C]-0.051913[/C][C]-0.4585[/C][C]0.323939[/C][/ROW]
[ROW][C]52[/C][C]-0.085209[/C][C]-0.7525[/C][C]0.226995[/C][/ROW]
[ROW][C]53[/C][C]-0.094266[/C][C]-0.8325[/C][C]0.203825[/C][/ROW]
[ROW][C]54[/C][C]-0.022841[/C][C]-0.2017[/C][C]0.420329[/C][/ROW]
[ROW][C]55[/C][C]-0.077324[/C][C]-0.6829[/C][C]0.248345[/C][/ROW]
[ROW][C]56[/C][C]-0.078615[/C][C]-0.6943[/C][C]0.244777[/C][/ROW]
[ROW][C]57[/C][C]-0.073917[/C][C]-0.6528[/C][C]0.257898[/C][/ROW]
[ROW][C]58[/C][C]-0.031617[/C][C]-0.2792[/C][C]0.390403[/C][/ROW]
[ROW][C]59[/C][C]-0.057703[/C][C]-0.5096[/C][C]0.30588[/C][/ROW]
[ROW][C]60[/C][C]-0.001328[/C][C]-0.0117[/C][C]0.495336[/C][/ROW]
[/TABLE]
Source: https://freestatistics.org/blog/index.php?pk=120491&T=1

Globally Unique Identifier (entire table): ba.freestatistics.org/blog/index.php?pk=120491&T=1

As an alternative you can also use a QR Code:  

The GUIDs for individual cells are displayed in the table below:

Autocorrelation Function
Time lag kACF(k)T-STATP-value
10.4323773.81860.000134
20.426253.76450.000161
30.3234042.85620.002746
40.0419420.37040.356035
50.1970711.74050.042859
60.1716021.51550.066838
70.0989490.87390.192429
80.2053161.81330.036816
90.0783150.69170.245604
10-0.065681-0.58010.281766
11-0.004769-0.04210.483254
12-0.231047-2.04060.02234
13-0.053917-0.47620.317637
140.1072850.94750.173152
150.1251831.10560.136152
160.2256891.99320.024866
170.1223841.08090.141544
180.1155141.02020.155397
190.0944520.83420.203364
20-0.013942-0.12310.451161
210.0962980.85050.198831
220.0162070.14310.443277
230.0429560.37940.35272
240.0166230.14680.441832
25-0.082656-0.730.233789
26-0.127064-1.12220.132611
27-0.237649-2.09890.019532
28-0.220262-1.94530.027671
29-0.151817-1.34080.091937
30-0.162191-1.43240.078008
31-0.171439-1.51410.06702
32-0.095611-0.84440.20051
33-0.19213-1.69680.046857
34-0.189887-1.6770.048769
35-0.143161-1.26440.104932
36-0.25298-2.23430.014165
37-0.082686-0.73030.233709
38-0.133442-1.17850.121085
39-0.090038-0.79520.214457
40-0.039981-0.35310.362482
41-0.106624-0.94170.174633
42-0.119657-1.05680.146937
43-0.042682-0.3770.353614
44-0.055484-0.490.312746
45-0.065399-0.57760.282604
460.0361030.31890.375344
47-0.020721-0.1830.427634
480.0201620.17810.429567
490.0011530.01020.495949
50-0.068813-0.60770.272561
51-0.051913-0.45850.323939
52-0.085209-0.75250.226995
53-0.094266-0.83250.203825
54-0.022841-0.20170.420329
55-0.077324-0.68290.248345
56-0.078615-0.69430.244777
57-0.073917-0.65280.257898
58-0.031617-0.27920.390403
59-0.057703-0.50960.30588
60-0.001328-0.01170.495336


Partial Autocorrelation Function
Time lag kPACF(k)T-STATP-value
10.4323773.81860.000134
20.2943242.59940.005582
30.0889940.7860.217131
4-0.272313-2.4050.009271
50.1786461.57780.059334
60.1778781.5710.060118
7-0.05494-0.48520.31444
80.0121740.10750.457326
9-0.017859-0.15770.437539
10-0.20002-1.76650.040609
11-0.005693-0.05030.480015
12-0.166951-1.47450.07219
130.1607161.41940.079882
140.2659292.34860.010688
150.1734311.53170.064821
16-0.072782-0.64280.261122
17-0.115717-1.0220.154974
180.1556811.37490.086544
190.0384780.33980.367448
20-0.208458-1.84110.034708
210.053690.47420.31835
22-0.118237-1.04420.1498
23-0.021123-0.18660.426247
24-0.176945-1.56270.061082
25-0.005128-0.04530.481996
260.0684840.60480.273523
27-0.105394-0.93080.177411
28-0.018419-0.16270.435598
290.0055540.04910.480502
30-0.005088-0.04490.482137
31-0.093151-0.82270.206596
32-0.064703-0.57140.284672
330.0150230.13270.447396
34-0.162228-1.43280.077961
350.0127830.11290.4552
36-0.1806-1.5950.057376
370.0760720.67190.251831
380.0163120.14410.442912
39-0.028342-0.25030.401501
40-0.000684-0.0060.497599
410.1392991.23030.11115
42-0.010985-0.0970.461481
430.054990.48570.314286
440.0402390.35540.361631
450.0368640.32560.372809
46-0.043475-0.3840.351025
470.0507960.44860.327476
48-0.029082-0.25680.398986
490.0099260.08770.465184
50-0.069177-0.6110.271503
51-0.041686-0.36820.356877
52-0.026992-0.23840.406102
53-0.001109-0.00980.496104
540.0277950.24550.403364
55-0.032344-0.28570.387948
56-0.046664-0.41210.340689
57-6.1e-05-5e-040.499785
580.0482210.42590.335687
59-0.010424-0.09210.463441
60-0.060507-0.53440.297299

\begin{tabular}{lllllllll}
\hline
Partial Autocorrelation Function \tabularnewline
Time lag k & PACF(k) & T-STAT & P-value \tabularnewline
1 & 0.432377 & 3.8186 & 0.000134 \tabularnewline
2 & 0.294324 & 2.5994 & 0.005582 \tabularnewline
3 & 0.088994 & 0.786 & 0.217131 \tabularnewline
4 & -0.272313 & -2.405 & 0.009271 \tabularnewline
5 & 0.178646 & 1.5778 & 0.059334 \tabularnewline
6 & 0.177878 & 1.571 & 0.060118 \tabularnewline
7 & -0.05494 & -0.4852 & 0.31444 \tabularnewline
8 & 0.012174 & 0.1075 & 0.457326 \tabularnewline
9 & -0.017859 & -0.1577 & 0.437539 \tabularnewline
10 & -0.20002 & -1.7665 & 0.040609 \tabularnewline
11 & -0.005693 & -0.0503 & 0.480015 \tabularnewline
12 & -0.166951 & -1.4745 & 0.07219 \tabularnewline
13 & 0.160716 & 1.4194 & 0.079882 \tabularnewline
14 & 0.265929 & 2.3486 & 0.010688 \tabularnewline
15 & 0.173431 & 1.5317 & 0.064821 \tabularnewline
16 & -0.072782 & -0.6428 & 0.261122 \tabularnewline
17 & -0.115717 & -1.022 & 0.154974 \tabularnewline
18 & 0.155681 & 1.3749 & 0.086544 \tabularnewline
19 & 0.038478 & 0.3398 & 0.367448 \tabularnewline
20 & -0.208458 & -1.8411 & 0.034708 \tabularnewline
21 & 0.05369 & 0.4742 & 0.31835 \tabularnewline
22 & -0.118237 & -1.0442 & 0.1498 \tabularnewline
23 & -0.021123 & -0.1866 & 0.426247 \tabularnewline
24 & -0.176945 & -1.5627 & 0.061082 \tabularnewline
25 & -0.005128 & -0.0453 & 0.481996 \tabularnewline
26 & 0.068484 & 0.6048 & 0.273523 \tabularnewline
27 & -0.105394 & -0.9308 & 0.177411 \tabularnewline
28 & -0.018419 & -0.1627 & 0.435598 \tabularnewline
29 & 0.005554 & 0.0491 & 0.480502 \tabularnewline
30 & -0.005088 & -0.0449 & 0.482137 \tabularnewline
31 & -0.093151 & -0.8227 & 0.206596 \tabularnewline
32 & -0.064703 & -0.5714 & 0.284672 \tabularnewline
33 & 0.015023 & 0.1327 & 0.447396 \tabularnewline
34 & -0.162228 & -1.4328 & 0.077961 \tabularnewline
35 & 0.012783 & 0.1129 & 0.4552 \tabularnewline
36 & -0.1806 & -1.595 & 0.057376 \tabularnewline
37 & 0.076072 & 0.6719 & 0.251831 \tabularnewline
38 & 0.016312 & 0.1441 & 0.442912 \tabularnewline
39 & -0.028342 & -0.2503 & 0.401501 \tabularnewline
40 & -0.000684 & -0.006 & 0.497599 \tabularnewline
41 & 0.139299 & 1.2303 & 0.11115 \tabularnewline
42 & -0.010985 & -0.097 & 0.461481 \tabularnewline
43 & 0.05499 & 0.4857 & 0.314286 \tabularnewline
44 & 0.040239 & 0.3554 & 0.361631 \tabularnewline
45 & 0.036864 & 0.3256 & 0.372809 \tabularnewline
46 & -0.043475 & -0.384 & 0.351025 \tabularnewline
47 & 0.050796 & 0.4486 & 0.327476 \tabularnewline
48 & -0.029082 & -0.2568 & 0.398986 \tabularnewline
49 & 0.009926 & 0.0877 & 0.465184 \tabularnewline
50 & -0.069177 & -0.611 & 0.271503 \tabularnewline
51 & -0.041686 & -0.3682 & 0.356877 \tabularnewline
52 & -0.026992 & -0.2384 & 0.406102 \tabularnewline
53 & -0.001109 & -0.0098 & 0.496104 \tabularnewline
54 & 0.027795 & 0.2455 & 0.403364 \tabularnewline
55 & -0.032344 & -0.2857 & 0.387948 \tabularnewline
56 & -0.046664 & -0.4121 & 0.340689 \tabularnewline
57 & -6.1e-05 & -5e-04 & 0.499785 \tabularnewline
58 & 0.048221 & 0.4259 & 0.335687 \tabularnewline
59 & -0.010424 & -0.0921 & 0.463441 \tabularnewline
60 & -0.060507 & -0.5344 & 0.297299 \tabularnewline
\hline
\end{tabular}
%Source: https://freestatistics.org/blog/index.php?pk=120491&T=2

[TABLE]
[ROW][C]Partial Autocorrelation Function[/C][/ROW]
[ROW][C]Time lag k[/C][C]PACF(k)[/C][C]T-STAT[/C][C]P-value[/C][/ROW]
[ROW][C]1[/C][C]0.432377[/C][C]3.8186[/C][C]0.000134[/C][/ROW]
[ROW][C]2[/C][C]0.294324[/C][C]2.5994[/C][C]0.005582[/C][/ROW]
[ROW][C]3[/C][C]0.088994[/C][C]0.786[/C][C]0.217131[/C][/ROW]
[ROW][C]4[/C][C]-0.272313[/C][C]-2.405[/C][C]0.009271[/C][/ROW]
[ROW][C]5[/C][C]0.178646[/C][C]1.5778[/C][C]0.059334[/C][/ROW]
[ROW][C]6[/C][C]0.177878[/C][C]1.571[/C][C]0.060118[/C][/ROW]
[ROW][C]7[/C][C]-0.05494[/C][C]-0.4852[/C][C]0.31444[/C][/ROW]
[ROW][C]8[/C][C]0.012174[/C][C]0.1075[/C][C]0.457326[/C][/ROW]
[ROW][C]9[/C][C]-0.017859[/C][C]-0.1577[/C][C]0.437539[/C][/ROW]
[ROW][C]10[/C][C]-0.20002[/C][C]-1.7665[/C][C]0.040609[/C][/ROW]
[ROW][C]11[/C][C]-0.005693[/C][C]-0.0503[/C][C]0.480015[/C][/ROW]
[ROW][C]12[/C][C]-0.166951[/C][C]-1.4745[/C][C]0.07219[/C][/ROW]
[ROW][C]13[/C][C]0.160716[/C][C]1.4194[/C][C]0.079882[/C][/ROW]
[ROW][C]14[/C][C]0.265929[/C][C]2.3486[/C][C]0.010688[/C][/ROW]
[ROW][C]15[/C][C]0.173431[/C][C]1.5317[/C][C]0.064821[/C][/ROW]
[ROW][C]16[/C][C]-0.072782[/C][C]-0.6428[/C][C]0.261122[/C][/ROW]
[ROW][C]17[/C][C]-0.115717[/C][C]-1.022[/C][C]0.154974[/C][/ROW]
[ROW][C]18[/C][C]0.155681[/C][C]1.3749[/C][C]0.086544[/C][/ROW]
[ROW][C]19[/C][C]0.038478[/C][C]0.3398[/C][C]0.367448[/C][/ROW]
[ROW][C]20[/C][C]-0.208458[/C][C]-1.8411[/C][C]0.034708[/C][/ROW]
[ROW][C]21[/C][C]0.05369[/C][C]0.4742[/C][C]0.31835[/C][/ROW]
[ROW][C]22[/C][C]-0.118237[/C][C]-1.0442[/C][C]0.1498[/C][/ROW]
[ROW][C]23[/C][C]-0.021123[/C][C]-0.1866[/C][C]0.426247[/C][/ROW]
[ROW][C]24[/C][C]-0.176945[/C][C]-1.5627[/C][C]0.061082[/C][/ROW]
[ROW][C]25[/C][C]-0.005128[/C][C]-0.0453[/C][C]0.481996[/C][/ROW]
[ROW][C]26[/C][C]0.068484[/C][C]0.6048[/C][C]0.273523[/C][/ROW]
[ROW][C]27[/C][C]-0.105394[/C][C]-0.9308[/C][C]0.177411[/C][/ROW]
[ROW][C]28[/C][C]-0.018419[/C][C]-0.1627[/C][C]0.435598[/C][/ROW]
[ROW][C]29[/C][C]0.005554[/C][C]0.0491[/C][C]0.480502[/C][/ROW]
[ROW][C]30[/C][C]-0.005088[/C][C]-0.0449[/C][C]0.482137[/C][/ROW]
[ROW][C]31[/C][C]-0.093151[/C][C]-0.8227[/C][C]0.206596[/C][/ROW]
[ROW][C]32[/C][C]-0.064703[/C][C]-0.5714[/C][C]0.284672[/C][/ROW]
[ROW][C]33[/C][C]0.015023[/C][C]0.1327[/C][C]0.447396[/C][/ROW]
[ROW][C]34[/C][C]-0.162228[/C][C]-1.4328[/C][C]0.077961[/C][/ROW]
[ROW][C]35[/C][C]0.012783[/C][C]0.1129[/C][C]0.4552[/C][/ROW]
[ROW][C]36[/C][C]-0.1806[/C][C]-1.595[/C][C]0.057376[/C][/ROW]
[ROW][C]37[/C][C]0.076072[/C][C]0.6719[/C][C]0.251831[/C][/ROW]
[ROW][C]38[/C][C]0.016312[/C][C]0.1441[/C][C]0.442912[/C][/ROW]
[ROW][C]39[/C][C]-0.028342[/C][C]-0.2503[/C][C]0.401501[/C][/ROW]
[ROW][C]40[/C][C]-0.000684[/C][C]-0.006[/C][C]0.497599[/C][/ROW]
[ROW][C]41[/C][C]0.139299[/C][C]1.2303[/C][C]0.11115[/C][/ROW]
[ROW][C]42[/C][C]-0.010985[/C][C]-0.097[/C][C]0.461481[/C][/ROW]
[ROW][C]43[/C][C]0.05499[/C][C]0.4857[/C][C]0.314286[/C][/ROW]
[ROW][C]44[/C][C]0.040239[/C][C]0.3554[/C][C]0.361631[/C][/ROW]
[ROW][C]45[/C][C]0.036864[/C][C]0.3256[/C][C]0.372809[/C][/ROW]
[ROW][C]46[/C][C]-0.043475[/C][C]-0.384[/C][C]0.351025[/C][/ROW]
[ROW][C]47[/C][C]0.050796[/C][C]0.4486[/C][C]0.327476[/C][/ROW]
[ROW][C]48[/C][C]-0.029082[/C][C]-0.2568[/C][C]0.398986[/C][/ROW]
[ROW][C]49[/C][C]0.009926[/C][C]0.0877[/C][C]0.465184[/C][/ROW]
[ROW][C]50[/C][C]-0.069177[/C][C]-0.611[/C][C]0.271503[/C][/ROW]
[ROW][C]51[/C][C]-0.041686[/C][C]-0.3682[/C][C]0.356877[/C][/ROW]
[ROW][C]52[/C][C]-0.026992[/C][C]-0.2384[/C][C]0.406102[/C][/ROW]
[ROW][C]53[/C][C]-0.001109[/C][C]-0.0098[/C][C]0.496104[/C][/ROW]
[ROW][C]54[/C][C]0.027795[/C][C]0.2455[/C][C]0.403364[/C][/ROW]
[ROW][C]55[/C][C]-0.032344[/C][C]-0.2857[/C][C]0.387948[/C][/ROW]
[ROW][C]56[/C][C]-0.046664[/C][C]-0.4121[/C][C]0.340689[/C][/ROW]
[ROW][C]57[/C][C]-6.1e-05[/C][C]-5e-04[/C][C]0.499785[/C][/ROW]
[ROW][C]58[/C][C]0.048221[/C][C]0.4259[/C][C]0.335687[/C][/ROW]
[ROW][C]59[/C][C]-0.010424[/C][C]-0.0921[/C][C]0.463441[/C][/ROW]
[ROW][C]60[/C][C]-0.060507[/C][C]-0.5344[/C][C]0.297299[/C][/ROW]
[/TABLE]
Source: https://freestatistics.org/blog/index.php?pk=120491&T=2

Globally Unique Identifier (entire table): ba.freestatistics.org/blog/index.php?pk=120491&T=2

As an alternative you can also use a QR Code:  

The GUIDs for individual cells are displayed in the table below:

Partial Autocorrelation Function
Time lag kPACF(k)T-STATP-value
10.4323773.81860.000134
20.2943242.59940.005582
30.0889940.7860.217131
4-0.272313-2.4050.009271
50.1786461.57780.059334
60.1778781.5710.060118
7-0.05494-0.48520.31444
80.0121740.10750.457326
9-0.017859-0.15770.437539
10-0.20002-1.76650.040609
11-0.005693-0.05030.480015
12-0.166951-1.47450.07219
130.1607161.41940.079882
140.2659292.34860.010688
150.1734311.53170.064821
16-0.072782-0.64280.261122
17-0.115717-1.0220.154974
180.1556811.37490.086544
190.0384780.33980.367448
20-0.208458-1.84110.034708
210.053690.47420.31835
22-0.118237-1.04420.1498
23-0.021123-0.18660.426247
24-0.176945-1.56270.061082
25-0.005128-0.04530.481996
260.0684840.60480.273523
27-0.105394-0.93080.177411
28-0.018419-0.16270.435598
290.0055540.04910.480502
30-0.005088-0.04490.482137
31-0.093151-0.82270.206596
32-0.064703-0.57140.284672
330.0150230.13270.447396
34-0.162228-1.43280.077961
350.0127830.11290.4552
36-0.1806-1.5950.057376
370.0760720.67190.251831
380.0163120.14410.442912
39-0.028342-0.25030.401501
40-0.000684-0.0060.497599
410.1392991.23030.11115
42-0.010985-0.0970.461481
430.054990.48570.314286
440.0402390.35540.361631
450.0368640.32560.372809
46-0.043475-0.3840.351025
470.0507960.44860.327476
48-0.029082-0.25680.398986
490.0099260.08770.465184
50-0.069177-0.6110.271503
51-0.041686-0.36820.356877
52-0.026992-0.23840.406102
53-0.001109-0.00980.496104
540.0277950.24550.403364
55-0.032344-0.28570.387948
56-0.046664-0.41210.340689
57-6.1e-05-5e-040.499785
580.0482210.42590.335687
59-0.010424-0.09210.463441
60-0.060507-0.53440.297299


Parameters (Session):
par1 = 60 ; par2 = 1 ; par3 = 0 ; par4 = 1 ; par5 = 12 ; par6 = White Noise ; par7 = 0.95 ;
Parameters (R input):
par1 = 60 ; par2 = 1 ; par3 = 0 ; par4 = 1 ; par5 = 12 ; par6 = White Noise ; par7 = 0.95 ; par8 = ;
R code (references can be found in the software module):
if (par1 == 'Default') {
par1 = 10*log10(length(x))
} else {
par1 <- as.numeric(par1)
}
par2 <- as.numeric(par2)
par3 <- as.numeric(par3)
par4 <- as.numeric(par4)
par5 <- as.numeric(par5)
if (par6 == 'White Noise') par6 <- 'white' else par6 <- 'ma'
par7 <- as.numeric(par7)
if (par8 != '') par8 <- as.numeric(par8)
ox <- x
if (par8 == '') {
if (par2 == 0) {
x <- log(x)
} else {
x <- (x ^ par2 - 1) / par2
}
} else {
x <- log(x,base=par8)
}
if (par3 > 0) x <- diff(x,lag=1,difference=par3)
if (par4 > 0) x <- diff(x,lag=par5,difference=par4)
bitmap(file='picts.png')
op <- par(mfrow=c(2,1))
plot(ox,type='l',main='Original Time Series',xlab='time',ylab='value')
if (par8=='') {
mytitle <- paste('Working Time Series (lambda=',par2,', d=',par3,', D=',par4,')',sep='')
mysub <- paste('(lambda=',par2,', d=',par3,', D=',par4,', CI=', par7, ', CI type=',par6,')',sep='')
} else {
mytitle <- paste('Working Time Series (base=',par8,', d=',par3,', D=',par4,')',sep='')
mysub <- paste('(base=',par8,', d=',par3,', D=',par4,', CI=', par7, ', CI type=',par6,')',sep='')
}
plot(x,type='l', main=mytitle,xlab='time',ylab='value')
par(op)
dev.off()
bitmap(file='pic1.png')
racf <- acf(x, par1, main='Autocorrelation', xlab='time lag', ylab='ACF', ci.type=par6, ci=par7, sub=mysub)
dev.off()
bitmap(file='pic2.png')
rpacf <- pacf(x,par1,main='Partial Autocorrelation',xlab='lags',ylab='PACF',sub=mysub)
dev.off()
(myacf <- c(racf$acf))
(mypacf <- c(rpacf$acf))
lengthx <- length(x)
sqrtn <- sqrt(lengthx)
load(file='createtable')
a<-table.start()
a<-table.row.start(a)
a<-table.element(a,'Autocorrelation Function',4,TRUE)
a<-table.row.end(a)
a<-table.row.start(a)
a<-table.element(a,'Time lag k',header=TRUE)
a<-table.element(a,hyperlink('basics.htm','ACF(k)','click here for more information about the Autocorrelation Function'),header=TRUE)
a<-table.element(a,'T-STAT',header=TRUE)
a<-table.element(a,'P-value',header=TRUE)
a<-table.row.end(a)
for (i in 2:(par1+1)) {
a<-table.row.start(a)
a<-table.element(a,i-1,header=TRUE)
a<-table.element(a,round(myacf[i],6))
mytstat <- myacf[i]*sqrtn
a<-table.element(a,round(mytstat,4))
a<-table.element(a,round(1-pt(abs(mytstat),lengthx),6))
a<-table.row.end(a)
}
a<-table.end(a)
table.save(a,file='mytable.tab')
a<-table.start()
a<-table.row.start(a)
a<-table.element(a,'Partial Autocorrelation Function',4,TRUE)
a<-table.row.end(a)
a<-table.row.start(a)
a<-table.element(a,'Time lag k',header=TRUE)
a<-table.element(a,hyperlink('basics.htm','PACF(k)','click here for more information about the Partial Autocorrelation Function'),header=TRUE)
a<-table.element(a,'T-STAT',header=TRUE)
a<-table.element(a,'P-value',header=TRUE)
a<-table.row.end(a)
for (i in 1:par1) {
a<-table.row.start(a)
a<-table.element(a,i,header=TRUE)
a<-table.element(a,round(mypacf[i],6))
mytstat <- mypacf[i]*sqrtn
a<-table.element(a,round(mytstat,4))
a<-table.element(a,round(1-pt(abs(mytstat),lengthx),6))
a<-table.row.end(a)
}
a<-table.end(a)
table.save(a,file='mytable1.tab')