Free Statistics

of Irreproducible Research!

Author's title

Author*Unverified author*
R Software Modulerwasp_autocorrelation.wasp
Title produced by software(Partial) Autocorrelation Function
Date of computationMon, 11 Apr 2011 19:03:11 +0000
Cite this page as followsStatistical Computations at FreeStatistics.org, Office for Research Development and Education, URL https://freestatistics.org/blog/index.php?v=date/2011/Apr/11/t1302548495hc24lvzz0u92bla.htm/, Retrieved Thu, 09 May 2024 13:46:47 +0000
Statistical Computations at FreeStatistics.org, Office for Research Development and Education, URL https://freestatistics.org/blog/index.php?pk=120489, Retrieved Thu, 09 May 2024 13:46:47 +0000
QR Codes:

Original text written by user:
IsPrivate?No (this computation is public)
User-defined keywordsKDGP2W12
Estimated Impact144
Family? (F = Feedback message, R = changed R code, M = changed R Module, P = changed Parameters, D = changed Data)
-       [(Partial) Autocorrelation Function] [autocorrelatie-In...] [2011-04-11 19:03:11] [ebb64913e7d7e5b0e5266ebfea2a3acd] [Current]
Feedback Forum

Post a new message
Dataseries X:
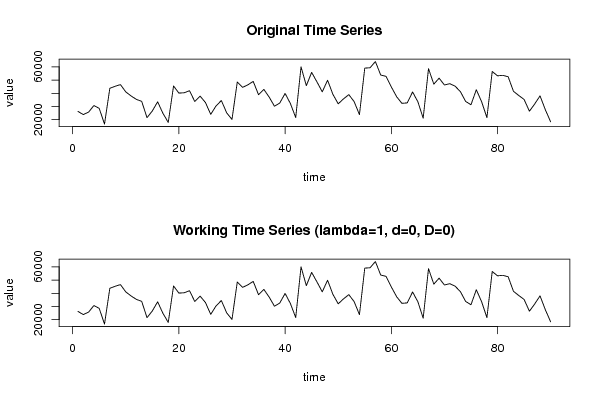
26281
23899
25727
30733
28599
16723
43738
45272
46532
41032
37967
35366
33892
21560
26588
33527
24859
17952
45504
40129
40357
41913
33730
37842
33025
24050
30429
34507
25189
20253
48527
44446
46380
48950
38883
42928
37107
30186
32602
39892
32194
21629
59968
45694
55756
48554
41052
49822
39191
31994
35735
38930
33658
23849
58972
59249
63955
53785
52760
44795
37348
32370
32717
40974
33591
21124
58608
46865
51378
46235
47206
45382
41227
33795
31295
42625
33625
21538
56421
53152
53536
52408
41454
38271
35306
26414
31917
38030
27534
18387


Summary of computational transaction
Raw Inputview raw input (R code)
Raw Outputview raw output of R engine
Computing time1 seconds
R Server'Gwilym Jenkins' @ www.wessa.org

\begin{tabular}{lllllllll}
\hline
Summary of computational transaction \tabularnewline
Raw Input & view raw input (R code)  \tabularnewline
Raw Output & view raw output of R engine  \tabularnewline
Computing time & 1 seconds \tabularnewline
R Server & 'Gwilym Jenkins' @ www.wessa.org \tabularnewline
\hline
\end{tabular}
%Source: https://freestatistics.org/blog/index.php?pk=120489&T=0

[TABLE]
[ROW][C]Summary of computational transaction[/C][/ROW]
[ROW][C]Raw Input[/C][C]view raw input (R code) [/C][/ROW]
[ROW][C]Raw Output[/C][C]view raw output of R engine [/C][/ROW]
[ROW][C]Computing time[/C][C]1 seconds[/C][/ROW]
[ROW][C]R Server[/C][C]'Gwilym Jenkins' @ www.wessa.org[/C][/ROW]
[/TABLE]
Source: https://freestatistics.org/blog/index.php?pk=120489&T=0

Globally Unique Identifier (entire table): ba.freestatistics.org/blog/index.php?pk=120489&T=0

As an alternative you can also use a QR Code:  

The GUIDs for individual cells are displayed in the table below:

Summary of computational transaction
Raw Inputview raw input (R code)
Raw Outputview raw output of R engine
Computing time1 seconds
R Server'Gwilym Jenkins' @ www.wessa.org


Autocorrelation Function
Time lag kACF(k)T-STATP-value
10.4375314.15083.8e-05
20.2365842.24440.013628
30.1817951.72470.044011
4-0.025761-0.24440.403744
5-0.205032-1.94510.027442
6-0.305198-2.89540.002376
7-0.235993-2.23880.013816
8-0.061794-0.58620.279593
90.1047230.99350.161567
100.1239461.17590.121377
110.3098282.93930.00209
120.766287.26960
130.307572.91790.002225
140.1548751.46930.072623
150.1067381.01260.156981
16-0.048502-0.46010.323265
17-0.224695-2.13160.01788
18-0.320523-3.04070.001545
19-0.240432-2.28090.012456
20-0.113483-1.07660.14227
210.0413790.39260.347789
220.0716230.67950.24929
230.2297872.17990.015936
240.6163095.84680
250.2286292.1690.016361
260.0696910.66110.255103
270.002650.02510.490001
28-0.113305-1.07490.142646
29-0.280469-2.66080.004616
30-0.36001-3.41540.000479
31-0.279873-2.65510.004688
32-0.192797-1.8290.035353
33-0.067771-0.64290.26095
34-0.040429-0.38350.351112
350.0810930.76930.221861
360.4062043.85360.000109
370.1118181.06080.14581
38-0.021741-0.20630.418528
39-0.051809-0.49150.312135
40-0.124133-1.17760.121025
41-0.280517-2.66120.00461
42-0.329593-3.12680.00119
43-0.253535-2.40520.009104
44-0.189967-1.80220.037432
45-0.070628-0.670.252274
46-0.049464-0.46930.320011
470.0436140.41380.340017
480.301342.85880.002642
490.0812350.77070.221464
50-0.040511-0.38430.350824
51-0.053813-0.51050.305472
52-0.111839-1.0610.145766
53-0.240555-2.28210.01242
54-0.254818-2.41740.008824
55-0.212286-2.01390.023502
56-0.154769-1.46830.072759
57-0.057008-0.54080.294982
58-0.047845-0.45390.325498
590.0347210.32940.371312
600.2163742.05270.021503

\begin{tabular}{lllllllll}
\hline
Autocorrelation Function \tabularnewline
Time lag k & ACF(k) & T-STAT & P-value \tabularnewline
1 & 0.437531 & 4.1508 & 3.8e-05 \tabularnewline
2 & 0.236584 & 2.2444 & 0.013628 \tabularnewline
3 & 0.181795 & 1.7247 & 0.044011 \tabularnewline
4 & -0.025761 & -0.2444 & 0.403744 \tabularnewline
5 & -0.205032 & -1.9451 & 0.027442 \tabularnewline
6 & -0.305198 & -2.8954 & 0.002376 \tabularnewline
7 & -0.235993 & -2.2388 & 0.013816 \tabularnewline
8 & -0.061794 & -0.5862 & 0.279593 \tabularnewline
9 & 0.104723 & 0.9935 & 0.161567 \tabularnewline
10 & 0.123946 & 1.1759 & 0.121377 \tabularnewline
11 & 0.309828 & 2.9393 & 0.00209 \tabularnewline
12 & 0.76628 & 7.2696 & 0 \tabularnewline
13 & 0.30757 & 2.9179 & 0.002225 \tabularnewline
14 & 0.154875 & 1.4693 & 0.072623 \tabularnewline
15 & 0.106738 & 1.0126 & 0.156981 \tabularnewline
16 & -0.048502 & -0.4601 & 0.323265 \tabularnewline
17 & -0.224695 & -2.1316 & 0.01788 \tabularnewline
18 & -0.320523 & -3.0407 & 0.001545 \tabularnewline
19 & -0.240432 & -2.2809 & 0.012456 \tabularnewline
20 & -0.113483 & -1.0766 & 0.14227 \tabularnewline
21 & 0.041379 & 0.3926 & 0.347789 \tabularnewline
22 & 0.071623 & 0.6795 & 0.24929 \tabularnewline
23 & 0.229787 & 2.1799 & 0.015936 \tabularnewline
24 & 0.616309 & 5.8468 & 0 \tabularnewline
25 & 0.228629 & 2.169 & 0.016361 \tabularnewline
26 & 0.069691 & 0.6611 & 0.255103 \tabularnewline
27 & 0.00265 & 0.0251 & 0.490001 \tabularnewline
28 & -0.113305 & -1.0749 & 0.142646 \tabularnewline
29 & -0.280469 & -2.6608 & 0.004616 \tabularnewline
30 & -0.36001 & -3.4154 & 0.000479 \tabularnewline
31 & -0.279873 & -2.6551 & 0.004688 \tabularnewline
32 & -0.192797 & -1.829 & 0.035353 \tabularnewline
33 & -0.067771 & -0.6429 & 0.26095 \tabularnewline
34 & -0.040429 & -0.3835 & 0.351112 \tabularnewline
35 & 0.081093 & 0.7693 & 0.221861 \tabularnewline
36 & 0.406204 & 3.8536 & 0.000109 \tabularnewline
37 & 0.111818 & 1.0608 & 0.14581 \tabularnewline
38 & -0.021741 & -0.2063 & 0.418528 \tabularnewline
39 & -0.051809 & -0.4915 & 0.312135 \tabularnewline
40 & -0.124133 & -1.1776 & 0.121025 \tabularnewline
41 & -0.280517 & -2.6612 & 0.00461 \tabularnewline
42 & -0.329593 & -3.1268 & 0.00119 \tabularnewline
43 & -0.253535 & -2.4052 & 0.009104 \tabularnewline
44 & -0.189967 & -1.8022 & 0.037432 \tabularnewline
45 & -0.070628 & -0.67 & 0.252274 \tabularnewline
46 & -0.049464 & -0.4693 & 0.320011 \tabularnewline
47 & 0.043614 & 0.4138 & 0.340017 \tabularnewline
48 & 0.30134 & 2.8588 & 0.002642 \tabularnewline
49 & 0.081235 & 0.7707 & 0.221464 \tabularnewline
50 & -0.040511 & -0.3843 & 0.350824 \tabularnewline
51 & -0.053813 & -0.5105 & 0.305472 \tabularnewline
52 & -0.111839 & -1.061 & 0.145766 \tabularnewline
53 & -0.240555 & -2.2821 & 0.01242 \tabularnewline
54 & -0.254818 & -2.4174 & 0.008824 \tabularnewline
55 & -0.212286 & -2.0139 & 0.023502 \tabularnewline
56 & -0.154769 & -1.4683 & 0.072759 \tabularnewline
57 & -0.057008 & -0.5408 & 0.294982 \tabularnewline
58 & -0.047845 & -0.4539 & 0.325498 \tabularnewline
59 & 0.034721 & 0.3294 & 0.371312 \tabularnewline
60 & 0.216374 & 2.0527 & 0.021503 \tabularnewline
\hline
\end{tabular}
%Source: https://freestatistics.org/blog/index.php?pk=120489&T=1

[TABLE]
[ROW][C]Autocorrelation Function[/C][/ROW]
[ROW][C]Time lag k[/C][C]ACF(k)[/C][C]T-STAT[/C][C]P-value[/C][/ROW]
[ROW][C]1[/C][C]0.437531[/C][C]4.1508[/C][C]3.8e-05[/C][/ROW]
[ROW][C]2[/C][C]0.236584[/C][C]2.2444[/C][C]0.013628[/C][/ROW]
[ROW][C]3[/C][C]0.181795[/C][C]1.7247[/C][C]0.044011[/C][/ROW]
[ROW][C]4[/C][C]-0.025761[/C][C]-0.2444[/C][C]0.403744[/C][/ROW]
[ROW][C]5[/C][C]-0.205032[/C][C]-1.9451[/C][C]0.027442[/C][/ROW]
[ROW][C]6[/C][C]-0.305198[/C][C]-2.8954[/C][C]0.002376[/C][/ROW]
[ROW][C]7[/C][C]-0.235993[/C][C]-2.2388[/C][C]0.013816[/C][/ROW]
[ROW][C]8[/C][C]-0.061794[/C][C]-0.5862[/C][C]0.279593[/C][/ROW]
[ROW][C]9[/C][C]0.104723[/C][C]0.9935[/C][C]0.161567[/C][/ROW]
[ROW][C]10[/C][C]0.123946[/C][C]1.1759[/C][C]0.121377[/C][/ROW]
[ROW][C]11[/C][C]0.309828[/C][C]2.9393[/C][C]0.00209[/C][/ROW]
[ROW][C]12[/C][C]0.76628[/C][C]7.2696[/C][C]0[/C][/ROW]
[ROW][C]13[/C][C]0.30757[/C][C]2.9179[/C][C]0.002225[/C][/ROW]
[ROW][C]14[/C][C]0.154875[/C][C]1.4693[/C][C]0.072623[/C][/ROW]
[ROW][C]15[/C][C]0.106738[/C][C]1.0126[/C][C]0.156981[/C][/ROW]
[ROW][C]16[/C][C]-0.048502[/C][C]-0.4601[/C][C]0.323265[/C][/ROW]
[ROW][C]17[/C][C]-0.224695[/C][C]-2.1316[/C][C]0.01788[/C][/ROW]
[ROW][C]18[/C][C]-0.320523[/C][C]-3.0407[/C][C]0.001545[/C][/ROW]
[ROW][C]19[/C][C]-0.240432[/C][C]-2.2809[/C][C]0.012456[/C][/ROW]
[ROW][C]20[/C][C]-0.113483[/C][C]-1.0766[/C][C]0.14227[/C][/ROW]
[ROW][C]21[/C][C]0.041379[/C][C]0.3926[/C][C]0.347789[/C][/ROW]
[ROW][C]22[/C][C]0.071623[/C][C]0.6795[/C][C]0.24929[/C][/ROW]
[ROW][C]23[/C][C]0.229787[/C][C]2.1799[/C][C]0.015936[/C][/ROW]
[ROW][C]24[/C][C]0.616309[/C][C]5.8468[/C][C]0[/C][/ROW]
[ROW][C]25[/C][C]0.228629[/C][C]2.169[/C][C]0.016361[/C][/ROW]
[ROW][C]26[/C][C]0.069691[/C][C]0.6611[/C][C]0.255103[/C][/ROW]
[ROW][C]27[/C][C]0.00265[/C][C]0.0251[/C][C]0.490001[/C][/ROW]
[ROW][C]28[/C][C]-0.113305[/C][C]-1.0749[/C][C]0.142646[/C][/ROW]
[ROW][C]29[/C][C]-0.280469[/C][C]-2.6608[/C][C]0.004616[/C][/ROW]
[ROW][C]30[/C][C]-0.36001[/C][C]-3.4154[/C][C]0.000479[/C][/ROW]
[ROW][C]31[/C][C]-0.279873[/C][C]-2.6551[/C][C]0.004688[/C][/ROW]
[ROW][C]32[/C][C]-0.192797[/C][C]-1.829[/C][C]0.035353[/C][/ROW]
[ROW][C]33[/C][C]-0.067771[/C][C]-0.6429[/C][C]0.26095[/C][/ROW]
[ROW][C]34[/C][C]-0.040429[/C][C]-0.3835[/C][C]0.351112[/C][/ROW]
[ROW][C]35[/C][C]0.081093[/C][C]0.7693[/C][C]0.221861[/C][/ROW]
[ROW][C]36[/C][C]0.406204[/C][C]3.8536[/C][C]0.000109[/C][/ROW]
[ROW][C]37[/C][C]0.111818[/C][C]1.0608[/C][C]0.14581[/C][/ROW]
[ROW][C]38[/C][C]-0.021741[/C][C]-0.2063[/C][C]0.418528[/C][/ROW]
[ROW][C]39[/C][C]-0.051809[/C][C]-0.4915[/C][C]0.312135[/C][/ROW]
[ROW][C]40[/C][C]-0.124133[/C][C]-1.1776[/C][C]0.121025[/C][/ROW]
[ROW][C]41[/C][C]-0.280517[/C][C]-2.6612[/C][C]0.00461[/C][/ROW]
[ROW][C]42[/C][C]-0.329593[/C][C]-3.1268[/C][C]0.00119[/C][/ROW]
[ROW][C]43[/C][C]-0.253535[/C][C]-2.4052[/C][C]0.009104[/C][/ROW]
[ROW][C]44[/C][C]-0.189967[/C][C]-1.8022[/C][C]0.037432[/C][/ROW]
[ROW][C]45[/C][C]-0.070628[/C][C]-0.67[/C][C]0.252274[/C][/ROW]
[ROW][C]46[/C][C]-0.049464[/C][C]-0.4693[/C][C]0.320011[/C][/ROW]
[ROW][C]47[/C][C]0.043614[/C][C]0.4138[/C][C]0.340017[/C][/ROW]
[ROW][C]48[/C][C]0.30134[/C][C]2.8588[/C][C]0.002642[/C][/ROW]
[ROW][C]49[/C][C]0.081235[/C][C]0.7707[/C][C]0.221464[/C][/ROW]
[ROW][C]50[/C][C]-0.040511[/C][C]-0.3843[/C][C]0.350824[/C][/ROW]
[ROW][C]51[/C][C]-0.053813[/C][C]-0.5105[/C][C]0.305472[/C][/ROW]
[ROW][C]52[/C][C]-0.111839[/C][C]-1.061[/C][C]0.145766[/C][/ROW]
[ROW][C]53[/C][C]-0.240555[/C][C]-2.2821[/C][C]0.01242[/C][/ROW]
[ROW][C]54[/C][C]-0.254818[/C][C]-2.4174[/C][C]0.008824[/C][/ROW]
[ROW][C]55[/C][C]-0.212286[/C][C]-2.0139[/C][C]0.023502[/C][/ROW]
[ROW][C]56[/C][C]-0.154769[/C][C]-1.4683[/C][C]0.072759[/C][/ROW]
[ROW][C]57[/C][C]-0.057008[/C][C]-0.5408[/C][C]0.294982[/C][/ROW]
[ROW][C]58[/C][C]-0.047845[/C][C]-0.4539[/C][C]0.325498[/C][/ROW]
[ROW][C]59[/C][C]0.034721[/C][C]0.3294[/C][C]0.371312[/C][/ROW]
[ROW][C]60[/C][C]0.216374[/C][C]2.0527[/C][C]0.021503[/C][/ROW]
[/TABLE]
Source: https://freestatistics.org/blog/index.php?pk=120489&T=1

Globally Unique Identifier (entire table): ba.freestatistics.org/blog/index.php?pk=120489&T=1

As an alternative you can also use a QR Code:  

The GUIDs for individual cells are displayed in the table below:

Autocorrelation Function
Time lag kACF(k)T-STATP-value
10.4375314.15083.8e-05
20.2365842.24440.013628
30.1817951.72470.044011
4-0.025761-0.24440.403744
5-0.205032-1.94510.027442
6-0.305198-2.89540.002376
7-0.235993-2.23880.013816
8-0.061794-0.58620.279593
90.1047230.99350.161567
100.1239461.17590.121377
110.3098282.93930.00209
120.766287.26960
130.307572.91790.002225
140.1548751.46930.072623
150.1067381.01260.156981
16-0.048502-0.46010.323265
17-0.224695-2.13160.01788
18-0.320523-3.04070.001545
19-0.240432-2.28090.012456
20-0.113483-1.07660.14227
210.0413790.39260.347789
220.0716230.67950.24929
230.2297872.17990.015936
240.6163095.84680
250.2286292.1690.016361
260.0696910.66110.255103
270.002650.02510.490001
28-0.113305-1.07490.142646
29-0.280469-2.66080.004616
30-0.36001-3.41540.000479
31-0.279873-2.65510.004688
32-0.192797-1.8290.035353
33-0.067771-0.64290.26095
34-0.040429-0.38350.351112
350.0810930.76930.221861
360.4062043.85360.000109
370.1118181.06080.14581
38-0.021741-0.20630.418528
39-0.051809-0.49150.312135
40-0.124133-1.17760.121025
41-0.280517-2.66120.00461
42-0.329593-3.12680.00119
43-0.253535-2.40520.009104
44-0.189967-1.80220.037432
45-0.070628-0.670.252274
46-0.049464-0.46930.320011
470.0436140.41380.340017
480.301342.85880.002642
490.0812350.77070.221464
50-0.040511-0.38430.350824
51-0.053813-0.51050.305472
52-0.111839-1.0610.145766
53-0.240555-2.28210.01242
54-0.254818-2.41740.008824
55-0.212286-2.01390.023502
56-0.154769-1.46830.072759
57-0.057008-0.54080.294982
58-0.047845-0.45390.325498
590.0347210.32940.371312
600.2163742.05270.021503


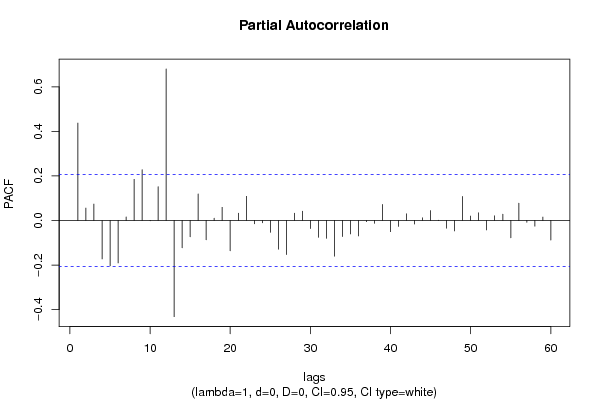
Partial Autocorrelation Function
Time lag kPACF(k)T-STATP-value
10.4375314.15083.8e-05
20.055840.52970.298796
30.0739780.70180.242301
4-0.172719-1.63860.052399
5-0.203416-1.92980.028392
6-0.190773-1.80980.03683
70.0158510.15040.440403
80.1848871.7540.041418
90.2282172.16510.016514
10-0.00119-0.01130.49551
110.1518691.44080.076562
120.6807026.45770
13-0.431847-4.09694.6e-05
14-0.122825-1.16520.123505
15-0.07326-0.6950.244422
160.1194661.13340.130038
17-0.086512-0.82070.206985
180.0104380.0990.460672
190.0594750.56420.287001
20-0.135894-1.28920.100315
210.0329570.31270.377633
220.1088461.03260.152278
23-0.014905-0.14140.443936
24-0.010256-0.09730.461352
25-0.052983-0.50260.308221
26-0.128991-1.22370.112126
27-0.153053-1.4520.07499
280.0331250.31420.37703
290.0416550.39520.346825
30-0.036429-0.34560.365226
31-0.07539-0.71520.238166
32-0.080129-0.76020.22457
33-0.160526-1.52290.065647
34-0.072045-0.68350.248031
35-0.060423-0.57320.28396
36-0.06912-0.65570.256835
37-0.005167-0.0490.480506
38-0.012573-0.11930.452659
390.0722310.68520.247477
40-0.050051-0.47480.318031
41-0.026636-0.25270.400541
420.0300680.28530.388053
43-0.016154-0.15330.439271
440.0120290.11410.454701
450.0446670.42370.336382
460.0013640.01290.494852
47-0.034668-0.32890.371503
48-0.046839-0.44440.328928
490.1078741.02340.154435
500.0200420.19010.424816
510.0346890.32910.371425
52-0.042542-0.40360.343736
530.0208570.19790.421799
540.0285830.27120.393444
55-0.077811-0.73820.231162
560.0778630.73870.231013
57-0.008368-0.07940.468449
58-0.025647-0.24330.404159
590.0153460.14560.442288
60-0.087876-0.83370.203339

\begin{tabular}{lllllllll}
\hline
Partial Autocorrelation Function \tabularnewline
Time lag k & PACF(k) & T-STAT & P-value \tabularnewline
1 & 0.437531 & 4.1508 & 3.8e-05 \tabularnewline
2 & 0.05584 & 0.5297 & 0.298796 \tabularnewline
3 & 0.073978 & 0.7018 & 0.242301 \tabularnewline
4 & -0.172719 & -1.6386 & 0.052399 \tabularnewline
5 & -0.203416 & -1.9298 & 0.028392 \tabularnewline
6 & -0.190773 & -1.8098 & 0.03683 \tabularnewline
7 & 0.015851 & 0.1504 & 0.440403 \tabularnewline
8 & 0.184887 & 1.754 & 0.041418 \tabularnewline
9 & 0.228217 & 2.1651 & 0.016514 \tabularnewline
10 & -0.00119 & -0.0113 & 0.49551 \tabularnewline
11 & 0.151869 & 1.4408 & 0.076562 \tabularnewline
12 & 0.680702 & 6.4577 & 0 \tabularnewline
13 & -0.431847 & -4.0969 & 4.6e-05 \tabularnewline
14 & -0.122825 & -1.1652 & 0.123505 \tabularnewline
15 & -0.07326 & -0.695 & 0.244422 \tabularnewline
16 & 0.119466 & 1.1334 & 0.130038 \tabularnewline
17 & -0.086512 & -0.8207 & 0.206985 \tabularnewline
18 & 0.010438 & 0.099 & 0.460672 \tabularnewline
19 & 0.059475 & 0.5642 & 0.287001 \tabularnewline
20 & -0.135894 & -1.2892 & 0.100315 \tabularnewline
21 & 0.032957 & 0.3127 & 0.377633 \tabularnewline
22 & 0.108846 & 1.0326 & 0.152278 \tabularnewline
23 & -0.014905 & -0.1414 & 0.443936 \tabularnewline
24 & -0.010256 & -0.0973 & 0.461352 \tabularnewline
25 & -0.052983 & -0.5026 & 0.308221 \tabularnewline
26 & -0.128991 & -1.2237 & 0.112126 \tabularnewline
27 & -0.153053 & -1.452 & 0.07499 \tabularnewline
28 & 0.033125 & 0.3142 & 0.37703 \tabularnewline
29 & 0.041655 & 0.3952 & 0.346825 \tabularnewline
30 & -0.036429 & -0.3456 & 0.365226 \tabularnewline
31 & -0.07539 & -0.7152 & 0.238166 \tabularnewline
32 & -0.080129 & -0.7602 & 0.22457 \tabularnewline
33 & -0.160526 & -1.5229 & 0.065647 \tabularnewline
34 & -0.072045 & -0.6835 & 0.248031 \tabularnewline
35 & -0.060423 & -0.5732 & 0.28396 \tabularnewline
36 & -0.06912 & -0.6557 & 0.256835 \tabularnewline
37 & -0.005167 & -0.049 & 0.480506 \tabularnewline
38 & -0.012573 & -0.1193 & 0.452659 \tabularnewline
39 & 0.072231 & 0.6852 & 0.247477 \tabularnewline
40 & -0.050051 & -0.4748 & 0.318031 \tabularnewline
41 & -0.026636 & -0.2527 & 0.400541 \tabularnewline
42 & 0.030068 & 0.2853 & 0.388053 \tabularnewline
43 & -0.016154 & -0.1533 & 0.439271 \tabularnewline
44 & 0.012029 & 0.1141 & 0.454701 \tabularnewline
45 & 0.044667 & 0.4237 & 0.336382 \tabularnewline
46 & 0.001364 & 0.0129 & 0.494852 \tabularnewline
47 & -0.034668 & -0.3289 & 0.371503 \tabularnewline
48 & -0.046839 & -0.4444 & 0.328928 \tabularnewline
49 & 0.107874 & 1.0234 & 0.154435 \tabularnewline
50 & 0.020042 & 0.1901 & 0.424816 \tabularnewline
51 & 0.034689 & 0.3291 & 0.371425 \tabularnewline
52 & -0.042542 & -0.4036 & 0.343736 \tabularnewline
53 & 0.020857 & 0.1979 & 0.421799 \tabularnewline
54 & 0.028583 & 0.2712 & 0.393444 \tabularnewline
55 & -0.077811 & -0.7382 & 0.231162 \tabularnewline
56 & 0.077863 & 0.7387 & 0.231013 \tabularnewline
57 & -0.008368 & -0.0794 & 0.468449 \tabularnewline
58 & -0.025647 & -0.2433 & 0.404159 \tabularnewline
59 & 0.015346 & 0.1456 & 0.442288 \tabularnewline
60 & -0.087876 & -0.8337 & 0.203339 \tabularnewline
\hline
\end{tabular}
%Source: https://freestatistics.org/blog/index.php?pk=120489&T=2

[TABLE]
[ROW][C]Partial Autocorrelation Function[/C][/ROW]
[ROW][C]Time lag k[/C][C]PACF(k)[/C][C]T-STAT[/C][C]P-value[/C][/ROW]
[ROW][C]1[/C][C]0.437531[/C][C]4.1508[/C][C]3.8e-05[/C][/ROW]
[ROW][C]2[/C][C]0.05584[/C][C]0.5297[/C][C]0.298796[/C][/ROW]
[ROW][C]3[/C][C]0.073978[/C][C]0.7018[/C][C]0.242301[/C][/ROW]
[ROW][C]4[/C][C]-0.172719[/C][C]-1.6386[/C][C]0.052399[/C][/ROW]
[ROW][C]5[/C][C]-0.203416[/C][C]-1.9298[/C][C]0.028392[/C][/ROW]
[ROW][C]6[/C][C]-0.190773[/C][C]-1.8098[/C][C]0.03683[/C][/ROW]
[ROW][C]7[/C][C]0.015851[/C][C]0.1504[/C][C]0.440403[/C][/ROW]
[ROW][C]8[/C][C]0.184887[/C][C]1.754[/C][C]0.041418[/C][/ROW]
[ROW][C]9[/C][C]0.228217[/C][C]2.1651[/C][C]0.016514[/C][/ROW]
[ROW][C]10[/C][C]-0.00119[/C][C]-0.0113[/C][C]0.49551[/C][/ROW]
[ROW][C]11[/C][C]0.151869[/C][C]1.4408[/C][C]0.076562[/C][/ROW]
[ROW][C]12[/C][C]0.680702[/C][C]6.4577[/C][C]0[/C][/ROW]
[ROW][C]13[/C][C]-0.431847[/C][C]-4.0969[/C][C]4.6e-05[/C][/ROW]
[ROW][C]14[/C][C]-0.122825[/C][C]-1.1652[/C][C]0.123505[/C][/ROW]
[ROW][C]15[/C][C]-0.07326[/C][C]-0.695[/C][C]0.244422[/C][/ROW]
[ROW][C]16[/C][C]0.119466[/C][C]1.1334[/C][C]0.130038[/C][/ROW]
[ROW][C]17[/C][C]-0.086512[/C][C]-0.8207[/C][C]0.206985[/C][/ROW]
[ROW][C]18[/C][C]0.010438[/C][C]0.099[/C][C]0.460672[/C][/ROW]
[ROW][C]19[/C][C]0.059475[/C][C]0.5642[/C][C]0.287001[/C][/ROW]
[ROW][C]20[/C][C]-0.135894[/C][C]-1.2892[/C][C]0.100315[/C][/ROW]
[ROW][C]21[/C][C]0.032957[/C][C]0.3127[/C][C]0.377633[/C][/ROW]
[ROW][C]22[/C][C]0.108846[/C][C]1.0326[/C][C]0.152278[/C][/ROW]
[ROW][C]23[/C][C]-0.014905[/C][C]-0.1414[/C][C]0.443936[/C][/ROW]
[ROW][C]24[/C][C]-0.010256[/C][C]-0.0973[/C][C]0.461352[/C][/ROW]
[ROW][C]25[/C][C]-0.052983[/C][C]-0.5026[/C][C]0.308221[/C][/ROW]
[ROW][C]26[/C][C]-0.128991[/C][C]-1.2237[/C][C]0.112126[/C][/ROW]
[ROW][C]27[/C][C]-0.153053[/C][C]-1.452[/C][C]0.07499[/C][/ROW]
[ROW][C]28[/C][C]0.033125[/C][C]0.3142[/C][C]0.37703[/C][/ROW]
[ROW][C]29[/C][C]0.041655[/C][C]0.3952[/C][C]0.346825[/C][/ROW]
[ROW][C]30[/C][C]-0.036429[/C][C]-0.3456[/C][C]0.365226[/C][/ROW]
[ROW][C]31[/C][C]-0.07539[/C][C]-0.7152[/C][C]0.238166[/C][/ROW]
[ROW][C]32[/C][C]-0.080129[/C][C]-0.7602[/C][C]0.22457[/C][/ROW]
[ROW][C]33[/C][C]-0.160526[/C][C]-1.5229[/C][C]0.065647[/C][/ROW]
[ROW][C]34[/C][C]-0.072045[/C][C]-0.6835[/C][C]0.248031[/C][/ROW]
[ROW][C]35[/C][C]-0.060423[/C][C]-0.5732[/C][C]0.28396[/C][/ROW]
[ROW][C]36[/C][C]-0.06912[/C][C]-0.6557[/C][C]0.256835[/C][/ROW]
[ROW][C]37[/C][C]-0.005167[/C][C]-0.049[/C][C]0.480506[/C][/ROW]
[ROW][C]38[/C][C]-0.012573[/C][C]-0.1193[/C][C]0.452659[/C][/ROW]
[ROW][C]39[/C][C]0.072231[/C][C]0.6852[/C][C]0.247477[/C][/ROW]
[ROW][C]40[/C][C]-0.050051[/C][C]-0.4748[/C][C]0.318031[/C][/ROW]
[ROW][C]41[/C][C]-0.026636[/C][C]-0.2527[/C][C]0.400541[/C][/ROW]
[ROW][C]42[/C][C]0.030068[/C][C]0.2853[/C][C]0.388053[/C][/ROW]
[ROW][C]43[/C][C]-0.016154[/C][C]-0.1533[/C][C]0.439271[/C][/ROW]
[ROW][C]44[/C][C]0.012029[/C][C]0.1141[/C][C]0.454701[/C][/ROW]
[ROW][C]45[/C][C]0.044667[/C][C]0.4237[/C][C]0.336382[/C][/ROW]
[ROW][C]46[/C][C]0.001364[/C][C]0.0129[/C][C]0.494852[/C][/ROW]
[ROW][C]47[/C][C]-0.034668[/C][C]-0.3289[/C][C]0.371503[/C][/ROW]
[ROW][C]48[/C][C]-0.046839[/C][C]-0.4444[/C][C]0.328928[/C][/ROW]
[ROW][C]49[/C][C]0.107874[/C][C]1.0234[/C][C]0.154435[/C][/ROW]
[ROW][C]50[/C][C]0.020042[/C][C]0.1901[/C][C]0.424816[/C][/ROW]
[ROW][C]51[/C][C]0.034689[/C][C]0.3291[/C][C]0.371425[/C][/ROW]
[ROW][C]52[/C][C]-0.042542[/C][C]-0.4036[/C][C]0.343736[/C][/ROW]
[ROW][C]53[/C][C]0.020857[/C][C]0.1979[/C][C]0.421799[/C][/ROW]
[ROW][C]54[/C][C]0.028583[/C][C]0.2712[/C][C]0.393444[/C][/ROW]
[ROW][C]55[/C][C]-0.077811[/C][C]-0.7382[/C][C]0.231162[/C][/ROW]
[ROW][C]56[/C][C]0.077863[/C][C]0.7387[/C][C]0.231013[/C][/ROW]
[ROW][C]57[/C][C]-0.008368[/C][C]-0.0794[/C][C]0.468449[/C][/ROW]
[ROW][C]58[/C][C]-0.025647[/C][C]-0.2433[/C][C]0.404159[/C][/ROW]
[ROW][C]59[/C][C]0.015346[/C][C]0.1456[/C][C]0.442288[/C][/ROW]
[ROW][C]60[/C][C]-0.087876[/C][C]-0.8337[/C][C]0.203339[/C][/ROW]
[/TABLE]
Source: https://freestatistics.org/blog/index.php?pk=120489&T=2

Globally Unique Identifier (entire table): ba.freestatistics.org/blog/index.php?pk=120489&T=2

As an alternative you can also use a QR Code:  

The GUIDs for individual cells are displayed in the table below:

Partial Autocorrelation Function
Time lag kPACF(k)T-STATP-value
10.4375314.15083.8e-05
20.055840.52970.298796
30.0739780.70180.242301
4-0.172719-1.63860.052399
5-0.203416-1.92980.028392
6-0.190773-1.80980.03683
70.0158510.15040.440403
80.1848871.7540.041418
90.2282172.16510.016514
10-0.00119-0.01130.49551
110.1518691.44080.076562
120.6807026.45770
13-0.431847-4.09694.6e-05
14-0.122825-1.16520.123505
15-0.07326-0.6950.244422
160.1194661.13340.130038
17-0.086512-0.82070.206985
180.0104380.0990.460672
190.0594750.56420.287001
20-0.135894-1.28920.100315
210.0329570.31270.377633
220.1088461.03260.152278
23-0.014905-0.14140.443936
24-0.010256-0.09730.461352
25-0.052983-0.50260.308221
26-0.128991-1.22370.112126
27-0.153053-1.4520.07499
280.0331250.31420.37703
290.0416550.39520.346825
30-0.036429-0.34560.365226
31-0.07539-0.71520.238166
32-0.080129-0.76020.22457
33-0.160526-1.52290.065647
34-0.072045-0.68350.248031
35-0.060423-0.57320.28396
36-0.06912-0.65570.256835
37-0.005167-0.0490.480506
38-0.012573-0.11930.452659
390.0722310.68520.247477
40-0.050051-0.47480.318031
41-0.026636-0.25270.400541
420.0300680.28530.388053
43-0.016154-0.15330.439271
440.0120290.11410.454701
450.0446670.42370.336382
460.0013640.01290.494852
47-0.034668-0.32890.371503
48-0.046839-0.44440.328928
490.1078741.02340.154435
500.0200420.19010.424816
510.0346890.32910.371425
52-0.042542-0.40360.343736
530.0208570.19790.421799
540.0285830.27120.393444
55-0.077811-0.73820.231162
560.0778630.73870.231013
57-0.008368-0.07940.468449
58-0.025647-0.24330.404159
590.0153460.14560.442288
60-0.087876-0.83370.203339


Parameters (Session):
par1 = 60 ; par2 = 1 ; par3 = 0 ; par4 = 0 ; par5 = 12 ; par6 = White Noise ; par7 = 0.95 ;
Parameters (R input):
par1 = 60 ; par2 = 1 ; par3 = 0 ; par4 = 0 ; par5 = 12 ; par6 = White Noise ; par7 = 0.95 ; par8 = ;
R code (references can be found in the software module):
if (par1 == 'Default') {
par1 = 10*log10(length(x))
} else {
par1 <- as.numeric(par1)
}
par2 <- as.numeric(par2)
par3 <- as.numeric(par3)
par4 <- as.numeric(par4)
par5 <- as.numeric(par5)
if (par6 == 'White Noise') par6 <- 'white' else par6 <- 'ma'
par7 <- as.numeric(par7)
if (par8 != '') par8 <- as.numeric(par8)
ox <- x
if (par8 == '') {
if (par2 == 0) {
x <- log(x)
} else {
x <- (x ^ par2 - 1) / par2
}
} else {
x <- log(x,base=par8)
}
if (par3 > 0) x <- diff(x,lag=1,difference=par3)
if (par4 > 0) x <- diff(x,lag=par5,difference=par4)
bitmap(file='picts.png')
op <- par(mfrow=c(2,1))
plot(ox,type='l',main='Original Time Series',xlab='time',ylab='value')
if (par8=='') {
mytitle <- paste('Working Time Series (lambda=',par2,', d=',par3,', D=',par4,')',sep='')
mysub <- paste('(lambda=',par2,', d=',par3,', D=',par4,', CI=', par7, ', CI type=',par6,')',sep='')
} else {
mytitle <- paste('Working Time Series (base=',par8,', d=',par3,', D=',par4,')',sep='')
mysub <- paste('(base=',par8,', d=',par3,', D=',par4,', CI=', par7, ', CI type=',par6,')',sep='')
}
plot(x,type='l', main=mytitle,xlab='time',ylab='value')
par(op)
dev.off()
bitmap(file='pic1.png')
racf <- acf(x, par1, main='Autocorrelation', xlab='time lag', ylab='ACF', ci.type=par6, ci=par7, sub=mysub)
dev.off()
bitmap(file='pic2.png')
rpacf <- pacf(x,par1,main='Partial Autocorrelation',xlab='lags',ylab='PACF',sub=mysub)
dev.off()
(myacf <- c(racf$acf))
(mypacf <- c(rpacf$acf))
lengthx <- length(x)
sqrtn <- sqrt(lengthx)
load(file='createtable')
a<-table.start()
a<-table.row.start(a)
a<-table.element(a,'Autocorrelation Function',4,TRUE)
a<-table.row.end(a)
a<-table.row.start(a)
a<-table.element(a,'Time lag k',header=TRUE)
a<-table.element(a,hyperlink('basics.htm','ACF(k)','click here for more information about the Autocorrelation Function'),header=TRUE)
a<-table.element(a,'T-STAT',header=TRUE)
a<-table.element(a,'P-value',header=TRUE)
a<-table.row.end(a)
for (i in 2:(par1+1)) {
a<-table.row.start(a)
a<-table.element(a,i-1,header=TRUE)
a<-table.element(a,round(myacf[i],6))
mytstat <- myacf[i]*sqrtn
a<-table.element(a,round(mytstat,4))
a<-table.element(a,round(1-pt(abs(mytstat),lengthx),6))
a<-table.row.end(a)
}
a<-table.end(a)
table.save(a,file='mytable.tab')
a<-table.start()
a<-table.row.start(a)
a<-table.element(a,'Partial Autocorrelation Function',4,TRUE)
a<-table.row.end(a)
a<-table.row.start(a)
a<-table.element(a,'Time lag k',header=TRUE)
a<-table.element(a,hyperlink('basics.htm','PACF(k)','click here for more information about the Partial Autocorrelation Function'),header=TRUE)
a<-table.element(a,'T-STAT',header=TRUE)
a<-table.element(a,'P-value',header=TRUE)
a<-table.row.end(a)
for (i in 1:par1) {
a<-table.row.start(a)
a<-table.element(a,i,header=TRUE)
a<-table.element(a,round(mypacf[i],6))
mytstat <- mypacf[i]*sqrtn
a<-table.element(a,round(mytstat,4))
a<-table.element(a,round(1-pt(abs(mytstat),lengthx),6))
a<-table.row.end(a)
}
a<-table.end(a)
table.save(a,file='mytable1.tab')