Free Statistics

of Irreproducible Research!

Author's title

Author*Unverified author*
R Software Modulerwasp_autocorrelation.wasp
Title produced by software(Partial) Autocorrelation Function
Date of computationMon, 11 Apr 2011 13:44:28 +0000
Cite this page as followsStatistical Computations at FreeStatistics.org, Office for Research Development and Education, URL https://freestatistics.org/blog/index.php?v=date/2011/Apr/11/t13025292503987bnv76eiw9gq.htm/, Retrieved Thu, 09 May 2024 10:25:23 +0000
Statistical Computations at FreeStatistics.org, Office for Research Development and Education, URL https://freestatistics.org/blog/index.php?pk=120463, Retrieved Thu, 09 May 2024 10:25:23 +0000
QR Codes:

Original text written by user:
IsPrivate?No (this computation is public)
User-defined keywordsKDGP2W12
Estimated Impact152
Family? (F = Feedback message, R = changed R code, M = changed R Module, P = changed Parameters, D = changed Data)
-       [(Partial) Autocorrelation Function] [] [2011-04-11 13:44:28] [dc16c24fae4397a85c64c2b70586e631] [Current]
Feedback Forum

Post a new message
Dataseries X:
12544
12264
13783
11214
11453
10883
10381
10348
10024
10805
10796
11907
12261
11377
12689
11474
10992
10764
12164
10409
10398
10349
10865
11630
12221
10884
12019
11021
10799
10423
10484
10450
9906
11049
11281
12485
12849
11380
12079
11366
11328
10444
10854
10434
10137
10992
10906
12367
14371
11695
11546
10922
10670
10254
10573
10239
10253
11176
10719
11817
12503
11510
12012
10941
11252
10662
11114
10415
10626
11411
10936
12513


Summary of computational transaction
Raw Inputview raw input (R code)
Raw Outputview raw output of R engine
Computing time2 seconds
R Server'George Udny Yule' @ 216.218.223.82

\begin{tabular}{lllllllll}
\hline
Summary of computational transaction \tabularnewline
Raw Input & view raw input (R code)  \tabularnewline
Raw Output & view raw output of R engine  \tabularnewline
Computing time & 2 seconds \tabularnewline
R Server & 'George Udny Yule' @ 216.218.223.82 \tabularnewline
\hline
\end{tabular}
%Source: https://freestatistics.org/blog/index.php?pk=120463&T=0

[TABLE]
[ROW][C]Summary of computational transaction[/C][/ROW]
[ROW][C]Raw Input[/C][C]view raw input (R code) [/C][/ROW]
[ROW][C]Raw Output[/C][C]view raw output of R engine [/C][/ROW]
[ROW][C]Computing time[/C][C]2 seconds[/C][/ROW]
[ROW][C]R Server[/C][C]'George Udny Yule' @ 216.218.223.82[/C][/ROW]
[/TABLE]
Source: https://freestatistics.org/blog/index.php?pk=120463&T=0

Globally Unique Identifier (entire table): ba.freestatistics.org/blog/index.php?pk=120463&T=0

As an alternative you can also use a QR Code:  

The GUIDs for individual cells are displayed in the table below:

Summary of computational transaction
Raw Inputview raw input (R code)
Raw Outputview raw output of R engine
Computing time2 seconds
R Server'George Udny Yule' @ 216.218.223.82


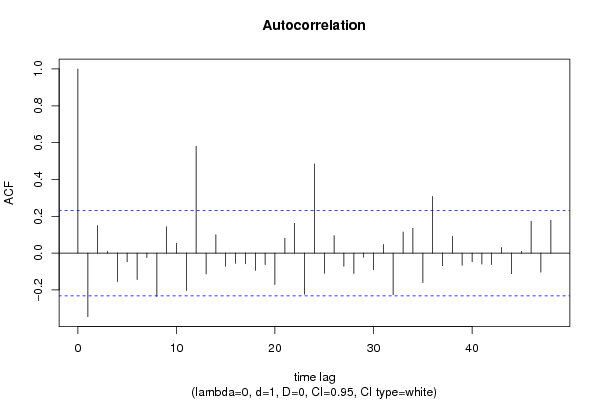
Autocorrelation Function
Time lag kACF(k)T-STATP-value
1-0.344942-2.90650.002436
20.1490641.2560.10661
30.01010.08510.466211
4-0.153833-1.29620.099549
5-0.046593-0.39260.347896
6-0.143354-1.20790.115543
7-0.023464-0.19770.421918
8-0.235119-1.98110.025724
90.1436251.21020.115107
100.0537450.45290.326014
11-0.202636-1.70740.046055
120.580284.88953e-06
13-0.113419-0.95570.171236
140.100110.84350.20088
15-0.070618-0.5950.276854
16-0.055821-0.47040.319772
17-0.058114-0.48970.312935
18-0.093675-0.78930.216276
19-0.061428-0.51760.303172
20-0.170196-1.43410.077967
210.0811440.68370.248186
220.1614721.36060.088974
23-0.22285-1.87780.03226
240.4837824.07645.9e-05
25-0.109374-0.92160.17993
260.0952130.80230.212534
27-0.071084-0.5990.275552
28-0.110915-0.93460.176584
29-0.021716-0.1830.427668
30-0.090329-0.76110.224552
310.0470360.39630.346525
32-0.226446-1.90810.030213
330.1150860.96970.167735
340.1344061.13250.130612
35-0.15989-1.34730.091091
360.307892.59430.005753
37-0.068001-0.5730.284233
380.0903750.76150.224437
39-0.065986-0.5560.289977
40-0.046536-0.39210.348071
41-0.059401-0.50050.309129
42-0.062055-0.52290.30134
430.0301490.2540.400099
44-0.111571-0.94010.175173
450.0095280.08030.468119
460.1730151.45780.074646
47-0.103191-0.86950.193752
480.178371.5030.068641

\begin{tabular}{lllllllll}
\hline
Autocorrelation Function \tabularnewline
Time lag k & ACF(k) & T-STAT & P-value \tabularnewline
1 & -0.344942 & -2.9065 & 0.002436 \tabularnewline
2 & 0.149064 & 1.256 & 0.10661 \tabularnewline
3 & 0.0101 & 0.0851 & 0.466211 \tabularnewline
4 & -0.153833 & -1.2962 & 0.099549 \tabularnewline
5 & -0.046593 & -0.3926 & 0.347896 \tabularnewline
6 & -0.143354 & -1.2079 & 0.115543 \tabularnewline
7 & -0.023464 & -0.1977 & 0.421918 \tabularnewline
8 & -0.235119 & -1.9811 & 0.025724 \tabularnewline
9 & 0.143625 & 1.2102 & 0.115107 \tabularnewline
10 & 0.053745 & 0.4529 & 0.326014 \tabularnewline
11 & -0.202636 & -1.7074 & 0.046055 \tabularnewline
12 & 0.58028 & 4.8895 & 3e-06 \tabularnewline
13 & -0.113419 & -0.9557 & 0.171236 \tabularnewline
14 & 0.10011 & 0.8435 & 0.20088 \tabularnewline
15 & -0.070618 & -0.595 & 0.276854 \tabularnewline
16 & -0.055821 & -0.4704 & 0.319772 \tabularnewline
17 & -0.058114 & -0.4897 & 0.312935 \tabularnewline
18 & -0.093675 & -0.7893 & 0.216276 \tabularnewline
19 & -0.061428 & -0.5176 & 0.303172 \tabularnewline
20 & -0.170196 & -1.4341 & 0.077967 \tabularnewline
21 & 0.081144 & 0.6837 & 0.248186 \tabularnewline
22 & 0.161472 & 1.3606 & 0.088974 \tabularnewline
23 & -0.22285 & -1.8778 & 0.03226 \tabularnewline
24 & 0.483782 & 4.0764 & 5.9e-05 \tabularnewline
25 & -0.109374 & -0.9216 & 0.17993 \tabularnewline
26 & 0.095213 & 0.8023 & 0.212534 \tabularnewline
27 & -0.071084 & -0.599 & 0.275552 \tabularnewline
28 & -0.110915 & -0.9346 & 0.176584 \tabularnewline
29 & -0.021716 & -0.183 & 0.427668 \tabularnewline
30 & -0.090329 & -0.7611 & 0.224552 \tabularnewline
31 & 0.047036 & 0.3963 & 0.346525 \tabularnewline
32 & -0.226446 & -1.9081 & 0.030213 \tabularnewline
33 & 0.115086 & 0.9697 & 0.167735 \tabularnewline
34 & 0.134406 & 1.1325 & 0.130612 \tabularnewline
35 & -0.15989 & -1.3473 & 0.091091 \tabularnewline
36 & 0.30789 & 2.5943 & 0.005753 \tabularnewline
37 & -0.068001 & -0.573 & 0.284233 \tabularnewline
38 & 0.090375 & 0.7615 & 0.224437 \tabularnewline
39 & -0.065986 & -0.556 & 0.289977 \tabularnewline
40 & -0.046536 & -0.3921 & 0.348071 \tabularnewline
41 & -0.059401 & -0.5005 & 0.309129 \tabularnewline
42 & -0.062055 & -0.5229 & 0.30134 \tabularnewline
43 & 0.030149 & 0.254 & 0.400099 \tabularnewline
44 & -0.111571 & -0.9401 & 0.175173 \tabularnewline
45 & 0.009528 & 0.0803 & 0.468119 \tabularnewline
46 & 0.173015 & 1.4578 & 0.074646 \tabularnewline
47 & -0.103191 & -0.8695 & 0.193752 \tabularnewline
48 & 0.17837 & 1.503 & 0.068641 \tabularnewline
\hline
\end{tabular}
%Source: https://freestatistics.org/blog/index.php?pk=120463&T=1

[TABLE]
[ROW][C]Autocorrelation Function[/C][/ROW]
[ROW][C]Time lag k[/C][C]ACF(k)[/C][C]T-STAT[/C][C]P-value[/C][/ROW]
[ROW][C]1[/C][C]-0.344942[/C][C]-2.9065[/C][C]0.002436[/C][/ROW]
[ROW][C]2[/C][C]0.149064[/C][C]1.256[/C][C]0.10661[/C][/ROW]
[ROW][C]3[/C][C]0.0101[/C][C]0.0851[/C][C]0.466211[/C][/ROW]
[ROW][C]4[/C][C]-0.153833[/C][C]-1.2962[/C][C]0.099549[/C][/ROW]
[ROW][C]5[/C][C]-0.046593[/C][C]-0.3926[/C][C]0.347896[/C][/ROW]
[ROW][C]6[/C][C]-0.143354[/C][C]-1.2079[/C][C]0.115543[/C][/ROW]
[ROW][C]7[/C][C]-0.023464[/C][C]-0.1977[/C][C]0.421918[/C][/ROW]
[ROW][C]8[/C][C]-0.235119[/C][C]-1.9811[/C][C]0.025724[/C][/ROW]
[ROW][C]9[/C][C]0.143625[/C][C]1.2102[/C][C]0.115107[/C][/ROW]
[ROW][C]10[/C][C]0.053745[/C][C]0.4529[/C][C]0.326014[/C][/ROW]
[ROW][C]11[/C][C]-0.202636[/C][C]-1.7074[/C][C]0.046055[/C][/ROW]
[ROW][C]12[/C][C]0.58028[/C][C]4.8895[/C][C]3e-06[/C][/ROW]
[ROW][C]13[/C][C]-0.113419[/C][C]-0.9557[/C][C]0.171236[/C][/ROW]
[ROW][C]14[/C][C]0.10011[/C][C]0.8435[/C][C]0.20088[/C][/ROW]
[ROW][C]15[/C][C]-0.070618[/C][C]-0.595[/C][C]0.276854[/C][/ROW]
[ROW][C]16[/C][C]-0.055821[/C][C]-0.4704[/C][C]0.319772[/C][/ROW]
[ROW][C]17[/C][C]-0.058114[/C][C]-0.4897[/C][C]0.312935[/C][/ROW]
[ROW][C]18[/C][C]-0.093675[/C][C]-0.7893[/C][C]0.216276[/C][/ROW]
[ROW][C]19[/C][C]-0.061428[/C][C]-0.5176[/C][C]0.303172[/C][/ROW]
[ROW][C]20[/C][C]-0.170196[/C][C]-1.4341[/C][C]0.077967[/C][/ROW]
[ROW][C]21[/C][C]0.081144[/C][C]0.6837[/C][C]0.248186[/C][/ROW]
[ROW][C]22[/C][C]0.161472[/C][C]1.3606[/C][C]0.088974[/C][/ROW]
[ROW][C]23[/C][C]-0.22285[/C][C]-1.8778[/C][C]0.03226[/C][/ROW]
[ROW][C]24[/C][C]0.483782[/C][C]4.0764[/C][C]5.9e-05[/C][/ROW]
[ROW][C]25[/C][C]-0.109374[/C][C]-0.9216[/C][C]0.17993[/C][/ROW]
[ROW][C]26[/C][C]0.095213[/C][C]0.8023[/C][C]0.212534[/C][/ROW]
[ROW][C]27[/C][C]-0.071084[/C][C]-0.599[/C][C]0.275552[/C][/ROW]
[ROW][C]28[/C][C]-0.110915[/C][C]-0.9346[/C][C]0.176584[/C][/ROW]
[ROW][C]29[/C][C]-0.021716[/C][C]-0.183[/C][C]0.427668[/C][/ROW]
[ROW][C]30[/C][C]-0.090329[/C][C]-0.7611[/C][C]0.224552[/C][/ROW]
[ROW][C]31[/C][C]0.047036[/C][C]0.3963[/C][C]0.346525[/C][/ROW]
[ROW][C]32[/C][C]-0.226446[/C][C]-1.9081[/C][C]0.030213[/C][/ROW]
[ROW][C]33[/C][C]0.115086[/C][C]0.9697[/C][C]0.167735[/C][/ROW]
[ROW][C]34[/C][C]0.134406[/C][C]1.1325[/C][C]0.130612[/C][/ROW]
[ROW][C]35[/C][C]-0.15989[/C][C]-1.3473[/C][C]0.091091[/C][/ROW]
[ROW][C]36[/C][C]0.30789[/C][C]2.5943[/C][C]0.005753[/C][/ROW]
[ROW][C]37[/C][C]-0.068001[/C][C]-0.573[/C][C]0.284233[/C][/ROW]
[ROW][C]38[/C][C]0.090375[/C][C]0.7615[/C][C]0.224437[/C][/ROW]
[ROW][C]39[/C][C]-0.065986[/C][C]-0.556[/C][C]0.289977[/C][/ROW]
[ROW][C]40[/C][C]-0.046536[/C][C]-0.3921[/C][C]0.348071[/C][/ROW]
[ROW][C]41[/C][C]-0.059401[/C][C]-0.5005[/C][C]0.309129[/C][/ROW]
[ROW][C]42[/C][C]-0.062055[/C][C]-0.5229[/C][C]0.30134[/C][/ROW]
[ROW][C]43[/C][C]0.030149[/C][C]0.254[/C][C]0.400099[/C][/ROW]
[ROW][C]44[/C][C]-0.111571[/C][C]-0.9401[/C][C]0.175173[/C][/ROW]
[ROW][C]45[/C][C]0.009528[/C][C]0.0803[/C][C]0.468119[/C][/ROW]
[ROW][C]46[/C][C]0.173015[/C][C]1.4578[/C][C]0.074646[/C][/ROW]
[ROW][C]47[/C][C]-0.103191[/C][C]-0.8695[/C][C]0.193752[/C][/ROW]
[ROW][C]48[/C][C]0.17837[/C][C]1.503[/C][C]0.068641[/C][/ROW]
[/TABLE]
Source: https://freestatistics.org/blog/index.php?pk=120463&T=1

Globally Unique Identifier (entire table): ba.freestatistics.org/blog/index.php?pk=120463&T=1

As an alternative you can also use a QR Code:  

The GUIDs for individual cells are displayed in the table below:

Autocorrelation Function
Time lag kACF(k)T-STATP-value
1-0.344942-2.90650.002436
20.1490641.2560.10661
30.01010.08510.466211
4-0.153833-1.29620.099549
5-0.046593-0.39260.347896
6-0.143354-1.20790.115543
7-0.023464-0.19770.421918
8-0.235119-1.98110.025724
90.1436251.21020.115107
100.0537450.45290.326014
11-0.202636-1.70740.046055
120.580284.88953e-06
13-0.113419-0.95570.171236
140.100110.84350.20088
15-0.070618-0.5950.276854
16-0.055821-0.47040.319772
17-0.058114-0.48970.312935
18-0.093675-0.78930.216276
19-0.061428-0.51760.303172
20-0.170196-1.43410.077967
210.0811440.68370.248186
220.1614721.36060.088974
23-0.22285-1.87780.03226
240.4837824.07645.9e-05
25-0.109374-0.92160.17993
260.0952130.80230.212534
27-0.071084-0.5990.275552
28-0.110915-0.93460.176584
29-0.021716-0.1830.427668
30-0.090329-0.76110.224552
310.0470360.39630.346525
32-0.226446-1.90810.030213
330.1150860.96970.167735
340.1344061.13250.130612
35-0.15989-1.34730.091091
360.307892.59430.005753
37-0.068001-0.5730.284233
380.0903750.76150.224437
39-0.065986-0.5560.289977
40-0.046536-0.39210.348071
41-0.059401-0.50050.309129
42-0.062055-0.52290.30134
430.0301490.2540.400099
44-0.111571-0.94010.175173
450.0095280.08030.468119
460.1730151.45780.074646
47-0.103191-0.86950.193752
480.178371.5030.068641


Partial Autocorrelation Function
Time lag kPACF(k)T-STATP-value
1-0.344942-2.90650.002436
20.0341420.28770.387214
30.0812960.6850.247783
4-0.150456-1.26780.104512
5-0.17976-1.51470.067146
6-0.216932-1.82790.035883
7-0.132673-1.11790.133685
8-0.356318-3.00240.001848
9-0.154308-1.30020.098865
100.0133270.11230.455453
11-0.382844-3.22590.00095
120.309822.61060.005509
130.2659692.24110.014074
140.046910.39530.346913
15-0.154493-1.30180.0986
16-0.05852-0.49310.311733
170.0740570.6240.267308
180.0387390.32640.372534
19-0.142776-1.2030.116477
200.0004230.00360.498584
21-0.040281-0.33940.367649
220.1485911.25210.10733
23-0.122465-1.03190.152809
240.1793981.51160.067533
250.0577080.48630.314141
26-0.070731-0.5960.276538
27-0.052431-0.44180.329991
28-0.056321-0.47460.318275
29-0.020257-0.17070.432477
30-0.016355-0.13780.445389
310.1081450.91120.182625
320.0518590.4370.331729
33-0.02948-0.24840.40227
34-0.042154-0.35520.361747
35-0.001925-0.01620.493552
36-0.098794-0.83250.203972
37-0.038154-0.32150.374393
38-0.03168-0.26690.395145
390.068190.57460.283696
400.0385140.32450.373247
410.041030.34570.365286
420.0028640.02410.490408
43-0.087318-0.73580.232152
440.0757630.63840.262638
450.0049560.04180.483405
46-0.002754-0.02320.490775
470.0304130.25630.399244
48-0.021757-0.18330.427531

\begin{tabular}{lllllllll}
\hline
Partial Autocorrelation Function \tabularnewline
Time lag k & PACF(k) & T-STAT & P-value \tabularnewline
1 & -0.344942 & -2.9065 & 0.002436 \tabularnewline
2 & 0.034142 & 0.2877 & 0.387214 \tabularnewline
3 & 0.081296 & 0.685 & 0.247783 \tabularnewline
4 & -0.150456 & -1.2678 & 0.104512 \tabularnewline
5 & -0.17976 & -1.5147 & 0.067146 \tabularnewline
6 & -0.216932 & -1.8279 & 0.035883 \tabularnewline
7 & -0.132673 & -1.1179 & 0.133685 \tabularnewline
8 & -0.356318 & -3.0024 & 0.001848 \tabularnewline
9 & -0.154308 & -1.3002 & 0.098865 \tabularnewline
10 & 0.013327 & 0.1123 & 0.455453 \tabularnewline
11 & -0.382844 & -3.2259 & 0.00095 \tabularnewline
12 & 0.30982 & 2.6106 & 0.005509 \tabularnewline
13 & 0.265969 & 2.2411 & 0.014074 \tabularnewline
14 & 0.04691 & 0.3953 & 0.346913 \tabularnewline
15 & -0.154493 & -1.3018 & 0.0986 \tabularnewline
16 & -0.05852 & -0.4931 & 0.311733 \tabularnewline
17 & 0.074057 & 0.624 & 0.267308 \tabularnewline
18 & 0.038739 & 0.3264 & 0.372534 \tabularnewline
19 & -0.142776 & -1.203 & 0.116477 \tabularnewline
20 & 0.000423 & 0.0036 & 0.498584 \tabularnewline
21 & -0.040281 & -0.3394 & 0.367649 \tabularnewline
22 & 0.148591 & 1.2521 & 0.10733 \tabularnewline
23 & -0.122465 & -1.0319 & 0.152809 \tabularnewline
24 & 0.179398 & 1.5116 & 0.067533 \tabularnewline
25 & 0.057708 & 0.4863 & 0.314141 \tabularnewline
26 & -0.070731 & -0.596 & 0.276538 \tabularnewline
27 & -0.052431 & -0.4418 & 0.329991 \tabularnewline
28 & -0.056321 & -0.4746 & 0.318275 \tabularnewline
29 & -0.020257 & -0.1707 & 0.432477 \tabularnewline
30 & -0.016355 & -0.1378 & 0.445389 \tabularnewline
31 & 0.108145 & 0.9112 & 0.182625 \tabularnewline
32 & 0.051859 & 0.437 & 0.331729 \tabularnewline
33 & -0.02948 & -0.2484 & 0.40227 \tabularnewline
34 & -0.042154 & -0.3552 & 0.361747 \tabularnewline
35 & -0.001925 & -0.0162 & 0.493552 \tabularnewline
36 & -0.098794 & -0.8325 & 0.203972 \tabularnewline
37 & -0.038154 & -0.3215 & 0.374393 \tabularnewline
38 & -0.03168 & -0.2669 & 0.395145 \tabularnewline
39 & 0.06819 & 0.5746 & 0.283696 \tabularnewline
40 & 0.038514 & 0.3245 & 0.373247 \tabularnewline
41 & 0.04103 & 0.3457 & 0.365286 \tabularnewline
42 & 0.002864 & 0.0241 & 0.490408 \tabularnewline
43 & -0.087318 & -0.7358 & 0.232152 \tabularnewline
44 & 0.075763 & 0.6384 & 0.262638 \tabularnewline
45 & 0.004956 & 0.0418 & 0.483405 \tabularnewline
46 & -0.002754 & -0.0232 & 0.490775 \tabularnewline
47 & 0.030413 & 0.2563 & 0.399244 \tabularnewline
48 & -0.021757 & -0.1833 & 0.427531 \tabularnewline
\hline
\end{tabular}
%Source: https://freestatistics.org/blog/index.php?pk=120463&T=2

[TABLE]
[ROW][C]Partial Autocorrelation Function[/C][/ROW]
[ROW][C]Time lag k[/C][C]PACF(k)[/C][C]T-STAT[/C][C]P-value[/C][/ROW]
[ROW][C]1[/C][C]-0.344942[/C][C]-2.9065[/C][C]0.002436[/C][/ROW]
[ROW][C]2[/C][C]0.034142[/C][C]0.2877[/C][C]0.387214[/C][/ROW]
[ROW][C]3[/C][C]0.081296[/C][C]0.685[/C][C]0.247783[/C][/ROW]
[ROW][C]4[/C][C]-0.150456[/C][C]-1.2678[/C][C]0.104512[/C][/ROW]
[ROW][C]5[/C][C]-0.17976[/C][C]-1.5147[/C][C]0.067146[/C][/ROW]
[ROW][C]6[/C][C]-0.216932[/C][C]-1.8279[/C][C]0.035883[/C][/ROW]
[ROW][C]7[/C][C]-0.132673[/C][C]-1.1179[/C][C]0.133685[/C][/ROW]
[ROW][C]8[/C][C]-0.356318[/C][C]-3.0024[/C][C]0.001848[/C][/ROW]
[ROW][C]9[/C][C]-0.154308[/C][C]-1.3002[/C][C]0.098865[/C][/ROW]
[ROW][C]10[/C][C]0.013327[/C][C]0.1123[/C][C]0.455453[/C][/ROW]
[ROW][C]11[/C][C]-0.382844[/C][C]-3.2259[/C][C]0.00095[/C][/ROW]
[ROW][C]12[/C][C]0.30982[/C][C]2.6106[/C][C]0.005509[/C][/ROW]
[ROW][C]13[/C][C]0.265969[/C][C]2.2411[/C][C]0.014074[/C][/ROW]
[ROW][C]14[/C][C]0.04691[/C][C]0.3953[/C][C]0.346913[/C][/ROW]
[ROW][C]15[/C][C]-0.154493[/C][C]-1.3018[/C][C]0.0986[/C][/ROW]
[ROW][C]16[/C][C]-0.05852[/C][C]-0.4931[/C][C]0.311733[/C][/ROW]
[ROW][C]17[/C][C]0.074057[/C][C]0.624[/C][C]0.267308[/C][/ROW]
[ROW][C]18[/C][C]0.038739[/C][C]0.3264[/C][C]0.372534[/C][/ROW]
[ROW][C]19[/C][C]-0.142776[/C][C]-1.203[/C][C]0.116477[/C][/ROW]
[ROW][C]20[/C][C]0.000423[/C][C]0.0036[/C][C]0.498584[/C][/ROW]
[ROW][C]21[/C][C]-0.040281[/C][C]-0.3394[/C][C]0.367649[/C][/ROW]
[ROW][C]22[/C][C]0.148591[/C][C]1.2521[/C][C]0.10733[/C][/ROW]
[ROW][C]23[/C][C]-0.122465[/C][C]-1.0319[/C][C]0.152809[/C][/ROW]
[ROW][C]24[/C][C]0.179398[/C][C]1.5116[/C][C]0.067533[/C][/ROW]
[ROW][C]25[/C][C]0.057708[/C][C]0.4863[/C][C]0.314141[/C][/ROW]
[ROW][C]26[/C][C]-0.070731[/C][C]-0.596[/C][C]0.276538[/C][/ROW]
[ROW][C]27[/C][C]-0.052431[/C][C]-0.4418[/C][C]0.329991[/C][/ROW]
[ROW][C]28[/C][C]-0.056321[/C][C]-0.4746[/C][C]0.318275[/C][/ROW]
[ROW][C]29[/C][C]-0.020257[/C][C]-0.1707[/C][C]0.432477[/C][/ROW]
[ROW][C]30[/C][C]-0.016355[/C][C]-0.1378[/C][C]0.445389[/C][/ROW]
[ROW][C]31[/C][C]0.108145[/C][C]0.9112[/C][C]0.182625[/C][/ROW]
[ROW][C]32[/C][C]0.051859[/C][C]0.437[/C][C]0.331729[/C][/ROW]
[ROW][C]33[/C][C]-0.02948[/C][C]-0.2484[/C][C]0.40227[/C][/ROW]
[ROW][C]34[/C][C]-0.042154[/C][C]-0.3552[/C][C]0.361747[/C][/ROW]
[ROW][C]35[/C][C]-0.001925[/C][C]-0.0162[/C][C]0.493552[/C][/ROW]
[ROW][C]36[/C][C]-0.098794[/C][C]-0.8325[/C][C]0.203972[/C][/ROW]
[ROW][C]37[/C][C]-0.038154[/C][C]-0.3215[/C][C]0.374393[/C][/ROW]
[ROW][C]38[/C][C]-0.03168[/C][C]-0.2669[/C][C]0.395145[/C][/ROW]
[ROW][C]39[/C][C]0.06819[/C][C]0.5746[/C][C]0.283696[/C][/ROW]
[ROW][C]40[/C][C]0.038514[/C][C]0.3245[/C][C]0.373247[/C][/ROW]
[ROW][C]41[/C][C]0.04103[/C][C]0.3457[/C][C]0.365286[/C][/ROW]
[ROW][C]42[/C][C]0.002864[/C][C]0.0241[/C][C]0.490408[/C][/ROW]
[ROW][C]43[/C][C]-0.087318[/C][C]-0.7358[/C][C]0.232152[/C][/ROW]
[ROW][C]44[/C][C]0.075763[/C][C]0.6384[/C][C]0.262638[/C][/ROW]
[ROW][C]45[/C][C]0.004956[/C][C]0.0418[/C][C]0.483405[/C][/ROW]
[ROW][C]46[/C][C]-0.002754[/C][C]-0.0232[/C][C]0.490775[/C][/ROW]
[ROW][C]47[/C][C]0.030413[/C][C]0.2563[/C][C]0.399244[/C][/ROW]
[ROW][C]48[/C][C]-0.021757[/C][C]-0.1833[/C][C]0.427531[/C][/ROW]
[/TABLE]
Source: https://freestatistics.org/blog/index.php?pk=120463&T=2

Globally Unique Identifier (entire table): ba.freestatistics.org/blog/index.php?pk=120463&T=2

As an alternative you can also use a QR Code:  

The GUIDs for individual cells are displayed in the table below:

Partial Autocorrelation Function
Time lag kPACF(k)T-STATP-value
1-0.344942-2.90650.002436
20.0341420.28770.387214
30.0812960.6850.247783
4-0.150456-1.26780.104512
5-0.17976-1.51470.067146
6-0.216932-1.82790.035883
7-0.132673-1.11790.133685
8-0.356318-3.00240.001848
9-0.154308-1.30020.098865
100.0133270.11230.455453
11-0.382844-3.22590.00095
120.309822.61060.005509
130.2659692.24110.014074
140.046910.39530.346913
15-0.154493-1.30180.0986
16-0.05852-0.49310.311733
170.0740570.6240.267308
180.0387390.32640.372534
19-0.142776-1.2030.116477
200.0004230.00360.498584
21-0.040281-0.33940.367649
220.1485911.25210.10733
23-0.122465-1.03190.152809
240.1793981.51160.067533
250.0577080.48630.314141
26-0.070731-0.5960.276538
27-0.052431-0.44180.329991
28-0.056321-0.47460.318275
29-0.020257-0.17070.432477
30-0.016355-0.13780.445389
310.1081450.91120.182625
320.0518590.4370.331729
33-0.02948-0.24840.40227
34-0.042154-0.35520.361747
35-0.001925-0.01620.493552
36-0.098794-0.83250.203972
37-0.038154-0.32150.374393
38-0.03168-0.26690.395145
390.068190.57460.283696
400.0385140.32450.373247
410.041030.34570.365286
420.0028640.02410.490408
43-0.087318-0.73580.232152
440.0757630.63840.262638
450.0049560.04180.483405
46-0.002754-0.02320.490775
470.0304130.25630.399244
48-0.021757-0.18330.427531


Parameters (Session):
par1 = 48 ; par2 = 0.0 ; par3 = 1 ; par4 = 0 ; par5 = 12 ; par6 = White Noise ; par7 = 0.95 ;
Parameters (R input):
par1 = 48 ; par2 = 0.0 ; par3 = 1 ; par4 = 0 ; par5 = 12 ; par6 = White Noise ; par7 = 0.95 ; par8 = ;
R code (references can be found in the software module):
if (par1 == 'Default') {
par1 = 10*log10(length(x))
} else {
par1 <- as.numeric(par1)
}
par2 <- as.numeric(par2)
par3 <- as.numeric(par3)
par4 <- as.numeric(par4)
par5 <- as.numeric(par5)
if (par6 == 'White Noise') par6 <- 'white' else par6 <- 'ma'
par7 <- as.numeric(par7)
if (par8 != '') par8 <- as.numeric(par8)
ox <- x
if (par8 == '') {
if (par2 == 0) {
x <- log(x)
} else {
x <- (x ^ par2 - 1) / par2
}
} else {
x <- log(x,base=par8)
}
if (par3 > 0) x <- diff(x,lag=1,difference=par3)
if (par4 > 0) x <- diff(x,lag=par5,difference=par4)
bitmap(file='picts.png')
op <- par(mfrow=c(2,1))
plot(ox,type='l',main='Original Time Series',xlab='time',ylab='value')
if (par8=='') {
mytitle <- paste('Working Time Series (lambda=',par2,', d=',par3,', D=',par4,')',sep='')
mysub <- paste('(lambda=',par2,', d=',par3,', D=',par4,', CI=', par7, ', CI type=',par6,')',sep='')
} else {
mytitle <- paste('Working Time Series (base=',par8,', d=',par3,', D=',par4,')',sep='')
mysub <- paste('(base=',par8,', d=',par3,', D=',par4,', CI=', par7, ', CI type=',par6,')',sep='')
}
plot(x,type='l', main=mytitle,xlab='time',ylab='value')
par(op)
dev.off()
bitmap(file='pic1.png')
racf <- acf(x, par1, main='Autocorrelation', xlab='time lag', ylab='ACF', ci.type=par6, ci=par7, sub=mysub)
dev.off()
bitmap(file='pic2.png')
rpacf <- pacf(x,par1,main='Partial Autocorrelation',xlab='lags',ylab='PACF',sub=mysub)
dev.off()
(myacf <- c(racf$acf))
(mypacf <- c(rpacf$acf))
lengthx <- length(x)
sqrtn <- sqrt(lengthx)
load(file='createtable')
a<-table.start()
a<-table.row.start(a)
a<-table.element(a,'Autocorrelation Function',4,TRUE)
a<-table.row.end(a)
a<-table.row.start(a)
a<-table.element(a,'Time lag k',header=TRUE)
a<-table.element(a,hyperlink('basics.htm','ACF(k)','click here for more information about the Autocorrelation Function'),header=TRUE)
a<-table.element(a,'T-STAT',header=TRUE)
a<-table.element(a,'P-value',header=TRUE)
a<-table.row.end(a)
for (i in 2:(par1+1)) {
a<-table.row.start(a)
a<-table.element(a,i-1,header=TRUE)
a<-table.element(a,round(myacf[i],6))
mytstat <- myacf[i]*sqrtn
a<-table.element(a,round(mytstat,4))
a<-table.element(a,round(1-pt(abs(mytstat),lengthx),6))
a<-table.row.end(a)
}
a<-table.end(a)
table.save(a,file='mytable.tab')
a<-table.start()
a<-table.row.start(a)
a<-table.element(a,'Partial Autocorrelation Function',4,TRUE)
a<-table.row.end(a)
a<-table.row.start(a)
a<-table.element(a,'Time lag k',header=TRUE)
a<-table.element(a,hyperlink('basics.htm','PACF(k)','click here for more information about the Partial Autocorrelation Function'),header=TRUE)
a<-table.element(a,'T-STAT',header=TRUE)
a<-table.element(a,'P-value',header=TRUE)
a<-table.row.end(a)
for (i in 1:par1) {
a<-table.row.start(a)
a<-table.element(a,i,header=TRUE)
a<-table.element(a,round(mypacf[i],6))
mytstat <- mypacf[i]*sqrtn
a<-table.element(a,round(mytstat,4))
a<-table.element(a,round(1-pt(abs(mytstat),lengthx),6))
a<-table.row.end(a)
}
a<-table.end(a)
table.save(a,file='mytable1.tab')