Free Statistics

of Irreproducible Research!

Author's title

Author*Unverified author*
R Software Modulerwasp_autocorrelation.wasp
Title produced by software(Partial) Autocorrelation Function
Date of computationMon, 11 Apr 2011 13:41:35 +0000
Cite this page as followsStatistical Computations at FreeStatistics.org, Office for Research Development and Education, URL https://freestatistics.org/blog/index.php?v=date/2011/Apr/11/t130252908765b4y3lr53eslpb.htm/, Retrieved Thu, 09 May 2024 10:10:52 +0000
Statistical Computations at FreeStatistics.org, Office for Research Development and Education, URL https://freestatistics.org/blog/index.php?pk=120462, Retrieved Thu, 09 May 2024 10:10:52 +0000
QR Codes:

Original text written by user:
IsPrivate?No (this computation is public)
User-defined keywordsKDGP2W12
Estimated Impact145
Family? (F = Feedback message, R = changed R code, M = changed R Module, P = changed Parameters, D = changed Data)
-       [(Partial) Autocorrelation Function] [] [2011-04-11 13:41:35] [dc16c24fae4397a85c64c2b70586e631] [Current]
Feedback Forum

Post a new message
Dataseries X:
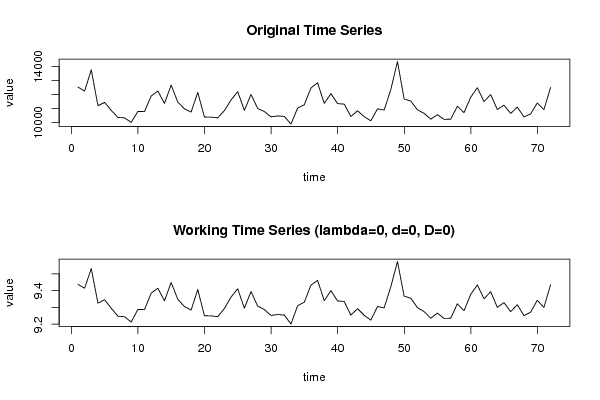
12544
12264
13783
11214
11453
10883
10381
10348
10024
10805
10796
11907
12261
11377
12689
11474
10992
10764
12164
10409
10398
10349
10865
11630
12221
10884
12019
11021
10799
10423
10484
10450
9906
11049
11281
12485
12849
11380
12079
11366
11328
10444
10854
10434
10137
10992
10906
12367
14371
11695
11546
10922
10670
10254
10573
10239
10253
11176
10719
11817
12503
11510
12012
10941
11252
10662
11114
10415
10626
11411
10936
12513


Summary of computational transaction
Raw Inputview raw input (R code)
Raw Outputview raw output of R engine
Computing time2 seconds
R Server'Gwilym Jenkins' @ www.wessa.org

\begin{tabular}{lllllllll}
\hline
Summary of computational transaction \tabularnewline
Raw Input & view raw input (R code)  \tabularnewline
Raw Output & view raw output of R engine  \tabularnewline
Computing time & 2 seconds \tabularnewline
R Server & 'Gwilym Jenkins' @ www.wessa.org \tabularnewline
\hline
\end{tabular}
%Source: https://freestatistics.org/blog/index.php?pk=120462&T=0

[TABLE]
[ROW][C]Summary of computational transaction[/C][/ROW]
[ROW][C]Raw Input[/C][C]view raw input (R code) [/C][/ROW]
[ROW][C]Raw Output[/C][C]view raw output of R engine [/C][/ROW]
[ROW][C]Computing time[/C][C]2 seconds[/C][/ROW]
[ROW][C]R Server[/C][C]'Gwilym Jenkins' @ www.wessa.org[/C][/ROW]
[/TABLE]
Source: https://freestatistics.org/blog/index.php?pk=120462&T=0

Globally Unique Identifier (entire table): ba.freestatistics.org/blog/index.php?pk=120462&T=0

As an alternative you can also use a QR Code:  

The GUIDs for individual cells are displayed in the table below:

Summary of computational transaction
Raw Inputview raw input (R code)
Raw Outputview raw output of R engine
Computing time2 seconds
R Server'Gwilym Jenkins' @ www.wessa.org


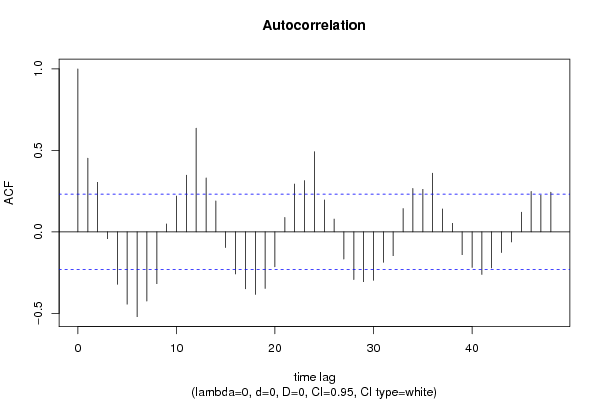
Autocorrelation Function
Time lag kACF(k)T-STATP-value
10.4522053.83710.000132
20.3041422.58070.005949
3-0.042025-0.35660.361218
4-0.322357-2.73530.003921
5-0.443856-3.76620.000168
6-0.520568-4.41721.7e-05
7-0.424598-3.60280.000288
8-0.31801-2.69840.004337
90.0483520.41030.34141
100.2200541.86720.032971
110.3478952.9520.00213
120.6360585.39710
130.3306682.80580.003225
140.1897361.610.055891
15-0.096302-0.81710.208269
16-0.258116-2.19020.015875
17-0.349915-2.96910.002027
18-0.38444-3.26210.000846
19-0.347529-2.94890.002149
20-0.2147-1.82180.03632
210.0883030.74930.228067
220.29362.49130.007517
230.314832.67140.004667
240.4922574.17694.1e-05
250.195771.66120.050515
260.0785250.66630.253673
27-0.166841-1.41570.080589
28-0.29277-2.48420.007655
29-0.306065-2.5970.005697
30-0.297747-2.52650.00686
31-0.187124-1.58780.058357
32-0.146254-1.2410.109316
330.142921.21270.114601
340.2663262.25990.013428
350.2609672.21440.014985
360.360273.0570.001568
370.1406671.19360.118277
380.0524370.44490.328848
39-0.140219-1.18980.119017
40-0.218237-1.85180.034077
41-0.261614-2.21990.014789
42-0.221914-1.8830.03187
43-0.127047-1.0780.14231
44-0.062057-0.52660.300056
450.1209221.02610.15415
460.2482232.10620.019335
470.2254061.91260.029886
480.2433322.06470.021275

\begin{tabular}{lllllllll}
\hline
Autocorrelation Function \tabularnewline
Time lag k & ACF(k) & T-STAT & P-value \tabularnewline
1 & 0.452205 & 3.8371 & 0.000132 \tabularnewline
2 & 0.304142 & 2.5807 & 0.005949 \tabularnewline
3 & -0.042025 & -0.3566 & 0.361218 \tabularnewline
4 & -0.322357 & -2.7353 & 0.003921 \tabularnewline
5 & -0.443856 & -3.7662 & 0.000168 \tabularnewline
6 & -0.520568 & -4.4172 & 1.7e-05 \tabularnewline
7 & -0.424598 & -3.6028 & 0.000288 \tabularnewline
8 & -0.31801 & -2.6984 & 0.004337 \tabularnewline
9 & 0.048352 & 0.4103 & 0.34141 \tabularnewline
10 & 0.220054 & 1.8672 & 0.032971 \tabularnewline
11 & 0.347895 & 2.952 & 0.00213 \tabularnewline
12 & 0.636058 & 5.3971 & 0 \tabularnewline
13 & 0.330668 & 2.8058 & 0.003225 \tabularnewline
14 & 0.189736 & 1.61 & 0.055891 \tabularnewline
15 & -0.096302 & -0.8171 & 0.208269 \tabularnewline
16 & -0.258116 & -2.1902 & 0.015875 \tabularnewline
17 & -0.349915 & -2.9691 & 0.002027 \tabularnewline
18 & -0.38444 & -3.2621 & 0.000846 \tabularnewline
19 & -0.347529 & -2.9489 & 0.002149 \tabularnewline
20 & -0.2147 & -1.8218 & 0.03632 \tabularnewline
21 & 0.088303 & 0.7493 & 0.228067 \tabularnewline
22 & 0.2936 & 2.4913 & 0.007517 \tabularnewline
23 & 0.31483 & 2.6714 & 0.004667 \tabularnewline
24 & 0.492257 & 4.1769 & 4.1e-05 \tabularnewline
25 & 0.19577 & 1.6612 & 0.050515 \tabularnewline
26 & 0.078525 & 0.6663 & 0.253673 \tabularnewline
27 & -0.166841 & -1.4157 & 0.080589 \tabularnewline
28 & -0.29277 & -2.4842 & 0.007655 \tabularnewline
29 & -0.306065 & -2.597 & 0.005697 \tabularnewline
30 & -0.297747 & -2.5265 & 0.00686 \tabularnewline
31 & -0.187124 & -1.5878 & 0.058357 \tabularnewline
32 & -0.146254 & -1.241 & 0.109316 \tabularnewline
33 & 0.14292 & 1.2127 & 0.114601 \tabularnewline
34 & 0.266326 & 2.2599 & 0.013428 \tabularnewline
35 & 0.260967 & 2.2144 & 0.014985 \tabularnewline
36 & 0.36027 & 3.057 & 0.001568 \tabularnewline
37 & 0.140667 & 1.1936 & 0.118277 \tabularnewline
38 & 0.052437 & 0.4449 & 0.328848 \tabularnewline
39 & -0.140219 & -1.1898 & 0.119017 \tabularnewline
40 & -0.218237 & -1.8518 & 0.034077 \tabularnewline
41 & -0.261614 & -2.2199 & 0.014789 \tabularnewline
42 & -0.221914 & -1.883 & 0.03187 \tabularnewline
43 & -0.127047 & -1.078 & 0.14231 \tabularnewline
44 & -0.062057 & -0.5266 & 0.300056 \tabularnewline
45 & 0.120922 & 1.0261 & 0.15415 \tabularnewline
46 & 0.248223 & 2.1062 & 0.019335 \tabularnewline
47 & 0.225406 & 1.9126 & 0.029886 \tabularnewline
48 & 0.243332 & 2.0647 & 0.021275 \tabularnewline
\hline
\end{tabular}
%Source: https://freestatistics.org/blog/index.php?pk=120462&T=1

[TABLE]
[ROW][C]Autocorrelation Function[/C][/ROW]
[ROW][C]Time lag k[/C][C]ACF(k)[/C][C]T-STAT[/C][C]P-value[/C][/ROW]
[ROW][C]1[/C][C]0.452205[/C][C]3.8371[/C][C]0.000132[/C][/ROW]
[ROW][C]2[/C][C]0.304142[/C][C]2.5807[/C][C]0.005949[/C][/ROW]
[ROW][C]3[/C][C]-0.042025[/C][C]-0.3566[/C][C]0.361218[/C][/ROW]
[ROW][C]4[/C][C]-0.322357[/C][C]-2.7353[/C][C]0.003921[/C][/ROW]
[ROW][C]5[/C][C]-0.443856[/C][C]-3.7662[/C][C]0.000168[/C][/ROW]
[ROW][C]6[/C][C]-0.520568[/C][C]-4.4172[/C][C]1.7e-05[/C][/ROW]
[ROW][C]7[/C][C]-0.424598[/C][C]-3.6028[/C][C]0.000288[/C][/ROW]
[ROW][C]8[/C][C]-0.31801[/C][C]-2.6984[/C][C]0.004337[/C][/ROW]
[ROW][C]9[/C][C]0.048352[/C][C]0.4103[/C][C]0.34141[/C][/ROW]
[ROW][C]10[/C][C]0.220054[/C][C]1.8672[/C][C]0.032971[/C][/ROW]
[ROW][C]11[/C][C]0.347895[/C][C]2.952[/C][C]0.00213[/C][/ROW]
[ROW][C]12[/C][C]0.636058[/C][C]5.3971[/C][C]0[/C][/ROW]
[ROW][C]13[/C][C]0.330668[/C][C]2.8058[/C][C]0.003225[/C][/ROW]
[ROW][C]14[/C][C]0.189736[/C][C]1.61[/C][C]0.055891[/C][/ROW]
[ROW][C]15[/C][C]-0.096302[/C][C]-0.8171[/C][C]0.208269[/C][/ROW]
[ROW][C]16[/C][C]-0.258116[/C][C]-2.1902[/C][C]0.015875[/C][/ROW]
[ROW][C]17[/C][C]-0.349915[/C][C]-2.9691[/C][C]0.002027[/C][/ROW]
[ROW][C]18[/C][C]-0.38444[/C][C]-3.2621[/C][C]0.000846[/C][/ROW]
[ROW][C]19[/C][C]-0.347529[/C][C]-2.9489[/C][C]0.002149[/C][/ROW]
[ROW][C]20[/C][C]-0.2147[/C][C]-1.8218[/C][C]0.03632[/C][/ROW]
[ROW][C]21[/C][C]0.088303[/C][C]0.7493[/C][C]0.228067[/C][/ROW]
[ROW][C]22[/C][C]0.2936[/C][C]2.4913[/C][C]0.007517[/C][/ROW]
[ROW][C]23[/C][C]0.31483[/C][C]2.6714[/C][C]0.004667[/C][/ROW]
[ROW][C]24[/C][C]0.492257[/C][C]4.1769[/C][C]4.1e-05[/C][/ROW]
[ROW][C]25[/C][C]0.19577[/C][C]1.6612[/C][C]0.050515[/C][/ROW]
[ROW][C]26[/C][C]0.078525[/C][C]0.6663[/C][C]0.253673[/C][/ROW]
[ROW][C]27[/C][C]-0.166841[/C][C]-1.4157[/C][C]0.080589[/C][/ROW]
[ROW][C]28[/C][C]-0.29277[/C][C]-2.4842[/C][C]0.007655[/C][/ROW]
[ROW][C]29[/C][C]-0.306065[/C][C]-2.597[/C][C]0.005697[/C][/ROW]
[ROW][C]30[/C][C]-0.297747[/C][C]-2.5265[/C][C]0.00686[/C][/ROW]
[ROW][C]31[/C][C]-0.187124[/C][C]-1.5878[/C][C]0.058357[/C][/ROW]
[ROW][C]32[/C][C]-0.146254[/C][C]-1.241[/C][C]0.109316[/C][/ROW]
[ROW][C]33[/C][C]0.14292[/C][C]1.2127[/C][C]0.114601[/C][/ROW]
[ROW][C]34[/C][C]0.266326[/C][C]2.2599[/C][C]0.013428[/C][/ROW]
[ROW][C]35[/C][C]0.260967[/C][C]2.2144[/C][C]0.014985[/C][/ROW]
[ROW][C]36[/C][C]0.36027[/C][C]3.057[/C][C]0.001568[/C][/ROW]
[ROW][C]37[/C][C]0.140667[/C][C]1.1936[/C][C]0.118277[/C][/ROW]
[ROW][C]38[/C][C]0.052437[/C][C]0.4449[/C][C]0.328848[/C][/ROW]
[ROW][C]39[/C][C]-0.140219[/C][C]-1.1898[/C][C]0.119017[/C][/ROW]
[ROW][C]40[/C][C]-0.218237[/C][C]-1.8518[/C][C]0.034077[/C][/ROW]
[ROW][C]41[/C][C]-0.261614[/C][C]-2.2199[/C][C]0.014789[/C][/ROW]
[ROW][C]42[/C][C]-0.221914[/C][C]-1.883[/C][C]0.03187[/C][/ROW]
[ROW][C]43[/C][C]-0.127047[/C][C]-1.078[/C][C]0.14231[/C][/ROW]
[ROW][C]44[/C][C]-0.062057[/C][C]-0.5266[/C][C]0.300056[/C][/ROW]
[ROW][C]45[/C][C]0.120922[/C][C]1.0261[/C][C]0.15415[/C][/ROW]
[ROW][C]46[/C][C]0.248223[/C][C]2.1062[/C][C]0.019335[/C][/ROW]
[ROW][C]47[/C][C]0.225406[/C][C]1.9126[/C][C]0.029886[/C][/ROW]
[ROW][C]48[/C][C]0.243332[/C][C]2.0647[/C][C]0.021275[/C][/ROW]
[/TABLE]
Source: https://freestatistics.org/blog/index.php?pk=120462&T=1

Globally Unique Identifier (entire table): ba.freestatistics.org/blog/index.php?pk=120462&T=1

As an alternative you can also use a QR Code:  

The GUIDs for individual cells are displayed in the table below:

Autocorrelation Function
Time lag kACF(k)T-STATP-value
10.4522053.83710.000132
20.3041422.58070.005949
3-0.042025-0.35660.361218
4-0.322357-2.73530.003921
5-0.443856-3.76620.000168
6-0.520568-4.41721.7e-05
7-0.424598-3.60280.000288
8-0.31801-2.69840.004337
90.0483520.41030.34141
100.2200541.86720.032971
110.3478952.9520.00213
120.6360585.39710
130.3306682.80580.003225
140.1897361.610.055891
15-0.096302-0.81710.208269
16-0.258116-2.19020.015875
17-0.349915-2.96910.002027
18-0.38444-3.26210.000846
19-0.347529-2.94890.002149
20-0.2147-1.82180.03632
210.0883030.74930.228067
220.29362.49130.007517
230.314832.67140.004667
240.4922574.17694.1e-05
250.195771.66120.050515
260.0785250.66630.253673
27-0.166841-1.41570.080589
28-0.29277-2.48420.007655
29-0.306065-2.5970.005697
30-0.297747-2.52650.00686
31-0.187124-1.58780.058357
32-0.146254-1.2410.109316
330.142921.21270.114601
340.2663262.25990.013428
350.2609672.21440.014985
360.360273.0570.001568
370.1406671.19360.118277
380.0524370.44490.328848
39-0.140219-1.18980.119017
40-0.218237-1.85180.034077
41-0.261614-2.21990.014789
42-0.221914-1.8830.03187
43-0.127047-1.0780.14231
44-0.062057-0.52660.300056
450.1209221.02610.15415
460.2482232.10620.019335
470.2254061.91260.029886
480.2433322.06470.021275


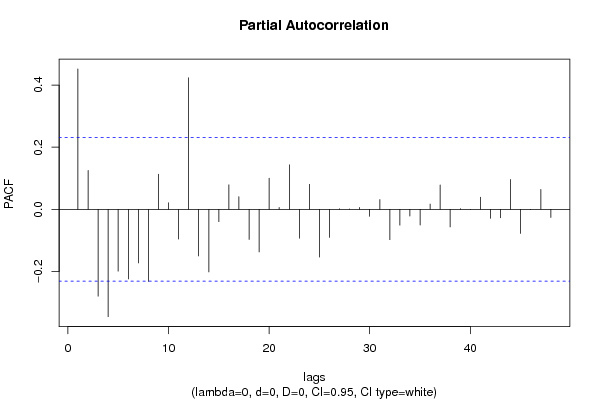
Partial Autocorrelation Function
Time lag kPACF(k)T-STATP-value
10.4522053.83710.000132
20.1252691.06290.14568
3-0.279656-2.3730.010159
4-0.345728-2.93360.002246
5-0.199462-1.69250.047438
6-0.224168-1.90210.030577
7-0.172621-1.46470.073673
8-0.232144-1.96980.026354
90.1132290.96080.169938
100.0208670.17710.42998
11-0.095917-0.81390.209197
120.4236823.59510.000295
13-0.150072-1.27340.103486
14-0.201645-1.7110.045692
15-0.040019-0.33960.367584
160.0790220.67050.252334
170.0408610.34670.364909
18-0.09702-0.82320.206546
19-0.137439-1.16620.123689
200.1001880.85010.199036
210.0062490.0530.478929
220.1433461.21630.113916
23-0.093186-0.79070.215854
240.0805630.68360.248212
25-0.153908-1.3060.097862
26-0.090615-0.76890.222234
270.0015640.01330.494724
280.0013930.01180.495302
290.0061750.05240.479178
30-0.022539-0.19130.424433
310.0315780.26790.394752
32-0.097735-0.82930.204836
33-0.051183-0.43430.332685
34-0.021749-0.18450.427051
35-0.050596-0.42930.334485
360.017010.14430.442819
370.0784890.6660.253769
38-0.056535-0.47970.316441
390.0021770.01850.492657
40-0.000157-0.00130.499469
410.0392990.33350.369878
42-0.028852-0.24480.403647
43-0.027492-0.23330.408103
440.0962530.81670.208388
45-0.077635-0.65880.256077
46-0.000875-0.00740.497048
470.0640890.54380.294124
48-0.02604-0.2210.412876

\begin{tabular}{lllllllll}
\hline
Partial Autocorrelation Function \tabularnewline
Time lag k & PACF(k) & T-STAT & P-value \tabularnewline
1 & 0.452205 & 3.8371 & 0.000132 \tabularnewline
2 & 0.125269 & 1.0629 & 0.14568 \tabularnewline
3 & -0.279656 & -2.373 & 0.010159 \tabularnewline
4 & -0.345728 & -2.9336 & 0.002246 \tabularnewline
5 & -0.199462 & -1.6925 & 0.047438 \tabularnewline
6 & -0.224168 & -1.9021 & 0.030577 \tabularnewline
7 & -0.172621 & -1.4647 & 0.073673 \tabularnewline
8 & -0.232144 & -1.9698 & 0.026354 \tabularnewline
9 & 0.113229 & 0.9608 & 0.169938 \tabularnewline
10 & 0.020867 & 0.1771 & 0.42998 \tabularnewline
11 & -0.095917 & -0.8139 & 0.209197 \tabularnewline
12 & 0.423682 & 3.5951 & 0.000295 \tabularnewline
13 & -0.150072 & -1.2734 & 0.103486 \tabularnewline
14 & -0.201645 & -1.711 & 0.045692 \tabularnewline
15 & -0.040019 & -0.3396 & 0.367584 \tabularnewline
16 & 0.079022 & 0.6705 & 0.252334 \tabularnewline
17 & 0.040861 & 0.3467 & 0.364909 \tabularnewline
18 & -0.09702 & -0.8232 & 0.206546 \tabularnewline
19 & -0.137439 & -1.1662 & 0.123689 \tabularnewline
20 & 0.100188 & 0.8501 & 0.199036 \tabularnewline
21 & 0.006249 & 0.053 & 0.478929 \tabularnewline
22 & 0.143346 & 1.2163 & 0.113916 \tabularnewline
23 & -0.093186 & -0.7907 & 0.215854 \tabularnewline
24 & 0.080563 & 0.6836 & 0.248212 \tabularnewline
25 & -0.153908 & -1.306 & 0.097862 \tabularnewline
26 & -0.090615 & -0.7689 & 0.222234 \tabularnewline
27 & 0.001564 & 0.0133 & 0.494724 \tabularnewline
28 & 0.001393 & 0.0118 & 0.495302 \tabularnewline
29 & 0.006175 & 0.0524 & 0.479178 \tabularnewline
30 & -0.022539 & -0.1913 & 0.424433 \tabularnewline
31 & 0.031578 & 0.2679 & 0.394752 \tabularnewline
32 & -0.097735 & -0.8293 & 0.204836 \tabularnewline
33 & -0.051183 & -0.4343 & 0.332685 \tabularnewline
34 & -0.021749 & -0.1845 & 0.427051 \tabularnewline
35 & -0.050596 & -0.4293 & 0.334485 \tabularnewline
36 & 0.01701 & 0.1443 & 0.442819 \tabularnewline
37 & 0.078489 & 0.666 & 0.253769 \tabularnewline
38 & -0.056535 & -0.4797 & 0.316441 \tabularnewline
39 & 0.002177 & 0.0185 & 0.492657 \tabularnewline
40 & -0.000157 & -0.0013 & 0.499469 \tabularnewline
41 & 0.039299 & 0.3335 & 0.369878 \tabularnewline
42 & -0.028852 & -0.2448 & 0.403647 \tabularnewline
43 & -0.027492 & -0.2333 & 0.408103 \tabularnewline
44 & 0.096253 & 0.8167 & 0.208388 \tabularnewline
45 & -0.077635 & -0.6588 & 0.256077 \tabularnewline
46 & -0.000875 & -0.0074 & 0.497048 \tabularnewline
47 & 0.064089 & 0.5438 & 0.294124 \tabularnewline
48 & -0.02604 & -0.221 & 0.412876 \tabularnewline
\hline
\end{tabular}
%Source: https://freestatistics.org/blog/index.php?pk=120462&T=2

[TABLE]
[ROW][C]Partial Autocorrelation Function[/C][/ROW]
[ROW][C]Time lag k[/C][C]PACF(k)[/C][C]T-STAT[/C][C]P-value[/C][/ROW]
[ROW][C]1[/C][C]0.452205[/C][C]3.8371[/C][C]0.000132[/C][/ROW]
[ROW][C]2[/C][C]0.125269[/C][C]1.0629[/C][C]0.14568[/C][/ROW]
[ROW][C]3[/C][C]-0.279656[/C][C]-2.373[/C][C]0.010159[/C][/ROW]
[ROW][C]4[/C][C]-0.345728[/C][C]-2.9336[/C][C]0.002246[/C][/ROW]
[ROW][C]5[/C][C]-0.199462[/C][C]-1.6925[/C][C]0.047438[/C][/ROW]
[ROW][C]6[/C][C]-0.224168[/C][C]-1.9021[/C][C]0.030577[/C][/ROW]
[ROW][C]7[/C][C]-0.172621[/C][C]-1.4647[/C][C]0.073673[/C][/ROW]
[ROW][C]8[/C][C]-0.232144[/C][C]-1.9698[/C][C]0.026354[/C][/ROW]
[ROW][C]9[/C][C]0.113229[/C][C]0.9608[/C][C]0.169938[/C][/ROW]
[ROW][C]10[/C][C]0.020867[/C][C]0.1771[/C][C]0.42998[/C][/ROW]
[ROW][C]11[/C][C]-0.095917[/C][C]-0.8139[/C][C]0.209197[/C][/ROW]
[ROW][C]12[/C][C]0.423682[/C][C]3.5951[/C][C]0.000295[/C][/ROW]
[ROW][C]13[/C][C]-0.150072[/C][C]-1.2734[/C][C]0.103486[/C][/ROW]
[ROW][C]14[/C][C]-0.201645[/C][C]-1.711[/C][C]0.045692[/C][/ROW]
[ROW][C]15[/C][C]-0.040019[/C][C]-0.3396[/C][C]0.367584[/C][/ROW]
[ROW][C]16[/C][C]0.079022[/C][C]0.6705[/C][C]0.252334[/C][/ROW]
[ROW][C]17[/C][C]0.040861[/C][C]0.3467[/C][C]0.364909[/C][/ROW]
[ROW][C]18[/C][C]-0.09702[/C][C]-0.8232[/C][C]0.206546[/C][/ROW]
[ROW][C]19[/C][C]-0.137439[/C][C]-1.1662[/C][C]0.123689[/C][/ROW]
[ROW][C]20[/C][C]0.100188[/C][C]0.8501[/C][C]0.199036[/C][/ROW]
[ROW][C]21[/C][C]0.006249[/C][C]0.053[/C][C]0.478929[/C][/ROW]
[ROW][C]22[/C][C]0.143346[/C][C]1.2163[/C][C]0.113916[/C][/ROW]
[ROW][C]23[/C][C]-0.093186[/C][C]-0.7907[/C][C]0.215854[/C][/ROW]
[ROW][C]24[/C][C]0.080563[/C][C]0.6836[/C][C]0.248212[/C][/ROW]
[ROW][C]25[/C][C]-0.153908[/C][C]-1.306[/C][C]0.097862[/C][/ROW]
[ROW][C]26[/C][C]-0.090615[/C][C]-0.7689[/C][C]0.222234[/C][/ROW]
[ROW][C]27[/C][C]0.001564[/C][C]0.0133[/C][C]0.494724[/C][/ROW]
[ROW][C]28[/C][C]0.001393[/C][C]0.0118[/C][C]0.495302[/C][/ROW]
[ROW][C]29[/C][C]0.006175[/C][C]0.0524[/C][C]0.479178[/C][/ROW]
[ROW][C]30[/C][C]-0.022539[/C][C]-0.1913[/C][C]0.424433[/C][/ROW]
[ROW][C]31[/C][C]0.031578[/C][C]0.2679[/C][C]0.394752[/C][/ROW]
[ROW][C]32[/C][C]-0.097735[/C][C]-0.8293[/C][C]0.204836[/C][/ROW]
[ROW][C]33[/C][C]-0.051183[/C][C]-0.4343[/C][C]0.332685[/C][/ROW]
[ROW][C]34[/C][C]-0.021749[/C][C]-0.1845[/C][C]0.427051[/C][/ROW]
[ROW][C]35[/C][C]-0.050596[/C][C]-0.4293[/C][C]0.334485[/C][/ROW]
[ROW][C]36[/C][C]0.01701[/C][C]0.1443[/C][C]0.442819[/C][/ROW]
[ROW][C]37[/C][C]0.078489[/C][C]0.666[/C][C]0.253769[/C][/ROW]
[ROW][C]38[/C][C]-0.056535[/C][C]-0.4797[/C][C]0.316441[/C][/ROW]
[ROW][C]39[/C][C]0.002177[/C][C]0.0185[/C][C]0.492657[/C][/ROW]
[ROW][C]40[/C][C]-0.000157[/C][C]-0.0013[/C][C]0.499469[/C][/ROW]
[ROW][C]41[/C][C]0.039299[/C][C]0.3335[/C][C]0.369878[/C][/ROW]
[ROW][C]42[/C][C]-0.028852[/C][C]-0.2448[/C][C]0.403647[/C][/ROW]
[ROW][C]43[/C][C]-0.027492[/C][C]-0.2333[/C][C]0.408103[/C][/ROW]
[ROW][C]44[/C][C]0.096253[/C][C]0.8167[/C][C]0.208388[/C][/ROW]
[ROW][C]45[/C][C]-0.077635[/C][C]-0.6588[/C][C]0.256077[/C][/ROW]
[ROW][C]46[/C][C]-0.000875[/C][C]-0.0074[/C][C]0.497048[/C][/ROW]
[ROW][C]47[/C][C]0.064089[/C][C]0.5438[/C][C]0.294124[/C][/ROW]
[ROW][C]48[/C][C]-0.02604[/C][C]-0.221[/C][C]0.412876[/C][/ROW]
[/TABLE]
Source: https://freestatistics.org/blog/index.php?pk=120462&T=2

Globally Unique Identifier (entire table): ba.freestatistics.org/blog/index.php?pk=120462&T=2

As an alternative you can also use a QR Code:  

The GUIDs for individual cells are displayed in the table below:

Partial Autocorrelation Function
Time lag kPACF(k)T-STATP-value
10.4522053.83710.000132
20.1252691.06290.14568
3-0.279656-2.3730.010159
4-0.345728-2.93360.002246
5-0.199462-1.69250.047438
6-0.224168-1.90210.030577
7-0.172621-1.46470.073673
8-0.232144-1.96980.026354
90.1132290.96080.169938
100.0208670.17710.42998
11-0.095917-0.81390.209197
120.4236823.59510.000295
13-0.150072-1.27340.103486
14-0.201645-1.7110.045692
15-0.040019-0.33960.367584
160.0790220.67050.252334
170.0408610.34670.364909
18-0.09702-0.82320.206546
19-0.137439-1.16620.123689
200.1001880.85010.199036
210.0062490.0530.478929
220.1433461.21630.113916
23-0.093186-0.79070.215854
240.0805630.68360.248212
25-0.153908-1.3060.097862
26-0.090615-0.76890.222234
270.0015640.01330.494724
280.0013930.01180.495302
290.0061750.05240.479178
30-0.022539-0.19130.424433
310.0315780.26790.394752
32-0.097735-0.82930.204836
33-0.051183-0.43430.332685
34-0.021749-0.18450.427051
35-0.050596-0.42930.334485
360.017010.14430.442819
370.0784890.6660.253769
38-0.056535-0.47970.316441
390.0021770.01850.492657
40-0.000157-0.00130.499469
410.0392990.33350.369878
42-0.028852-0.24480.403647
43-0.027492-0.23330.408103
440.0962530.81670.208388
45-0.077635-0.65880.256077
46-0.000875-0.00740.497048
470.0640890.54380.294124
48-0.02604-0.2210.412876


Parameters (Session):
par1 = 48 ; par2 = 0.0 ; par3 = 0 ; par4 = 0 ; par5 = 12 ; par6 = White Noise ; par7 = 0.95 ;
Parameters (R input):
par1 = 48 ; par2 = 0.0 ; par3 = 0 ; par4 = 0 ; par5 = 12 ; par6 = White Noise ; par7 = 0.95 ; par8 = ;
R code (references can be found in the software module):
if (par1 == 'Default') {
par1 = 10*log10(length(x))
} else {
par1 <- as.numeric(par1)
}
par2 <- as.numeric(par2)
par3 <- as.numeric(par3)
par4 <- as.numeric(par4)
par5 <- as.numeric(par5)
if (par6 == 'White Noise') par6 <- 'white' else par6 <- 'ma'
par7 <- as.numeric(par7)
if (par8 != '') par8 <- as.numeric(par8)
ox <- x
if (par8 == '') {
if (par2 == 0) {
x <- log(x)
} else {
x <- (x ^ par2 - 1) / par2
}
} else {
x <- log(x,base=par8)
}
if (par3 > 0) x <- diff(x,lag=1,difference=par3)
if (par4 > 0) x <- diff(x,lag=par5,difference=par4)
bitmap(file='picts.png')
op <- par(mfrow=c(2,1))
plot(ox,type='l',main='Original Time Series',xlab='time',ylab='value')
if (par8=='') {
mytitle <- paste('Working Time Series (lambda=',par2,', d=',par3,', D=',par4,')',sep='')
mysub <- paste('(lambda=',par2,', d=',par3,', D=',par4,', CI=', par7, ', CI type=',par6,')',sep='')
} else {
mytitle <- paste('Working Time Series (base=',par8,', d=',par3,', D=',par4,')',sep='')
mysub <- paste('(base=',par8,', d=',par3,', D=',par4,', CI=', par7, ', CI type=',par6,')',sep='')
}
plot(x,type='l', main=mytitle,xlab='time',ylab='value')
par(op)
dev.off()
bitmap(file='pic1.png')
racf <- acf(x, par1, main='Autocorrelation', xlab='time lag', ylab='ACF', ci.type=par6, ci=par7, sub=mysub)
dev.off()
bitmap(file='pic2.png')
rpacf <- pacf(x,par1,main='Partial Autocorrelation',xlab='lags',ylab='PACF',sub=mysub)
dev.off()
(myacf <- c(racf$acf))
(mypacf <- c(rpacf$acf))
lengthx <- length(x)
sqrtn <- sqrt(lengthx)
load(file='createtable')
a<-table.start()
a<-table.row.start(a)
a<-table.element(a,'Autocorrelation Function',4,TRUE)
a<-table.row.end(a)
a<-table.row.start(a)
a<-table.element(a,'Time lag k',header=TRUE)
a<-table.element(a,hyperlink('basics.htm','ACF(k)','click here for more information about the Autocorrelation Function'),header=TRUE)
a<-table.element(a,'T-STAT',header=TRUE)
a<-table.element(a,'P-value',header=TRUE)
a<-table.row.end(a)
for (i in 2:(par1+1)) {
a<-table.row.start(a)
a<-table.element(a,i-1,header=TRUE)
a<-table.element(a,round(myacf[i],6))
mytstat <- myacf[i]*sqrtn
a<-table.element(a,round(mytstat,4))
a<-table.element(a,round(1-pt(abs(mytstat),lengthx),6))
a<-table.row.end(a)
}
a<-table.end(a)
table.save(a,file='mytable.tab')
a<-table.start()
a<-table.row.start(a)
a<-table.element(a,'Partial Autocorrelation Function',4,TRUE)
a<-table.row.end(a)
a<-table.row.start(a)
a<-table.element(a,'Time lag k',header=TRUE)
a<-table.element(a,hyperlink('basics.htm','PACF(k)','click here for more information about the Partial Autocorrelation Function'),header=TRUE)
a<-table.element(a,'T-STAT',header=TRUE)
a<-table.element(a,'P-value',header=TRUE)
a<-table.row.end(a)
for (i in 1:par1) {
a<-table.row.start(a)
a<-table.element(a,i,header=TRUE)
a<-table.element(a,round(mypacf[i],6))
mytstat <- mypacf[i]*sqrtn
a<-table.element(a,round(mytstat,4))
a<-table.element(a,round(1-pt(abs(mytstat),lengthx),6))
a<-table.row.end(a)
}
a<-table.end(a)
table.save(a,file='mytable1.tab')