Free Statistics

of Irreproducible Research!

Author's title

Author*Unverified author*
R Software Modulerwasp_autocorrelation.wasp
Title produced by software(Partial) Autocorrelation Function
Date of computationMon, 11 Apr 2011 13:20:00 +0000
Cite this page as followsStatistical Computations at FreeStatistics.org, Office for Research Development and Education, URL https://freestatistics.org/blog/index.php?v=date/2011/Apr/11/t1302527833s9w63bvx6q0s7tc.htm/, Retrieved Thu, 09 May 2024 10:27:38 +0000
Statistical Computations at FreeStatistics.org, Office for Research Development and Education, URL https://freestatistics.org/blog/index.php?pk=120459, Retrieved Thu, 09 May 2024 10:27:38 +0000
QR Codes:

Original text written by user:
IsPrivate?No (this computation is public)
User-defined keywords
Estimated Impact143
Family? (F = Feedback message, R = changed R code, M = changed R Module, P = changed Parameters, D = changed Data)
-       [(Partial) Autocorrelation Function] [Jonas Cloots, geb...] [2011-04-11 13:20:00] [e414a1f4d0a08e5011052e6ef0a3e93e] [Current]
Feedback Forum

Post a new message
Dataseries X:
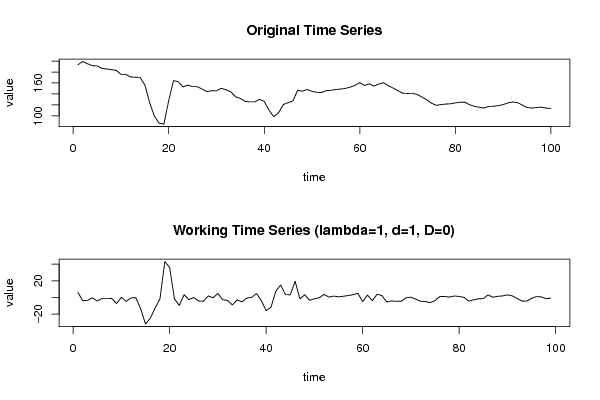
193.230
199.068
195.076
191.563
191.067
186.665
185.508
184.371
183.046
175.714
175.768
171.029
170.465
170.102
156.389
124.291
99.360
86.675
85.056
128.236
164.257
162.401
152.779
156.005
153.387
153.190
148.840
144.211
145.953
145.542
150.271
147.489
143.824
134.754
131.736
126.304
125.511
125.495
130.133
126.257
110.323
98.417
105.749
120.665
124.075
127.245
146.731
144.979
148.210
144.670
142.970
142.524
146.142
146.522
148.128
148.798
150.181
152.388
155.694
160.662
155.520
158.262
154.338
158.196
160.371
154.856
150.636
145.899
141.242
140.834
141.119
139.104
134.437
129.425
123.155
119.273
120.472
121.523
121.983
123.658
124.794
124.827
120.382
117.395
115.790
114.283
117.271
117.448
118.764
120.550
123.554
125.412
124.182
119.828
115.361
114.226
115.214
115.864
114.276
113.469


Summary of computational transaction
Raw Inputview raw input (R code)
Raw Outputview raw output of R engine
Computing time1 seconds
R Server'Herman Ole Andreas Wold' @ www.yougetit.org

\begin{tabular}{lllllllll}
\hline
Summary of computational transaction \tabularnewline
Raw Input & view raw input (R code)  \tabularnewline
Raw Output & view raw output of R engine  \tabularnewline
Computing time & 1 seconds \tabularnewline
R Server & 'Herman Ole Andreas Wold' @ www.yougetit.org \tabularnewline
\hline
\end{tabular}
%Source: https://freestatistics.org/blog/index.php?pk=120459&T=0

[TABLE]
[ROW][C]Summary of computational transaction[/C][/ROW]
[ROW][C]Raw Input[/C][C]view raw input (R code) [/C][/ROW]
[ROW][C]Raw Output[/C][C]view raw output of R engine [/C][/ROW]
[ROW][C]Computing time[/C][C]1 seconds[/C][/ROW]
[ROW][C]R Server[/C][C]'Herman Ole Andreas Wold' @ www.yougetit.org[/C][/ROW]
[/TABLE]
Source: https://freestatistics.org/blog/index.php?pk=120459&T=0

Globally Unique Identifier (entire table): ba.freestatistics.org/blog/index.php?pk=120459&T=0

As an alternative you can also use a QR Code:  

The GUIDs for individual cells are displayed in the table below:

Summary of computational transaction
Raw Inputview raw input (R code)
Raw Outputview raw output of R engine
Computing time1 seconds
R Server'Herman Ole Andreas Wold' @ www.yougetit.org


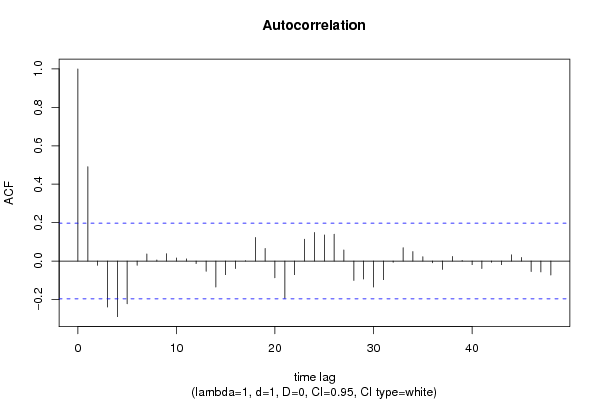
Autocorrelation Function
Time lag kACF(k)T-STATP-value
10.4914344.88972e-06
2-0.021601-0.21490.415134
3-0.238656-2.37460.009748
4-0.289226-2.87780.002453
5-0.221704-2.20590.014851
6-0.021704-0.2160.414736
70.0366340.36450.358129
80.005310.05280.478986
90.0380540.37860.352886
100.0162530.16170.43593
110.011330.11270.455236
12-0.013099-0.13030.448283
13-0.052589-0.52330.300984
14-0.13493-1.34250.091247
15-0.070541-0.70190.242202
16-0.038874-0.38680.349872
170.0018050.0180.492854
180.1224371.21820.113015
190.0651520.64830.25916
20-0.08687-0.86430.194743
21-0.193737-1.92770.028381
22-0.070722-0.70370.241642
230.113631.13060.130476
240.1488581.48110.070875
250.1356891.35010.090034
260.1394131.38710.084256
270.0574610.57170.284401
28-0.100611-1.00110.159617
29-0.09327-0.9280.177827
30-0.134766-1.34090.091509
31-0.096621-0.96140.169356
32-0.006211-0.06180.475423
330.0690620.68720.246794
340.0493870.49140.312118
350.0229780.22860.409813
36-0.008553-0.08510.466174
37-0.043118-0.4290.334422
380.0235960.23480.407434
390.0030020.02990.488117
40-0.018532-0.18440.427043
41-0.039081-0.38880.349111
42-0.006567-0.06530.474017
43-0.018497-0.1840.427178
440.032490.32330.373586
450.018270.18180.428063
46-0.05411-0.53840.295757
47-0.056215-0.55930.288599
48-0.072055-0.71690.237551

\begin{tabular}{lllllllll}
\hline
Autocorrelation Function \tabularnewline
Time lag k & ACF(k) & T-STAT & P-value \tabularnewline
1 & 0.491434 & 4.8897 & 2e-06 \tabularnewline
2 & -0.021601 & -0.2149 & 0.415134 \tabularnewline
3 & -0.238656 & -2.3746 & 0.009748 \tabularnewline
4 & -0.289226 & -2.8778 & 0.002453 \tabularnewline
5 & -0.221704 & -2.2059 & 0.014851 \tabularnewline
6 & -0.021704 & -0.216 & 0.414736 \tabularnewline
7 & 0.036634 & 0.3645 & 0.358129 \tabularnewline
8 & 0.00531 & 0.0528 & 0.478986 \tabularnewline
9 & 0.038054 & 0.3786 & 0.352886 \tabularnewline
10 & 0.016253 & 0.1617 & 0.43593 \tabularnewline
11 & 0.01133 & 0.1127 & 0.455236 \tabularnewline
12 & -0.013099 & -0.1303 & 0.448283 \tabularnewline
13 & -0.052589 & -0.5233 & 0.300984 \tabularnewline
14 & -0.13493 & -1.3425 & 0.091247 \tabularnewline
15 & -0.070541 & -0.7019 & 0.242202 \tabularnewline
16 & -0.038874 & -0.3868 & 0.349872 \tabularnewline
17 & 0.001805 & 0.018 & 0.492854 \tabularnewline
18 & 0.122437 & 1.2182 & 0.113015 \tabularnewline
19 & 0.065152 & 0.6483 & 0.25916 \tabularnewline
20 & -0.08687 & -0.8643 & 0.194743 \tabularnewline
21 & -0.193737 & -1.9277 & 0.028381 \tabularnewline
22 & -0.070722 & -0.7037 & 0.241642 \tabularnewline
23 & 0.11363 & 1.1306 & 0.130476 \tabularnewline
24 & 0.148858 & 1.4811 & 0.070875 \tabularnewline
25 & 0.135689 & 1.3501 & 0.090034 \tabularnewline
26 & 0.139413 & 1.3871 & 0.084256 \tabularnewline
27 & 0.057461 & 0.5717 & 0.284401 \tabularnewline
28 & -0.100611 & -1.0011 & 0.159617 \tabularnewline
29 & -0.09327 & -0.928 & 0.177827 \tabularnewline
30 & -0.134766 & -1.3409 & 0.091509 \tabularnewline
31 & -0.096621 & -0.9614 & 0.169356 \tabularnewline
32 & -0.006211 & -0.0618 & 0.475423 \tabularnewline
33 & 0.069062 & 0.6872 & 0.246794 \tabularnewline
34 & 0.049387 & 0.4914 & 0.312118 \tabularnewline
35 & 0.022978 & 0.2286 & 0.409813 \tabularnewline
36 & -0.008553 & -0.0851 & 0.466174 \tabularnewline
37 & -0.043118 & -0.429 & 0.334422 \tabularnewline
38 & 0.023596 & 0.2348 & 0.407434 \tabularnewline
39 & 0.003002 & 0.0299 & 0.488117 \tabularnewline
40 & -0.018532 & -0.1844 & 0.427043 \tabularnewline
41 & -0.039081 & -0.3888 & 0.349111 \tabularnewline
42 & -0.006567 & -0.0653 & 0.474017 \tabularnewline
43 & -0.018497 & -0.184 & 0.427178 \tabularnewline
44 & 0.03249 & 0.3233 & 0.373586 \tabularnewline
45 & 0.01827 & 0.1818 & 0.428063 \tabularnewline
46 & -0.05411 & -0.5384 & 0.295757 \tabularnewline
47 & -0.056215 & -0.5593 & 0.288599 \tabularnewline
48 & -0.072055 & -0.7169 & 0.237551 \tabularnewline
\hline
\end{tabular}
%Source: https://freestatistics.org/blog/index.php?pk=120459&T=1

[TABLE]
[ROW][C]Autocorrelation Function[/C][/ROW]
[ROW][C]Time lag k[/C][C]ACF(k)[/C][C]T-STAT[/C][C]P-value[/C][/ROW]
[ROW][C]1[/C][C]0.491434[/C][C]4.8897[/C][C]2e-06[/C][/ROW]
[ROW][C]2[/C][C]-0.021601[/C][C]-0.2149[/C][C]0.415134[/C][/ROW]
[ROW][C]3[/C][C]-0.238656[/C][C]-2.3746[/C][C]0.009748[/C][/ROW]
[ROW][C]4[/C][C]-0.289226[/C][C]-2.8778[/C][C]0.002453[/C][/ROW]
[ROW][C]5[/C][C]-0.221704[/C][C]-2.2059[/C][C]0.014851[/C][/ROW]
[ROW][C]6[/C][C]-0.021704[/C][C]-0.216[/C][C]0.414736[/C][/ROW]
[ROW][C]7[/C][C]0.036634[/C][C]0.3645[/C][C]0.358129[/C][/ROW]
[ROW][C]8[/C][C]0.00531[/C][C]0.0528[/C][C]0.478986[/C][/ROW]
[ROW][C]9[/C][C]0.038054[/C][C]0.3786[/C][C]0.352886[/C][/ROW]
[ROW][C]10[/C][C]0.016253[/C][C]0.1617[/C][C]0.43593[/C][/ROW]
[ROW][C]11[/C][C]0.01133[/C][C]0.1127[/C][C]0.455236[/C][/ROW]
[ROW][C]12[/C][C]-0.013099[/C][C]-0.1303[/C][C]0.448283[/C][/ROW]
[ROW][C]13[/C][C]-0.052589[/C][C]-0.5233[/C][C]0.300984[/C][/ROW]
[ROW][C]14[/C][C]-0.13493[/C][C]-1.3425[/C][C]0.091247[/C][/ROW]
[ROW][C]15[/C][C]-0.070541[/C][C]-0.7019[/C][C]0.242202[/C][/ROW]
[ROW][C]16[/C][C]-0.038874[/C][C]-0.3868[/C][C]0.349872[/C][/ROW]
[ROW][C]17[/C][C]0.001805[/C][C]0.018[/C][C]0.492854[/C][/ROW]
[ROW][C]18[/C][C]0.122437[/C][C]1.2182[/C][C]0.113015[/C][/ROW]
[ROW][C]19[/C][C]0.065152[/C][C]0.6483[/C][C]0.25916[/C][/ROW]
[ROW][C]20[/C][C]-0.08687[/C][C]-0.8643[/C][C]0.194743[/C][/ROW]
[ROW][C]21[/C][C]-0.193737[/C][C]-1.9277[/C][C]0.028381[/C][/ROW]
[ROW][C]22[/C][C]-0.070722[/C][C]-0.7037[/C][C]0.241642[/C][/ROW]
[ROW][C]23[/C][C]0.11363[/C][C]1.1306[/C][C]0.130476[/C][/ROW]
[ROW][C]24[/C][C]0.148858[/C][C]1.4811[/C][C]0.070875[/C][/ROW]
[ROW][C]25[/C][C]0.135689[/C][C]1.3501[/C][C]0.090034[/C][/ROW]
[ROW][C]26[/C][C]0.139413[/C][C]1.3871[/C][C]0.084256[/C][/ROW]
[ROW][C]27[/C][C]0.057461[/C][C]0.5717[/C][C]0.284401[/C][/ROW]
[ROW][C]28[/C][C]-0.100611[/C][C]-1.0011[/C][C]0.159617[/C][/ROW]
[ROW][C]29[/C][C]-0.09327[/C][C]-0.928[/C][C]0.177827[/C][/ROW]
[ROW][C]30[/C][C]-0.134766[/C][C]-1.3409[/C][C]0.091509[/C][/ROW]
[ROW][C]31[/C][C]-0.096621[/C][C]-0.9614[/C][C]0.169356[/C][/ROW]
[ROW][C]32[/C][C]-0.006211[/C][C]-0.0618[/C][C]0.475423[/C][/ROW]
[ROW][C]33[/C][C]0.069062[/C][C]0.6872[/C][C]0.246794[/C][/ROW]
[ROW][C]34[/C][C]0.049387[/C][C]0.4914[/C][C]0.312118[/C][/ROW]
[ROW][C]35[/C][C]0.022978[/C][C]0.2286[/C][C]0.409813[/C][/ROW]
[ROW][C]36[/C][C]-0.008553[/C][C]-0.0851[/C][C]0.466174[/C][/ROW]
[ROW][C]37[/C][C]-0.043118[/C][C]-0.429[/C][C]0.334422[/C][/ROW]
[ROW][C]38[/C][C]0.023596[/C][C]0.2348[/C][C]0.407434[/C][/ROW]
[ROW][C]39[/C][C]0.003002[/C][C]0.0299[/C][C]0.488117[/C][/ROW]
[ROW][C]40[/C][C]-0.018532[/C][C]-0.1844[/C][C]0.427043[/C][/ROW]
[ROW][C]41[/C][C]-0.039081[/C][C]-0.3888[/C][C]0.349111[/C][/ROW]
[ROW][C]42[/C][C]-0.006567[/C][C]-0.0653[/C][C]0.474017[/C][/ROW]
[ROW][C]43[/C][C]-0.018497[/C][C]-0.184[/C][C]0.427178[/C][/ROW]
[ROW][C]44[/C][C]0.03249[/C][C]0.3233[/C][C]0.373586[/C][/ROW]
[ROW][C]45[/C][C]0.01827[/C][C]0.1818[/C][C]0.428063[/C][/ROW]
[ROW][C]46[/C][C]-0.05411[/C][C]-0.5384[/C][C]0.295757[/C][/ROW]
[ROW][C]47[/C][C]-0.056215[/C][C]-0.5593[/C][C]0.288599[/C][/ROW]
[ROW][C]48[/C][C]-0.072055[/C][C]-0.7169[/C][C]0.237551[/C][/ROW]
[/TABLE]
Source: https://freestatistics.org/blog/index.php?pk=120459&T=1

Globally Unique Identifier (entire table): ba.freestatistics.org/blog/index.php?pk=120459&T=1

As an alternative you can also use a QR Code:  

The GUIDs for individual cells are displayed in the table below:

Autocorrelation Function
Time lag kACF(k)T-STATP-value
10.4914344.88972e-06
2-0.021601-0.21490.415134
3-0.238656-2.37460.009748
4-0.289226-2.87780.002453
5-0.221704-2.20590.014851
6-0.021704-0.2160.414736
70.0366340.36450.358129
80.005310.05280.478986
90.0380540.37860.352886
100.0162530.16170.43593
110.011330.11270.455236
12-0.013099-0.13030.448283
13-0.052589-0.52330.300984
14-0.13493-1.34250.091247
15-0.070541-0.70190.242202
16-0.038874-0.38680.349872
170.0018050.0180.492854
180.1224371.21820.113015
190.0651520.64830.25916
20-0.08687-0.86430.194743
21-0.193737-1.92770.028381
22-0.070722-0.70370.241642
230.113631.13060.130476
240.1488581.48110.070875
250.1356891.35010.090034
260.1394131.38710.084256
270.0574610.57170.284401
28-0.100611-1.00110.159617
29-0.09327-0.9280.177827
30-0.134766-1.34090.091509
31-0.096621-0.96140.169356
32-0.006211-0.06180.475423
330.0690620.68720.246794
340.0493870.49140.312118
350.0229780.22860.409813
36-0.008553-0.08510.466174
37-0.043118-0.4290.334422
380.0235960.23480.407434
390.0030020.02990.488117
40-0.018532-0.18440.427043
41-0.039081-0.38880.349111
42-0.006567-0.06530.474017
43-0.018497-0.1840.427178
440.032490.32330.373586
450.018270.18180.428063
46-0.05411-0.53840.295757
47-0.056215-0.55930.288599
48-0.072055-0.71690.237551


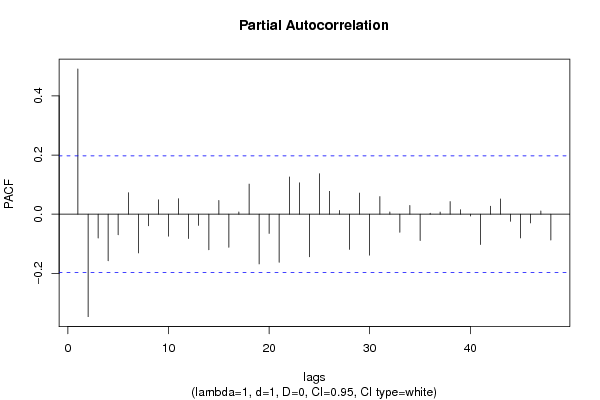
Partial Autocorrelation Function
Time lag kPACF(k)T-STATP-value
10.4914344.88972e-06
2-0.346883-3.45140.000411
3-0.080765-0.80360.211777
4-0.157787-1.570.059808
5-0.069886-0.69540.24423
60.0722890.71930.236835
7-0.131048-1.30390.097643
8-0.039096-0.3890.349056
90.0483950.48150.315603
10-0.074399-0.74030.230446
110.0524390.52180.301502
12-0.082382-0.81970.207181
13-0.037954-0.37760.353252
14-0.120234-1.19630.117216
150.0464220.46190.322586
16-0.111755-1.11190.134427
170.007520.07480.470254
180.1016821.01170.157068
19-0.168376-1.67530.048514
20-0.065004-0.64680.259634
21-0.162549-1.61730.054493
220.125671.25040.10705
230.1059121.05380.147267
24-0.143932-1.43210.077632
250.136841.36150.088218
260.0771020.76720.222408
270.012390.12330.45107
28-0.1193-1.1870.119029
290.071270.70910.239955
30-0.138618-1.37920.085465
310.0593910.59090.277957
320.007050.07010.472111
33-0.061501-0.61190.270993
340.0293780.29230.385333
35-0.089123-0.88680.188678
360.0032920.03280.486969
370.0068820.06850.472771
380.0424030.42190.337004
390.0151820.15110.440117
40-0.006296-0.06260.475086
41-0.10287-1.02350.154274
420.0266770.26540.395615
430.0512910.51030.305474
44-0.024246-0.24120.404932
45-0.080371-0.79970.212906
46-0.029589-0.29440.38453
470.0109190.10860.456854
48-0.087502-0.87060.193029

\begin{tabular}{lllllllll}
\hline
Partial Autocorrelation Function \tabularnewline
Time lag k & PACF(k) & T-STAT & P-value \tabularnewline
1 & 0.491434 & 4.8897 & 2e-06 \tabularnewline
2 & -0.346883 & -3.4514 & 0.000411 \tabularnewline
3 & -0.080765 & -0.8036 & 0.211777 \tabularnewline
4 & -0.157787 & -1.57 & 0.059808 \tabularnewline
5 & -0.069886 & -0.6954 & 0.24423 \tabularnewline
6 & 0.072289 & 0.7193 & 0.236835 \tabularnewline
7 & -0.131048 & -1.3039 & 0.097643 \tabularnewline
8 & -0.039096 & -0.389 & 0.349056 \tabularnewline
9 & 0.048395 & 0.4815 & 0.315603 \tabularnewline
10 & -0.074399 & -0.7403 & 0.230446 \tabularnewline
11 & 0.052439 & 0.5218 & 0.301502 \tabularnewline
12 & -0.082382 & -0.8197 & 0.207181 \tabularnewline
13 & -0.037954 & -0.3776 & 0.353252 \tabularnewline
14 & -0.120234 & -1.1963 & 0.117216 \tabularnewline
15 & 0.046422 & 0.4619 & 0.322586 \tabularnewline
16 & -0.111755 & -1.1119 & 0.134427 \tabularnewline
17 & 0.00752 & 0.0748 & 0.470254 \tabularnewline
18 & 0.101682 & 1.0117 & 0.157068 \tabularnewline
19 & -0.168376 & -1.6753 & 0.048514 \tabularnewline
20 & -0.065004 & -0.6468 & 0.259634 \tabularnewline
21 & -0.162549 & -1.6173 & 0.054493 \tabularnewline
22 & 0.12567 & 1.2504 & 0.10705 \tabularnewline
23 & 0.105912 & 1.0538 & 0.147267 \tabularnewline
24 & -0.143932 & -1.4321 & 0.077632 \tabularnewline
25 & 0.13684 & 1.3615 & 0.088218 \tabularnewline
26 & 0.077102 & 0.7672 & 0.222408 \tabularnewline
27 & 0.01239 & 0.1233 & 0.45107 \tabularnewline
28 & -0.1193 & -1.187 & 0.119029 \tabularnewline
29 & 0.07127 & 0.7091 & 0.239955 \tabularnewline
30 & -0.138618 & -1.3792 & 0.085465 \tabularnewline
31 & 0.059391 & 0.5909 & 0.277957 \tabularnewline
32 & 0.00705 & 0.0701 & 0.472111 \tabularnewline
33 & -0.061501 & -0.6119 & 0.270993 \tabularnewline
34 & 0.029378 & 0.2923 & 0.385333 \tabularnewline
35 & -0.089123 & -0.8868 & 0.188678 \tabularnewline
36 & 0.003292 & 0.0328 & 0.486969 \tabularnewline
37 & 0.006882 & 0.0685 & 0.472771 \tabularnewline
38 & 0.042403 & 0.4219 & 0.337004 \tabularnewline
39 & 0.015182 & 0.1511 & 0.440117 \tabularnewline
40 & -0.006296 & -0.0626 & 0.475086 \tabularnewline
41 & -0.10287 & -1.0235 & 0.154274 \tabularnewline
42 & 0.026677 & 0.2654 & 0.395615 \tabularnewline
43 & 0.051291 & 0.5103 & 0.305474 \tabularnewline
44 & -0.024246 & -0.2412 & 0.404932 \tabularnewline
45 & -0.080371 & -0.7997 & 0.212906 \tabularnewline
46 & -0.029589 & -0.2944 & 0.38453 \tabularnewline
47 & 0.010919 & 0.1086 & 0.456854 \tabularnewline
48 & -0.087502 & -0.8706 & 0.193029 \tabularnewline
\hline
\end{tabular}
%Source: https://freestatistics.org/blog/index.php?pk=120459&T=2

[TABLE]
[ROW][C]Partial Autocorrelation Function[/C][/ROW]
[ROW][C]Time lag k[/C][C]PACF(k)[/C][C]T-STAT[/C][C]P-value[/C][/ROW]
[ROW][C]1[/C][C]0.491434[/C][C]4.8897[/C][C]2e-06[/C][/ROW]
[ROW][C]2[/C][C]-0.346883[/C][C]-3.4514[/C][C]0.000411[/C][/ROW]
[ROW][C]3[/C][C]-0.080765[/C][C]-0.8036[/C][C]0.211777[/C][/ROW]
[ROW][C]4[/C][C]-0.157787[/C][C]-1.57[/C][C]0.059808[/C][/ROW]
[ROW][C]5[/C][C]-0.069886[/C][C]-0.6954[/C][C]0.24423[/C][/ROW]
[ROW][C]6[/C][C]0.072289[/C][C]0.7193[/C][C]0.236835[/C][/ROW]
[ROW][C]7[/C][C]-0.131048[/C][C]-1.3039[/C][C]0.097643[/C][/ROW]
[ROW][C]8[/C][C]-0.039096[/C][C]-0.389[/C][C]0.349056[/C][/ROW]
[ROW][C]9[/C][C]0.048395[/C][C]0.4815[/C][C]0.315603[/C][/ROW]
[ROW][C]10[/C][C]-0.074399[/C][C]-0.7403[/C][C]0.230446[/C][/ROW]
[ROW][C]11[/C][C]0.052439[/C][C]0.5218[/C][C]0.301502[/C][/ROW]
[ROW][C]12[/C][C]-0.082382[/C][C]-0.8197[/C][C]0.207181[/C][/ROW]
[ROW][C]13[/C][C]-0.037954[/C][C]-0.3776[/C][C]0.353252[/C][/ROW]
[ROW][C]14[/C][C]-0.120234[/C][C]-1.1963[/C][C]0.117216[/C][/ROW]
[ROW][C]15[/C][C]0.046422[/C][C]0.4619[/C][C]0.322586[/C][/ROW]
[ROW][C]16[/C][C]-0.111755[/C][C]-1.1119[/C][C]0.134427[/C][/ROW]
[ROW][C]17[/C][C]0.00752[/C][C]0.0748[/C][C]0.470254[/C][/ROW]
[ROW][C]18[/C][C]0.101682[/C][C]1.0117[/C][C]0.157068[/C][/ROW]
[ROW][C]19[/C][C]-0.168376[/C][C]-1.6753[/C][C]0.048514[/C][/ROW]
[ROW][C]20[/C][C]-0.065004[/C][C]-0.6468[/C][C]0.259634[/C][/ROW]
[ROW][C]21[/C][C]-0.162549[/C][C]-1.6173[/C][C]0.054493[/C][/ROW]
[ROW][C]22[/C][C]0.12567[/C][C]1.2504[/C][C]0.10705[/C][/ROW]
[ROW][C]23[/C][C]0.105912[/C][C]1.0538[/C][C]0.147267[/C][/ROW]
[ROW][C]24[/C][C]-0.143932[/C][C]-1.4321[/C][C]0.077632[/C][/ROW]
[ROW][C]25[/C][C]0.13684[/C][C]1.3615[/C][C]0.088218[/C][/ROW]
[ROW][C]26[/C][C]0.077102[/C][C]0.7672[/C][C]0.222408[/C][/ROW]
[ROW][C]27[/C][C]0.01239[/C][C]0.1233[/C][C]0.45107[/C][/ROW]
[ROW][C]28[/C][C]-0.1193[/C][C]-1.187[/C][C]0.119029[/C][/ROW]
[ROW][C]29[/C][C]0.07127[/C][C]0.7091[/C][C]0.239955[/C][/ROW]
[ROW][C]30[/C][C]-0.138618[/C][C]-1.3792[/C][C]0.085465[/C][/ROW]
[ROW][C]31[/C][C]0.059391[/C][C]0.5909[/C][C]0.277957[/C][/ROW]
[ROW][C]32[/C][C]0.00705[/C][C]0.0701[/C][C]0.472111[/C][/ROW]
[ROW][C]33[/C][C]-0.061501[/C][C]-0.6119[/C][C]0.270993[/C][/ROW]
[ROW][C]34[/C][C]0.029378[/C][C]0.2923[/C][C]0.385333[/C][/ROW]
[ROW][C]35[/C][C]-0.089123[/C][C]-0.8868[/C][C]0.188678[/C][/ROW]
[ROW][C]36[/C][C]0.003292[/C][C]0.0328[/C][C]0.486969[/C][/ROW]
[ROW][C]37[/C][C]0.006882[/C][C]0.0685[/C][C]0.472771[/C][/ROW]
[ROW][C]38[/C][C]0.042403[/C][C]0.4219[/C][C]0.337004[/C][/ROW]
[ROW][C]39[/C][C]0.015182[/C][C]0.1511[/C][C]0.440117[/C][/ROW]
[ROW][C]40[/C][C]-0.006296[/C][C]-0.0626[/C][C]0.475086[/C][/ROW]
[ROW][C]41[/C][C]-0.10287[/C][C]-1.0235[/C][C]0.154274[/C][/ROW]
[ROW][C]42[/C][C]0.026677[/C][C]0.2654[/C][C]0.395615[/C][/ROW]
[ROW][C]43[/C][C]0.051291[/C][C]0.5103[/C][C]0.305474[/C][/ROW]
[ROW][C]44[/C][C]-0.024246[/C][C]-0.2412[/C][C]0.404932[/C][/ROW]
[ROW][C]45[/C][C]-0.080371[/C][C]-0.7997[/C][C]0.212906[/C][/ROW]
[ROW][C]46[/C][C]-0.029589[/C][C]-0.2944[/C][C]0.38453[/C][/ROW]
[ROW][C]47[/C][C]0.010919[/C][C]0.1086[/C][C]0.456854[/C][/ROW]
[ROW][C]48[/C][C]-0.087502[/C][C]-0.8706[/C][C]0.193029[/C][/ROW]
[/TABLE]
Source: https://freestatistics.org/blog/index.php?pk=120459&T=2

Globally Unique Identifier (entire table): ba.freestatistics.org/blog/index.php?pk=120459&T=2

As an alternative you can also use a QR Code:  

The GUIDs for individual cells are displayed in the table below:

Partial Autocorrelation Function
Time lag kPACF(k)T-STATP-value
10.4914344.88972e-06
2-0.346883-3.45140.000411
3-0.080765-0.80360.211777
4-0.157787-1.570.059808
5-0.069886-0.69540.24423
60.0722890.71930.236835
7-0.131048-1.30390.097643
8-0.039096-0.3890.349056
90.0483950.48150.315603
10-0.074399-0.74030.230446
110.0524390.52180.301502
12-0.082382-0.81970.207181
13-0.037954-0.37760.353252
14-0.120234-1.19630.117216
150.0464220.46190.322586
16-0.111755-1.11190.134427
170.007520.07480.470254
180.1016821.01170.157068
19-0.168376-1.67530.048514
20-0.065004-0.64680.259634
21-0.162549-1.61730.054493
220.125671.25040.10705
230.1059121.05380.147267
24-0.143932-1.43210.077632
250.136841.36150.088218
260.0771020.76720.222408
270.012390.12330.45107
28-0.1193-1.1870.119029
290.071270.70910.239955
30-0.138618-1.37920.085465
310.0593910.59090.277957
320.007050.07010.472111
33-0.061501-0.61190.270993
340.0293780.29230.385333
35-0.089123-0.88680.188678
360.0032920.03280.486969
370.0068820.06850.472771
380.0424030.42190.337004
390.0151820.15110.440117
40-0.006296-0.06260.475086
41-0.10287-1.02350.154274
420.0266770.26540.395615
430.0512910.51030.305474
44-0.024246-0.24120.404932
45-0.080371-0.79970.212906
46-0.029589-0.29440.38453
470.0109190.10860.456854
48-0.087502-0.87060.193029


Parameters (Session):
par1 = 48 ; par2 = 1 ; par3 = 1 ; par4 = 0 ; par5 = 12 ; par6 = White Noise ; par7 = 0.95 ;
Parameters (R input):
par1 = 48 ; par2 = 1 ; par3 = 1 ; par4 = 0 ; par5 = 12 ; par6 = White Noise ; par7 = 0.95 ; par8 = ;
R code (references can be found in the software module):
if (par1 == 'Default') {
par1 = 10*log10(length(x))
} else {
par1 <- as.numeric(par1)
}
par2 <- as.numeric(par2)
par3 <- as.numeric(par3)
par4 <- as.numeric(par4)
par5 <- as.numeric(par5)
if (par6 == 'White Noise') par6 <- 'white' else par6 <- 'ma'
par7 <- as.numeric(par7)
if (par8 != '') par8 <- as.numeric(par8)
ox <- x
if (par8 == '') {
if (par2 == 0) {
x <- log(x)
} else {
x <- (x ^ par2 - 1) / par2
}
} else {
x <- log(x,base=par8)
}
if (par3 > 0) x <- diff(x,lag=1,difference=par3)
if (par4 > 0) x <- diff(x,lag=par5,difference=par4)
bitmap(file='picts.png')
op <- par(mfrow=c(2,1))
plot(ox,type='l',main='Original Time Series',xlab='time',ylab='value')
if (par8=='') {
mytitle <- paste('Working Time Series (lambda=',par2,', d=',par3,', D=',par4,')',sep='')
mysub <- paste('(lambda=',par2,', d=',par3,', D=',par4,', CI=', par7, ', CI type=',par6,')',sep='')
} else {
mytitle <- paste('Working Time Series (base=',par8,', d=',par3,', D=',par4,')',sep='')
mysub <- paste('(base=',par8,', d=',par3,', D=',par4,', CI=', par7, ', CI type=',par6,')',sep='')
}
plot(x,type='l', main=mytitle,xlab='time',ylab='value')
par(op)
dev.off()
bitmap(file='pic1.png')
racf <- acf(x, par1, main='Autocorrelation', xlab='time lag', ylab='ACF', ci.type=par6, ci=par7, sub=mysub)
dev.off()
bitmap(file='pic2.png')
rpacf <- pacf(x,par1,main='Partial Autocorrelation',xlab='lags',ylab='PACF',sub=mysub)
dev.off()
(myacf <- c(racf$acf))
(mypacf <- c(rpacf$acf))
lengthx <- length(x)
sqrtn <- sqrt(lengthx)
load(file='createtable')
a<-table.start()
a<-table.row.start(a)
a<-table.element(a,'Autocorrelation Function',4,TRUE)
a<-table.row.end(a)
a<-table.row.start(a)
a<-table.element(a,'Time lag k',header=TRUE)
a<-table.element(a,hyperlink('basics.htm','ACF(k)','click here for more information about the Autocorrelation Function'),header=TRUE)
a<-table.element(a,'T-STAT',header=TRUE)
a<-table.element(a,'P-value',header=TRUE)
a<-table.row.end(a)
for (i in 2:(par1+1)) {
a<-table.row.start(a)
a<-table.element(a,i-1,header=TRUE)
a<-table.element(a,round(myacf[i],6))
mytstat <- myacf[i]*sqrtn
a<-table.element(a,round(mytstat,4))
a<-table.element(a,round(1-pt(abs(mytstat),lengthx),6))
a<-table.row.end(a)
}
a<-table.end(a)
table.save(a,file='mytable.tab')
a<-table.start()
a<-table.row.start(a)
a<-table.element(a,'Partial Autocorrelation Function',4,TRUE)
a<-table.row.end(a)
a<-table.row.start(a)
a<-table.element(a,'Time lag k',header=TRUE)
a<-table.element(a,hyperlink('basics.htm','PACF(k)','click here for more information about the Partial Autocorrelation Function'),header=TRUE)
a<-table.element(a,'T-STAT',header=TRUE)
a<-table.element(a,'P-value',header=TRUE)
a<-table.row.end(a)
for (i in 1:par1) {
a<-table.row.start(a)
a<-table.element(a,i,header=TRUE)
a<-table.element(a,round(mypacf[i],6))
mytstat <- mypacf[i]*sqrtn
a<-table.element(a,round(mytstat,4))
a<-table.element(a,round(1-pt(abs(mytstat),lengthx),6))
a<-table.row.end(a)
}
a<-table.end(a)
table.save(a,file='mytable1.tab')