Free Statistics

of Irreproducible Research!

Author's title

Author*Unverified author*
R Software Modulerwasp_autocorrelation.wasp
Title produced by software(Partial) Autocorrelation Function
Date of computationFri, 08 Apr 2011 10:15:39 +0000
Cite this page as followsStatistical Computations at FreeStatistics.org, Office for Research Development and Education, URL https://freestatistics.org/blog/index.php?v=date/2011/Apr/08/t1302257578j4n4bp3s1p8xlzf.htm/, Retrieved Thu, 09 May 2024 12:38:21 +0000
Statistical Computations at FreeStatistics.org, Office for Research Development and Education, URL https://freestatistics.org/blog/index.php?pk=120419, Retrieved Thu, 09 May 2024 12:38:21 +0000
QR Codes:

Original text written by user:
IsPrivate?No (this computation is public)
User-defined keywordsKDGP2W12
Estimated Impact229
Family? (F = Feedback message, R = changed R code, M = changed R Module, P = changed Parameters, D = changed Data)
-       [(Partial) Autocorrelation Function] [Trend cijferreeks...] [2011-04-08 10:15:39] [efc14e9f026602d150a82e87225d5526] [Current]
Feedback Forum

Post a new message
Dataseries X:
189
229
249
289
260
431
660
777
915
613
485
277
244
296
319
370
313
556
831
960
1152
759
607
371
298
378
373
443
374
660
1004
1153
1388
904
715
441


Summary of computational transaction
Raw Inputview raw input (R code)
Raw Outputview raw output of R engine
Computing time4 seconds
R Server'George Udny Yule' @ 216.218.223.82

\begin{tabular}{lllllllll}
\hline
Summary of computational transaction \tabularnewline
Raw Input & view raw input (R code)  \tabularnewline
Raw Output & view raw output of R engine  \tabularnewline
Computing time & 4 seconds \tabularnewline
R Server & 'George Udny Yule' @ 216.218.223.82 \tabularnewline
\hline
\end{tabular}
%Source: https://freestatistics.org/blog/index.php?pk=120419&T=0

[TABLE]
[ROW][C]Summary of computational transaction[/C][/ROW]
[ROW][C]Raw Input[/C][C]view raw input (R code) [/C][/ROW]
[ROW][C]Raw Output[/C][C]view raw output of R engine [/C][/ROW]
[ROW][C]Computing time[/C][C]4 seconds[/C][/ROW]
[ROW][C]R Server[/C][C]'George Udny Yule' @ 216.218.223.82[/C][/ROW]
[/TABLE]
Source: https://freestatistics.org/blog/index.php?pk=120419&T=0

Globally Unique Identifier (entire table): ba.freestatistics.org/blog/index.php?pk=120419&T=0

As an alternative you can also use a QR Code:  

The GUIDs for individual cells are displayed in the table below:

Summary of computational transaction
Raw Inputview raw input (R code)
Raw Outputview raw output of R engine
Computing time4 seconds
R Server'George Udny Yule' @ 216.218.223.82


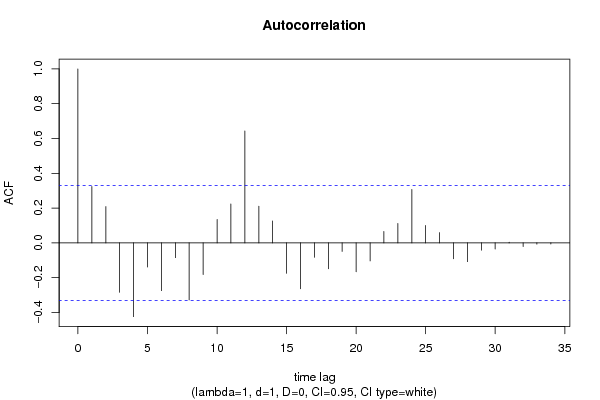
Autocorrelation Function
Time lag kACF(k)T-STATP-value
10.3244181.91930.031566
20.2083311.23250.112988
3-0.284231-1.68150.050782
4-0.42424-2.50980.008428
5-0.138323-0.81830.209353
6-0.274828-1.62590.056471
7-0.085031-0.50310.309039
8-0.327821-1.93940.030273
9-0.181751-1.07530.144809
100.1348510.79780.215186
110.2236851.32330.097151
120.6431193.80470.000274
130.2103131.24420.110842
140.1256280.74320.231153
15-0.174536-1.03260.154444
16-0.263577-1.55930.063956
17-0.08237-0.48730.314539
18-0.148979-0.88140.192065
19-0.049127-0.29060.386522
20-0.165927-0.98160.166508
21-0.103749-0.61380.271663
220.0656710.38850.349995
230.1116570.66060.256606
240.3064381.81290.039215
250.0996470.58950.27965
260.0589050.34850.364781
27-0.091532-0.54150.295793
28-0.107919-0.63850.263666
29-0.041974-0.24830.402669
30-0.035357-0.20920.417763
310.0036680.02170.491404
32-0.020726-0.12260.451556
33-0.007469-0.04420.482503
34-0.006865-0.04060.483917
35NANANA
36NANANA
37NANANA
38NANANA
39NANANA
40NANANA
41NANANA
42NANANA
43NANANA
44NANANA
45NANANA
46NANANA
47NANANA
48NANANA

\begin{tabular}{lllllllll}
\hline
Autocorrelation Function \tabularnewline
Time lag k & ACF(k) & T-STAT & P-value \tabularnewline
1 & 0.324418 & 1.9193 & 0.031566 \tabularnewline
2 & 0.208331 & 1.2325 & 0.112988 \tabularnewline
3 & -0.284231 & -1.6815 & 0.050782 \tabularnewline
4 & -0.42424 & -2.5098 & 0.008428 \tabularnewline
5 & -0.138323 & -0.8183 & 0.209353 \tabularnewline
6 & -0.274828 & -1.6259 & 0.056471 \tabularnewline
7 & -0.085031 & -0.5031 & 0.309039 \tabularnewline
8 & -0.327821 & -1.9394 & 0.030273 \tabularnewline
9 & -0.181751 & -1.0753 & 0.144809 \tabularnewline
10 & 0.134851 & 0.7978 & 0.215186 \tabularnewline
11 & 0.223685 & 1.3233 & 0.097151 \tabularnewline
12 & 0.643119 & 3.8047 & 0.000274 \tabularnewline
13 & 0.210313 & 1.2442 & 0.110842 \tabularnewline
14 & 0.125628 & 0.7432 & 0.231153 \tabularnewline
15 & -0.174536 & -1.0326 & 0.154444 \tabularnewline
16 & -0.263577 & -1.5593 & 0.063956 \tabularnewline
17 & -0.08237 & -0.4873 & 0.314539 \tabularnewline
18 & -0.148979 & -0.8814 & 0.192065 \tabularnewline
19 & -0.049127 & -0.2906 & 0.386522 \tabularnewline
20 & -0.165927 & -0.9816 & 0.166508 \tabularnewline
21 & -0.103749 & -0.6138 & 0.271663 \tabularnewline
22 & 0.065671 & 0.3885 & 0.349995 \tabularnewline
23 & 0.111657 & 0.6606 & 0.256606 \tabularnewline
24 & 0.306438 & 1.8129 & 0.039215 \tabularnewline
25 & 0.099647 & 0.5895 & 0.27965 \tabularnewline
26 & 0.058905 & 0.3485 & 0.364781 \tabularnewline
27 & -0.091532 & -0.5415 & 0.295793 \tabularnewline
28 & -0.107919 & -0.6385 & 0.263666 \tabularnewline
29 & -0.041974 & -0.2483 & 0.402669 \tabularnewline
30 & -0.035357 & -0.2092 & 0.417763 \tabularnewline
31 & 0.003668 & 0.0217 & 0.491404 \tabularnewline
32 & -0.020726 & -0.1226 & 0.451556 \tabularnewline
33 & -0.007469 & -0.0442 & 0.482503 \tabularnewline
34 & -0.006865 & -0.0406 & 0.483917 \tabularnewline
35 & NA & NA & NA \tabularnewline
36 & NA & NA & NA \tabularnewline
37 & NA & NA & NA \tabularnewline
38 & NA & NA & NA \tabularnewline
39 & NA & NA & NA \tabularnewline
40 & NA & NA & NA \tabularnewline
41 & NA & NA & NA \tabularnewline
42 & NA & NA & NA \tabularnewline
43 & NA & NA & NA \tabularnewline
44 & NA & NA & NA \tabularnewline
45 & NA & NA & NA \tabularnewline
46 & NA & NA & NA \tabularnewline
47 & NA & NA & NA \tabularnewline
48 & NA & NA & NA \tabularnewline
\hline
\end{tabular}
%Source: https://freestatistics.org/blog/index.php?pk=120419&T=1

[TABLE]
[ROW][C]Autocorrelation Function[/C][/ROW]
[ROW][C]Time lag k[/C][C]ACF(k)[/C][C]T-STAT[/C][C]P-value[/C][/ROW]
[ROW][C]1[/C][C]0.324418[/C][C]1.9193[/C][C]0.031566[/C][/ROW]
[ROW][C]2[/C][C]0.208331[/C][C]1.2325[/C][C]0.112988[/C][/ROW]
[ROW][C]3[/C][C]-0.284231[/C][C]-1.6815[/C][C]0.050782[/C][/ROW]
[ROW][C]4[/C][C]-0.42424[/C][C]-2.5098[/C][C]0.008428[/C][/ROW]
[ROW][C]5[/C][C]-0.138323[/C][C]-0.8183[/C][C]0.209353[/C][/ROW]
[ROW][C]6[/C][C]-0.274828[/C][C]-1.6259[/C][C]0.056471[/C][/ROW]
[ROW][C]7[/C][C]-0.085031[/C][C]-0.5031[/C][C]0.309039[/C][/ROW]
[ROW][C]8[/C][C]-0.327821[/C][C]-1.9394[/C][C]0.030273[/C][/ROW]
[ROW][C]9[/C][C]-0.181751[/C][C]-1.0753[/C][C]0.144809[/C][/ROW]
[ROW][C]10[/C][C]0.134851[/C][C]0.7978[/C][C]0.215186[/C][/ROW]
[ROW][C]11[/C][C]0.223685[/C][C]1.3233[/C][C]0.097151[/C][/ROW]
[ROW][C]12[/C][C]0.643119[/C][C]3.8047[/C][C]0.000274[/C][/ROW]
[ROW][C]13[/C][C]0.210313[/C][C]1.2442[/C][C]0.110842[/C][/ROW]
[ROW][C]14[/C][C]0.125628[/C][C]0.7432[/C][C]0.231153[/C][/ROW]
[ROW][C]15[/C][C]-0.174536[/C][C]-1.0326[/C][C]0.154444[/C][/ROW]
[ROW][C]16[/C][C]-0.263577[/C][C]-1.5593[/C][C]0.063956[/C][/ROW]
[ROW][C]17[/C][C]-0.08237[/C][C]-0.4873[/C][C]0.314539[/C][/ROW]
[ROW][C]18[/C][C]-0.148979[/C][C]-0.8814[/C][C]0.192065[/C][/ROW]
[ROW][C]19[/C][C]-0.049127[/C][C]-0.2906[/C][C]0.386522[/C][/ROW]
[ROW][C]20[/C][C]-0.165927[/C][C]-0.9816[/C][C]0.166508[/C][/ROW]
[ROW][C]21[/C][C]-0.103749[/C][C]-0.6138[/C][C]0.271663[/C][/ROW]
[ROW][C]22[/C][C]0.065671[/C][C]0.3885[/C][C]0.349995[/C][/ROW]
[ROW][C]23[/C][C]0.111657[/C][C]0.6606[/C][C]0.256606[/C][/ROW]
[ROW][C]24[/C][C]0.306438[/C][C]1.8129[/C][C]0.039215[/C][/ROW]
[ROW][C]25[/C][C]0.099647[/C][C]0.5895[/C][C]0.27965[/C][/ROW]
[ROW][C]26[/C][C]0.058905[/C][C]0.3485[/C][C]0.364781[/C][/ROW]
[ROW][C]27[/C][C]-0.091532[/C][C]-0.5415[/C][C]0.295793[/C][/ROW]
[ROW][C]28[/C][C]-0.107919[/C][C]-0.6385[/C][C]0.263666[/C][/ROW]
[ROW][C]29[/C][C]-0.041974[/C][C]-0.2483[/C][C]0.402669[/C][/ROW]
[ROW][C]30[/C][C]-0.035357[/C][C]-0.2092[/C][C]0.417763[/C][/ROW]
[ROW][C]31[/C][C]0.003668[/C][C]0.0217[/C][C]0.491404[/C][/ROW]
[ROW][C]32[/C][C]-0.020726[/C][C]-0.1226[/C][C]0.451556[/C][/ROW]
[ROW][C]33[/C][C]-0.007469[/C][C]-0.0442[/C][C]0.482503[/C][/ROW]
[ROW][C]34[/C][C]-0.006865[/C][C]-0.0406[/C][C]0.483917[/C][/ROW]
[ROW][C]35[/C][C]NA[/C][C]NA[/C][C]NA[/C][/ROW]
[ROW][C]36[/C][C]NA[/C][C]NA[/C][C]NA[/C][/ROW]
[ROW][C]37[/C][C]NA[/C][C]NA[/C][C]NA[/C][/ROW]
[ROW][C]38[/C][C]NA[/C][C]NA[/C][C]NA[/C][/ROW]
[ROW][C]39[/C][C]NA[/C][C]NA[/C][C]NA[/C][/ROW]
[ROW][C]40[/C][C]NA[/C][C]NA[/C][C]NA[/C][/ROW]
[ROW][C]41[/C][C]NA[/C][C]NA[/C][C]NA[/C][/ROW]
[ROW][C]42[/C][C]NA[/C][C]NA[/C][C]NA[/C][/ROW]
[ROW][C]43[/C][C]NA[/C][C]NA[/C][C]NA[/C][/ROW]
[ROW][C]44[/C][C]NA[/C][C]NA[/C][C]NA[/C][/ROW]
[ROW][C]45[/C][C]NA[/C][C]NA[/C][C]NA[/C][/ROW]
[ROW][C]46[/C][C]NA[/C][C]NA[/C][C]NA[/C][/ROW]
[ROW][C]47[/C][C]NA[/C][C]NA[/C][C]NA[/C][/ROW]
[ROW][C]48[/C][C]NA[/C][C]NA[/C][C]NA[/C][/ROW]
[/TABLE]
Source: https://freestatistics.org/blog/index.php?pk=120419&T=1

Globally Unique Identifier (entire table): ba.freestatistics.org/blog/index.php?pk=120419&T=1

As an alternative you can also use a QR Code:  

The GUIDs for individual cells are displayed in the table below:

Autocorrelation Function
Time lag kACF(k)T-STATP-value
10.3244181.91930.031566
20.2083311.23250.112988
3-0.284231-1.68150.050782
4-0.42424-2.50980.008428
5-0.138323-0.81830.209353
6-0.274828-1.62590.056471
7-0.085031-0.50310.309039
8-0.327821-1.93940.030273
9-0.181751-1.07530.144809
100.1348510.79780.215186
110.2236851.32330.097151
120.6431193.80470.000274
130.2103131.24420.110842
140.1256280.74320.231153
15-0.174536-1.03260.154444
16-0.263577-1.55930.063956
17-0.08237-0.48730.314539
18-0.148979-0.88140.192065
19-0.049127-0.29060.386522
20-0.165927-0.98160.166508
21-0.103749-0.61380.271663
220.0656710.38850.349995
230.1116570.66060.256606
240.3064381.81290.039215
250.0996470.58950.27965
260.0589050.34850.364781
27-0.091532-0.54150.295793
28-0.107919-0.63850.263666
29-0.041974-0.24830.402669
30-0.035357-0.20920.417763
310.0036680.02170.491404
32-0.020726-0.12260.451556
33-0.007469-0.04420.482503
34-0.006865-0.04060.483917
35NANANA
36NANANA
37NANANA
38NANANA
39NANANA
40NANANA
41NANANA
42NANANA
43NANANA
44NANANA
45NANANA
46NANANA
47NANANA
48NANANA


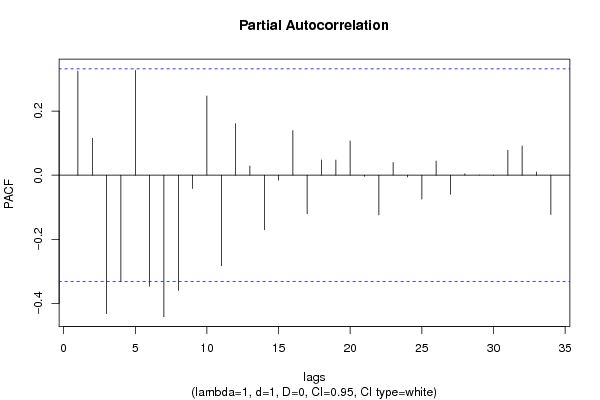
Partial Autocorrelation Function
Time lag kPACF(k)T-STATP-value
10.3244181.91930.031566
20.115210.68160.249992
3-0.432004-2.55580.007548
4-0.331696-1.96230.028856
50.326481.93150.030777
6-0.346458-2.04970.023974
7-0.441302-2.61080.006605
8-0.359398-2.12620.020306
9-0.041572-0.24590.403582
100.2471631.46220.076299
11-0.282632-1.67210.051714
120.1608130.95140.173968
130.0288070.17040.43283
14-0.170303-1.00750.160299
15-0.015459-0.09150.463826
160.1391070.8230.208049
17-0.120603-0.71350.240134
180.0471790.27910.390899
190.0469410.27770.391436
200.1068740.63230.265658
21-0.003434-0.02030.491954
22-0.123818-0.73250.234365
230.039360.23290.408614
24-0.005726-0.03390.486585
25-0.074333-0.43980.331407
260.0437880.25910.398556
27-0.05944-0.35170.363603
280.0039720.02350.490693
290.0002160.00130.499493
30-0.000865-0.00510.497974
310.0776290.45930.324445
320.0911850.53950.296493
330.009920.05870.476767
34-0.122601-0.72530.236539
35NANANA
36NANANA
37NANANA
38NANANA
39NANANA
40NANANA
41NANANA
42NANANA
43NANANA
44NANANA
45NANANA
46NANANA
47NANANA
48NANANA

\begin{tabular}{lllllllll}
\hline
Partial Autocorrelation Function \tabularnewline
Time lag k & PACF(k) & T-STAT & P-value \tabularnewline
1 & 0.324418 & 1.9193 & 0.031566 \tabularnewline
2 & 0.11521 & 0.6816 & 0.249992 \tabularnewline
3 & -0.432004 & -2.5558 & 0.007548 \tabularnewline
4 & -0.331696 & -1.9623 & 0.028856 \tabularnewline
5 & 0.32648 & 1.9315 & 0.030777 \tabularnewline
6 & -0.346458 & -2.0497 & 0.023974 \tabularnewline
7 & -0.441302 & -2.6108 & 0.006605 \tabularnewline
8 & -0.359398 & -2.1262 & 0.020306 \tabularnewline
9 & -0.041572 & -0.2459 & 0.403582 \tabularnewline
10 & 0.247163 & 1.4622 & 0.076299 \tabularnewline
11 & -0.282632 & -1.6721 & 0.051714 \tabularnewline
12 & 0.160813 & 0.9514 & 0.173968 \tabularnewline
13 & 0.028807 & 0.1704 & 0.43283 \tabularnewline
14 & -0.170303 & -1.0075 & 0.160299 \tabularnewline
15 & -0.015459 & -0.0915 & 0.463826 \tabularnewline
16 & 0.139107 & 0.823 & 0.208049 \tabularnewline
17 & -0.120603 & -0.7135 & 0.240134 \tabularnewline
18 & 0.047179 & 0.2791 & 0.390899 \tabularnewline
19 & 0.046941 & 0.2777 & 0.391436 \tabularnewline
20 & 0.106874 & 0.6323 & 0.265658 \tabularnewline
21 & -0.003434 & -0.0203 & 0.491954 \tabularnewline
22 & -0.123818 & -0.7325 & 0.234365 \tabularnewline
23 & 0.03936 & 0.2329 & 0.408614 \tabularnewline
24 & -0.005726 & -0.0339 & 0.486585 \tabularnewline
25 & -0.074333 & -0.4398 & 0.331407 \tabularnewline
26 & 0.043788 & 0.2591 & 0.398556 \tabularnewline
27 & -0.05944 & -0.3517 & 0.363603 \tabularnewline
28 & 0.003972 & 0.0235 & 0.490693 \tabularnewline
29 & 0.000216 & 0.0013 & 0.499493 \tabularnewline
30 & -0.000865 & -0.0051 & 0.497974 \tabularnewline
31 & 0.077629 & 0.4593 & 0.324445 \tabularnewline
32 & 0.091185 & 0.5395 & 0.296493 \tabularnewline
33 & 0.00992 & 0.0587 & 0.476767 \tabularnewline
34 & -0.122601 & -0.7253 & 0.236539 \tabularnewline
35 & NA & NA & NA \tabularnewline
36 & NA & NA & NA \tabularnewline
37 & NA & NA & NA \tabularnewline
38 & NA & NA & NA \tabularnewline
39 & NA & NA & NA \tabularnewline
40 & NA & NA & NA \tabularnewline
41 & NA & NA & NA \tabularnewline
42 & NA & NA & NA \tabularnewline
43 & NA & NA & NA \tabularnewline
44 & NA & NA & NA \tabularnewline
45 & NA & NA & NA \tabularnewline
46 & NA & NA & NA \tabularnewline
47 & NA & NA & NA \tabularnewline
48 & NA & NA & NA \tabularnewline
\hline
\end{tabular}
%Source: https://freestatistics.org/blog/index.php?pk=120419&T=2

[TABLE]
[ROW][C]Partial Autocorrelation Function[/C][/ROW]
[ROW][C]Time lag k[/C][C]PACF(k)[/C][C]T-STAT[/C][C]P-value[/C][/ROW]
[ROW][C]1[/C][C]0.324418[/C][C]1.9193[/C][C]0.031566[/C][/ROW]
[ROW][C]2[/C][C]0.11521[/C][C]0.6816[/C][C]0.249992[/C][/ROW]
[ROW][C]3[/C][C]-0.432004[/C][C]-2.5558[/C][C]0.007548[/C][/ROW]
[ROW][C]4[/C][C]-0.331696[/C][C]-1.9623[/C][C]0.028856[/C][/ROW]
[ROW][C]5[/C][C]0.32648[/C][C]1.9315[/C][C]0.030777[/C][/ROW]
[ROW][C]6[/C][C]-0.346458[/C][C]-2.0497[/C][C]0.023974[/C][/ROW]
[ROW][C]7[/C][C]-0.441302[/C][C]-2.6108[/C][C]0.006605[/C][/ROW]
[ROW][C]8[/C][C]-0.359398[/C][C]-2.1262[/C][C]0.020306[/C][/ROW]
[ROW][C]9[/C][C]-0.041572[/C][C]-0.2459[/C][C]0.403582[/C][/ROW]
[ROW][C]10[/C][C]0.247163[/C][C]1.4622[/C][C]0.076299[/C][/ROW]
[ROW][C]11[/C][C]-0.282632[/C][C]-1.6721[/C][C]0.051714[/C][/ROW]
[ROW][C]12[/C][C]0.160813[/C][C]0.9514[/C][C]0.173968[/C][/ROW]
[ROW][C]13[/C][C]0.028807[/C][C]0.1704[/C][C]0.43283[/C][/ROW]
[ROW][C]14[/C][C]-0.170303[/C][C]-1.0075[/C][C]0.160299[/C][/ROW]
[ROW][C]15[/C][C]-0.015459[/C][C]-0.0915[/C][C]0.463826[/C][/ROW]
[ROW][C]16[/C][C]0.139107[/C][C]0.823[/C][C]0.208049[/C][/ROW]
[ROW][C]17[/C][C]-0.120603[/C][C]-0.7135[/C][C]0.240134[/C][/ROW]
[ROW][C]18[/C][C]0.047179[/C][C]0.2791[/C][C]0.390899[/C][/ROW]
[ROW][C]19[/C][C]0.046941[/C][C]0.2777[/C][C]0.391436[/C][/ROW]
[ROW][C]20[/C][C]0.106874[/C][C]0.6323[/C][C]0.265658[/C][/ROW]
[ROW][C]21[/C][C]-0.003434[/C][C]-0.0203[/C][C]0.491954[/C][/ROW]
[ROW][C]22[/C][C]-0.123818[/C][C]-0.7325[/C][C]0.234365[/C][/ROW]
[ROW][C]23[/C][C]0.03936[/C][C]0.2329[/C][C]0.408614[/C][/ROW]
[ROW][C]24[/C][C]-0.005726[/C][C]-0.0339[/C][C]0.486585[/C][/ROW]
[ROW][C]25[/C][C]-0.074333[/C][C]-0.4398[/C][C]0.331407[/C][/ROW]
[ROW][C]26[/C][C]0.043788[/C][C]0.2591[/C][C]0.398556[/C][/ROW]
[ROW][C]27[/C][C]-0.05944[/C][C]-0.3517[/C][C]0.363603[/C][/ROW]
[ROW][C]28[/C][C]0.003972[/C][C]0.0235[/C][C]0.490693[/C][/ROW]
[ROW][C]29[/C][C]0.000216[/C][C]0.0013[/C][C]0.499493[/C][/ROW]
[ROW][C]30[/C][C]-0.000865[/C][C]-0.0051[/C][C]0.497974[/C][/ROW]
[ROW][C]31[/C][C]0.077629[/C][C]0.4593[/C][C]0.324445[/C][/ROW]
[ROW][C]32[/C][C]0.091185[/C][C]0.5395[/C][C]0.296493[/C][/ROW]
[ROW][C]33[/C][C]0.00992[/C][C]0.0587[/C][C]0.476767[/C][/ROW]
[ROW][C]34[/C][C]-0.122601[/C][C]-0.7253[/C][C]0.236539[/C][/ROW]
[ROW][C]35[/C][C]NA[/C][C]NA[/C][C]NA[/C][/ROW]
[ROW][C]36[/C][C]NA[/C][C]NA[/C][C]NA[/C][/ROW]
[ROW][C]37[/C][C]NA[/C][C]NA[/C][C]NA[/C][/ROW]
[ROW][C]38[/C][C]NA[/C][C]NA[/C][C]NA[/C][/ROW]
[ROW][C]39[/C][C]NA[/C][C]NA[/C][C]NA[/C][/ROW]
[ROW][C]40[/C][C]NA[/C][C]NA[/C][C]NA[/C][/ROW]
[ROW][C]41[/C][C]NA[/C][C]NA[/C][C]NA[/C][/ROW]
[ROW][C]42[/C][C]NA[/C][C]NA[/C][C]NA[/C][/ROW]
[ROW][C]43[/C][C]NA[/C][C]NA[/C][C]NA[/C][/ROW]
[ROW][C]44[/C][C]NA[/C][C]NA[/C][C]NA[/C][/ROW]
[ROW][C]45[/C][C]NA[/C][C]NA[/C][C]NA[/C][/ROW]
[ROW][C]46[/C][C]NA[/C][C]NA[/C][C]NA[/C][/ROW]
[ROW][C]47[/C][C]NA[/C][C]NA[/C][C]NA[/C][/ROW]
[ROW][C]48[/C][C]NA[/C][C]NA[/C][C]NA[/C][/ROW]
[/TABLE]
Source: https://freestatistics.org/blog/index.php?pk=120419&T=2

Globally Unique Identifier (entire table): ba.freestatistics.org/blog/index.php?pk=120419&T=2

As an alternative you can also use a QR Code:  

The GUIDs for individual cells are displayed in the table below:

Partial Autocorrelation Function
Time lag kPACF(k)T-STATP-value
10.3244181.91930.031566
20.115210.68160.249992
3-0.432004-2.55580.007548
4-0.331696-1.96230.028856
50.326481.93150.030777
6-0.346458-2.04970.023974
7-0.441302-2.61080.006605
8-0.359398-2.12620.020306
9-0.041572-0.24590.403582
100.2471631.46220.076299
11-0.282632-1.67210.051714
120.1608130.95140.173968
130.0288070.17040.43283
14-0.170303-1.00750.160299
15-0.015459-0.09150.463826
160.1391070.8230.208049
17-0.120603-0.71350.240134
180.0471790.27910.390899
190.0469410.27770.391436
200.1068740.63230.265658
21-0.003434-0.02030.491954
22-0.123818-0.73250.234365
230.039360.23290.408614
24-0.005726-0.03390.486585
25-0.074333-0.43980.331407
260.0437880.25910.398556
27-0.05944-0.35170.363603
280.0039720.02350.490693
290.0002160.00130.499493
30-0.000865-0.00510.497974
310.0776290.45930.324445
320.0911850.53950.296493
330.009920.05870.476767
34-0.122601-0.72530.236539
35NANANA
36NANANA
37NANANA
38NANANA
39NANANA
40NANANA
41NANANA
42NANANA
43NANANA
44NANANA
45NANANA
46NANANA
47NANANA
48NANANA


Parameters (Session):
par1 = 48 ; par2 = 1 ; par3 = 1 ; par4 = 0 ; par5 = 12 ; par6 = White Noise ; par7 = 0.95 ;
Parameters (R input):
par1 = 48 ; par2 = 1 ; par3 = 1 ; par4 = 0 ; par5 = 12 ; par6 = White Noise ; par7 = 0.95 ; par8 = ;
R code (references can be found in the software module):
if (par1 == 'Default') {
par1 = 10*log10(length(x))
} else {
par1 <- as.numeric(par1)
}
par2 <- as.numeric(par2)
par3 <- as.numeric(par3)
par4 <- as.numeric(par4)
par5 <- as.numeric(par5)
if (par6 == 'White Noise') par6 <- 'white' else par6 <- 'ma'
par7 <- as.numeric(par7)
if (par8 != '') par8 <- as.numeric(par8)
ox <- x
if (par8 == '') {
if (par2 == 0) {
x <- log(x)
} else {
x <- (x ^ par2 - 1) / par2
}
} else {
x <- log(x,base=par8)
}
if (par3 > 0) x <- diff(x,lag=1,difference=par3)
if (par4 > 0) x <- diff(x,lag=par5,difference=par4)
bitmap(file='picts.png')
op <- par(mfrow=c(2,1))
plot(ox,type='l',main='Original Time Series',xlab='time',ylab='value')
if (par8=='') {
mytitle <- paste('Working Time Series (lambda=',par2,', d=',par3,', D=',par4,')',sep='')
mysub <- paste('(lambda=',par2,', d=',par3,', D=',par4,', CI=', par7, ', CI type=',par6,')',sep='')
} else {
mytitle <- paste('Working Time Series (base=',par8,', d=',par3,', D=',par4,')',sep='')
mysub <- paste('(base=',par8,', d=',par3,', D=',par4,', CI=', par7, ', CI type=',par6,')',sep='')
}
plot(x,type='l', main=mytitle,xlab='time',ylab='value')
par(op)
dev.off()
bitmap(file='pic1.png')
racf <- acf(x, par1, main='Autocorrelation', xlab='time lag', ylab='ACF', ci.type=par6, ci=par7, sub=mysub)
dev.off()
bitmap(file='pic2.png')
rpacf <- pacf(x,par1,main='Partial Autocorrelation',xlab='lags',ylab='PACF',sub=mysub)
dev.off()
(myacf <- c(racf$acf))
(mypacf <- c(rpacf$acf))
lengthx <- length(x)
sqrtn <- sqrt(lengthx)
load(file='createtable')
a<-table.start()
a<-table.row.start(a)
a<-table.element(a,'Autocorrelation Function',4,TRUE)
a<-table.row.end(a)
a<-table.row.start(a)
a<-table.element(a,'Time lag k',header=TRUE)
a<-table.element(a,hyperlink('basics.htm','ACF(k)','click here for more information about the Autocorrelation Function'),header=TRUE)
a<-table.element(a,'T-STAT',header=TRUE)
a<-table.element(a,'P-value',header=TRUE)
a<-table.row.end(a)
for (i in 2:(par1+1)) {
a<-table.row.start(a)
a<-table.element(a,i-1,header=TRUE)
a<-table.element(a,round(myacf[i],6))
mytstat <- myacf[i]*sqrtn
a<-table.element(a,round(mytstat,4))
a<-table.element(a,round(1-pt(abs(mytstat),lengthx),6))
a<-table.row.end(a)
}
a<-table.end(a)
table.save(a,file='mytable.tab')
a<-table.start()
a<-table.row.start(a)
a<-table.element(a,'Partial Autocorrelation Function',4,TRUE)
a<-table.row.end(a)
a<-table.row.start(a)
a<-table.element(a,'Time lag k',header=TRUE)
a<-table.element(a,hyperlink('basics.htm','PACF(k)','click here for more information about the Partial Autocorrelation Function'),header=TRUE)
a<-table.element(a,'T-STAT',header=TRUE)
a<-table.element(a,'P-value',header=TRUE)
a<-table.row.end(a)
for (i in 1:par1) {
a<-table.row.start(a)
a<-table.element(a,i,header=TRUE)
a<-table.element(a,round(mypacf[i],6))
mytstat <- mypacf[i]*sqrtn
a<-table.element(a,round(mytstat,4))
a<-table.element(a,round(1-pt(abs(mytstat),lengthx),6))
a<-table.row.end(a)
}
a<-table.end(a)
table.save(a,file='mytable1.tab')