Free Statistics

of Irreproducible Research!

Author's title

Author*Unverified author*
R Software Modulerwasp_autocorrelation.wasp
Title produced by software(Partial) Autocorrelation Function
Date of computationFri, 08 Apr 2011 10:13:06 +0000
Cite this page as followsStatistical Computations at FreeStatistics.org, Office for Research Development and Education, URL https://freestatistics.org/blog/index.php?v=date/2011/Apr/08/t13022573725yiapxh888z2snf.htm/, Retrieved Thu, 09 May 2024 06:20:50 +0000
Statistical Computations at FreeStatistics.org, Office for Research Development and Education, URL https://freestatistics.org/blog/index.php?pk=120418, Retrieved Thu, 09 May 2024 06:20:50 +0000
QR Codes:

Original text written by user:
IsPrivate?No (this computation is public)
User-defined keywordsKDGP2W12
Estimated Impact230
Family? (F = Feedback message, R = changed R code, M = changed R Module, P = changed Parameters, D = changed Data)
-       [(Partial) Autocorrelation Function] [Cijfergegevens co...] [2011-04-08 10:13:06] [efc14e9f026602d150a82e87225d5526] [Current]
Feedback Forum

Post a new message
Dataseries X:
189
229
249
289
260
431
660
777
915
613
485
277
244
296
319
370
313
556
831
960
1152
759
607
371
298
378
373
443
374
660
1004
1153
1388
904
715
441


Summary of computational transaction
Raw Inputview raw input (R code)
Raw Outputview raw output of R engine
Computing time2 seconds
R Server'RServer@AstonUniversity' @ vre.aston.ac.uk

\begin{tabular}{lllllllll}
\hline
Summary of computational transaction \tabularnewline
Raw Input & view raw input (R code)  \tabularnewline
Raw Output & view raw output of R engine  \tabularnewline
Computing time & 2 seconds \tabularnewline
R Server & 'RServer@AstonUniversity' @ vre.aston.ac.uk \tabularnewline
\hline
\end{tabular}
%Source: https://freestatistics.org/blog/index.php?pk=120418&T=0

[TABLE]
[ROW][C]Summary of computational transaction[/C][/ROW]
[ROW][C]Raw Input[/C][C]view raw input (R code) [/C][/ROW]
[ROW][C]Raw Output[/C][C]view raw output of R engine [/C][/ROW]
[ROW][C]Computing time[/C][C]2 seconds[/C][/ROW]
[ROW][C]R Server[/C][C]'RServer@AstonUniversity' @ vre.aston.ac.uk[/C][/ROW]
[/TABLE]
Source: https://freestatistics.org/blog/index.php?pk=120418&T=0

Globally Unique Identifier (entire table): ba.freestatistics.org/blog/index.php?pk=120418&T=0

As an alternative you can also use a QR Code:  

The GUIDs for individual cells are displayed in the table below:

Summary of computational transaction
Raw Inputview raw input (R code)
Raw Outputview raw output of R engine
Computing time2 seconds
R Server'RServer@AstonUniversity' @ vre.aston.ac.uk


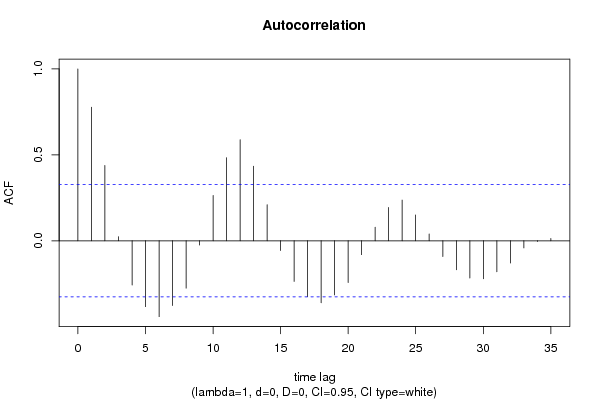
Autocorrelation Function
Time lag kACF(k)T-STATP-value
10.7771964.66322.1e-05
20.4383082.62980.006244
30.0239620.14380.443242
4-0.257333-1.5440.065667
5-0.383101-2.29860.013721
6-0.441384-2.64830.005967
7-0.377151-2.26290.014885
8-0.275625-1.65370.053437
9-0.024564-0.14740.441826
100.2632631.57960.061476
110.4833112.89990.003163
120.587863.52720.000583
130.4343422.60610.006619
140.2104081.26240.107452
15-0.056723-0.34030.367791
16-0.236161-1.4170.082545
17-0.325383-1.95230.029357
18-0.36026-2.16160.018689
19-0.314806-1.88880.033496
20-0.24315-1.45890.076632
21-0.080507-0.4830.315996
220.0785960.47160.320037
230.1940871.16450.125936
240.2368141.42090.081977
250.1500350.90020.186996
260.0393410.2360.407368
27-0.091671-0.550.292848
28-0.168826-1.0130.15892
29-0.216905-1.30140.10069
30-0.221135-1.32680.096463
31-0.180571-1.08340.142911
32-0.129688-0.77810.220789
33-0.041493-0.2490.402403
34-0.004697-0.02820.488836
350.0136120.08170.467681
36NANANA
37NANANA
38NANANA
39NANANA
40NANANA
41NANANA
42NANANA
43NANANA
44NANANA
45NANANA
46NANANA
47NANANA
48NANANA

\begin{tabular}{lllllllll}
\hline
Autocorrelation Function \tabularnewline
Time lag k & ACF(k) & T-STAT & P-value \tabularnewline
1 & 0.777196 & 4.6632 & 2.1e-05 \tabularnewline
2 & 0.438308 & 2.6298 & 0.006244 \tabularnewline
3 & 0.023962 & 0.1438 & 0.443242 \tabularnewline
4 & -0.257333 & -1.544 & 0.065667 \tabularnewline
5 & -0.383101 & -2.2986 & 0.013721 \tabularnewline
6 & -0.441384 & -2.6483 & 0.005967 \tabularnewline
7 & -0.377151 & -2.2629 & 0.014885 \tabularnewline
8 & -0.275625 & -1.6537 & 0.053437 \tabularnewline
9 & -0.024564 & -0.1474 & 0.441826 \tabularnewline
10 & 0.263263 & 1.5796 & 0.061476 \tabularnewline
11 & 0.483311 & 2.8999 & 0.003163 \tabularnewline
12 & 0.58786 & 3.5272 & 0.000583 \tabularnewline
13 & 0.434342 & 2.6061 & 0.006619 \tabularnewline
14 & 0.210408 & 1.2624 & 0.107452 \tabularnewline
15 & -0.056723 & -0.3403 & 0.367791 \tabularnewline
16 & -0.236161 & -1.417 & 0.082545 \tabularnewline
17 & -0.325383 & -1.9523 & 0.029357 \tabularnewline
18 & -0.36026 & -2.1616 & 0.018689 \tabularnewline
19 & -0.314806 & -1.8888 & 0.033496 \tabularnewline
20 & -0.24315 & -1.4589 & 0.076632 \tabularnewline
21 & -0.080507 & -0.483 & 0.315996 \tabularnewline
22 & 0.078596 & 0.4716 & 0.320037 \tabularnewline
23 & 0.194087 & 1.1645 & 0.125936 \tabularnewline
24 & 0.236814 & 1.4209 & 0.081977 \tabularnewline
25 & 0.150035 & 0.9002 & 0.186996 \tabularnewline
26 & 0.039341 & 0.236 & 0.407368 \tabularnewline
27 & -0.091671 & -0.55 & 0.292848 \tabularnewline
28 & -0.168826 & -1.013 & 0.15892 \tabularnewline
29 & -0.216905 & -1.3014 & 0.10069 \tabularnewline
30 & -0.221135 & -1.3268 & 0.096463 \tabularnewline
31 & -0.180571 & -1.0834 & 0.142911 \tabularnewline
32 & -0.129688 & -0.7781 & 0.220789 \tabularnewline
33 & -0.041493 & -0.249 & 0.402403 \tabularnewline
34 & -0.004697 & -0.0282 & 0.488836 \tabularnewline
35 & 0.013612 & 0.0817 & 0.467681 \tabularnewline
36 & NA & NA & NA \tabularnewline
37 & NA & NA & NA \tabularnewline
38 & NA & NA & NA \tabularnewline
39 & NA & NA & NA \tabularnewline
40 & NA & NA & NA \tabularnewline
41 & NA & NA & NA \tabularnewline
42 & NA & NA & NA \tabularnewline
43 & NA & NA & NA \tabularnewline
44 & NA & NA & NA \tabularnewline
45 & NA & NA & NA \tabularnewline
46 & NA & NA & NA \tabularnewline
47 & NA & NA & NA \tabularnewline
48 & NA & NA & NA \tabularnewline
\hline
\end{tabular}
%Source: https://freestatistics.org/blog/index.php?pk=120418&T=1

[TABLE]
[ROW][C]Autocorrelation Function[/C][/ROW]
[ROW][C]Time lag k[/C][C]ACF(k)[/C][C]T-STAT[/C][C]P-value[/C][/ROW]
[ROW][C]1[/C][C]0.777196[/C][C]4.6632[/C][C]2.1e-05[/C][/ROW]
[ROW][C]2[/C][C]0.438308[/C][C]2.6298[/C][C]0.006244[/C][/ROW]
[ROW][C]3[/C][C]0.023962[/C][C]0.1438[/C][C]0.443242[/C][/ROW]
[ROW][C]4[/C][C]-0.257333[/C][C]-1.544[/C][C]0.065667[/C][/ROW]
[ROW][C]5[/C][C]-0.383101[/C][C]-2.2986[/C][C]0.013721[/C][/ROW]
[ROW][C]6[/C][C]-0.441384[/C][C]-2.6483[/C][C]0.005967[/C][/ROW]
[ROW][C]7[/C][C]-0.377151[/C][C]-2.2629[/C][C]0.014885[/C][/ROW]
[ROW][C]8[/C][C]-0.275625[/C][C]-1.6537[/C][C]0.053437[/C][/ROW]
[ROW][C]9[/C][C]-0.024564[/C][C]-0.1474[/C][C]0.441826[/C][/ROW]
[ROW][C]10[/C][C]0.263263[/C][C]1.5796[/C][C]0.061476[/C][/ROW]
[ROW][C]11[/C][C]0.483311[/C][C]2.8999[/C][C]0.003163[/C][/ROW]
[ROW][C]12[/C][C]0.58786[/C][C]3.5272[/C][C]0.000583[/C][/ROW]
[ROW][C]13[/C][C]0.434342[/C][C]2.6061[/C][C]0.006619[/C][/ROW]
[ROW][C]14[/C][C]0.210408[/C][C]1.2624[/C][C]0.107452[/C][/ROW]
[ROW][C]15[/C][C]-0.056723[/C][C]-0.3403[/C][C]0.367791[/C][/ROW]
[ROW][C]16[/C][C]-0.236161[/C][C]-1.417[/C][C]0.082545[/C][/ROW]
[ROW][C]17[/C][C]-0.325383[/C][C]-1.9523[/C][C]0.029357[/C][/ROW]
[ROW][C]18[/C][C]-0.36026[/C][C]-2.1616[/C][C]0.018689[/C][/ROW]
[ROW][C]19[/C][C]-0.314806[/C][C]-1.8888[/C][C]0.033496[/C][/ROW]
[ROW][C]20[/C][C]-0.24315[/C][C]-1.4589[/C][C]0.076632[/C][/ROW]
[ROW][C]21[/C][C]-0.080507[/C][C]-0.483[/C][C]0.315996[/C][/ROW]
[ROW][C]22[/C][C]0.078596[/C][C]0.4716[/C][C]0.320037[/C][/ROW]
[ROW][C]23[/C][C]0.194087[/C][C]1.1645[/C][C]0.125936[/C][/ROW]
[ROW][C]24[/C][C]0.236814[/C][C]1.4209[/C][C]0.081977[/C][/ROW]
[ROW][C]25[/C][C]0.150035[/C][C]0.9002[/C][C]0.186996[/C][/ROW]
[ROW][C]26[/C][C]0.039341[/C][C]0.236[/C][C]0.407368[/C][/ROW]
[ROW][C]27[/C][C]-0.091671[/C][C]-0.55[/C][C]0.292848[/C][/ROW]
[ROW][C]28[/C][C]-0.168826[/C][C]-1.013[/C][C]0.15892[/C][/ROW]
[ROW][C]29[/C][C]-0.216905[/C][C]-1.3014[/C][C]0.10069[/C][/ROW]
[ROW][C]30[/C][C]-0.221135[/C][C]-1.3268[/C][C]0.096463[/C][/ROW]
[ROW][C]31[/C][C]-0.180571[/C][C]-1.0834[/C][C]0.142911[/C][/ROW]
[ROW][C]32[/C][C]-0.129688[/C][C]-0.7781[/C][C]0.220789[/C][/ROW]
[ROW][C]33[/C][C]-0.041493[/C][C]-0.249[/C][C]0.402403[/C][/ROW]
[ROW][C]34[/C][C]-0.004697[/C][C]-0.0282[/C][C]0.488836[/C][/ROW]
[ROW][C]35[/C][C]0.013612[/C][C]0.0817[/C][C]0.467681[/C][/ROW]
[ROW][C]36[/C][C]NA[/C][C]NA[/C][C]NA[/C][/ROW]
[ROW][C]37[/C][C]NA[/C][C]NA[/C][C]NA[/C][/ROW]
[ROW][C]38[/C][C]NA[/C][C]NA[/C][C]NA[/C][/ROW]
[ROW][C]39[/C][C]NA[/C][C]NA[/C][C]NA[/C][/ROW]
[ROW][C]40[/C][C]NA[/C][C]NA[/C][C]NA[/C][/ROW]
[ROW][C]41[/C][C]NA[/C][C]NA[/C][C]NA[/C][/ROW]
[ROW][C]42[/C][C]NA[/C][C]NA[/C][C]NA[/C][/ROW]
[ROW][C]43[/C][C]NA[/C][C]NA[/C][C]NA[/C][/ROW]
[ROW][C]44[/C][C]NA[/C][C]NA[/C][C]NA[/C][/ROW]
[ROW][C]45[/C][C]NA[/C][C]NA[/C][C]NA[/C][/ROW]
[ROW][C]46[/C][C]NA[/C][C]NA[/C][C]NA[/C][/ROW]
[ROW][C]47[/C][C]NA[/C][C]NA[/C][C]NA[/C][/ROW]
[ROW][C]48[/C][C]NA[/C][C]NA[/C][C]NA[/C][/ROW]
[/TABLE]
Source: https://freestatistics.org/blog/index.php?pk=120418&T=1

Globally Unique Identifier (entire table): ba.freestatistics.org/blog/index.php?pk=120418&T=1

As an alternative you can also use a QR Code:  

The GUIDs for individual cells are displayed in the table below:

Autocorrelation Function
Time lag kACF(k)T-STATP-value
10.7771964.66322.1e-05
20.4383082.62980.006244
30.0239620.14380.443242
4-0.257333-1.5440.065667
5-0.383101-2.29860.013721
6-0.441384-2.64830.005967
7-0.377151-2.26290.014885
8-0.275625-1.65370.053437
9-0.024564-0.14740.441826
100.2632631.57960.061476
110.4833112.89990.003163
120.587863.52720.000583
130.4343422.60610.006619
140.2104081.26240.107452
15-0.056723-0.34030.367791
16-0.236161-1.4170.082545
17-0.325383-1.95230.029357
18-0.36026-2.16160.018689
19-0.314806-1.88880.033496
20-0.24315-1.45890.076632
21-0.080507-0.4830.315996
220.0785960.47160.320037
230.1940871.16450.125936
240.2368141.42090.081977
250.1500350.90020.186996
260.0393410.2360.407368
27-0.091671-0.550.292848
28-0.168826-1.0130.15892
29-0.216905-1.30140.10069
30-0.221135-1.32680.096463
31-0.180571-1.08340.142911
32-0.129688-0.77810.220789
33-0.041493-0.2490.402403
34-0.004697-0.02820.488836
350.0136120.08170.467681
36NANANA
37NANANA
38NANANA
39NANANA
40NANANA
41NANANA
42NANANA
43NANANA
44NANANA
45NANANA
46NANANA
47NANANA
48NANANA


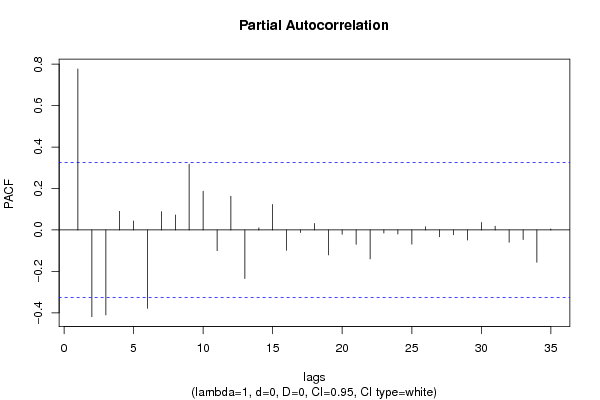
Partial Autocorrelation Function
Time lag kPACF(k)T-STATP-value
10.7771964.66322.1e-05
2-0.418536-2.51120.00833
3-0.410221-2.46130.009384
40.0898380.5390.296593
50.0438040.26280.397092
6-0.378158-2.26890.014682
70.0875990.52560.301197
80.0720050.4320.334149
90.3174171.90450.03243
100.186761.12060.134948
11-0.099911-0.59950.276308
120.1631340.97880.167105
13-0.234639-1.40780.083878
140.0101190.06070.475962
150.1232470.73950.232204
16-0.098511-0.59110.279085
17-0.012519-0.07510.47027
180.0308810.18530.427023
19-0.120445-0.72270.237275
20-0.02079-0.12470.450711
21-0.068846-0.41310.341
22-0.139856-0.83910.203466
23-0.014923-0.08950.464574
24-0.020142-0.12090.45224
25-0.068635-0.41180.34146
260.0156780.09410.462788
27-0.032566-0.19540.423091
28-0.023718-0.14230.443816
29-0.048514-0.29110.386328
300.0365450.21930.41384
310.0177890.10670.457796
32-0.059967-0.35980.36055
33-0.046633-0.27980.390618
34-0.155868-0.93520.177956
350.0046180.02770.489024
36NANANA
37NANANA
38NANANA
39NANANA
40NANANA
41NANANA
42NANANA
43NANANA
44NANANA
45NANANA
46NANANA
47NANANA
48NANANA

\begin{tabular}{lllllllll}
\hline
Partial Autocorrelation Function \tabularnewline
Time lag k & PACF(k) & T-STAT & P-value \tabularnewline
1 & 0.777196 & 4.6632 & 2.1e-05 \tabularnewline
2 & -0.418536 & -2.5112 & 0.00833 \tabularnewline
3 & -0.410221 & -2.4613 & 0.009384 \tabularnewline
4 & 0.089838 & 0.539 & 0.296593 \tabularnewline
5 & 0.043804 & 0.2628 & 0.397092 \tabularnewline
6 & -0.378158 & -2.2689 & 0.014682 \tabularnewline
7 & 0.087599 & 0.5256 & 0.301197 \tabularnewline
8 & 0.072005 & 0.432 & 0.334149 \tabularnewline
9 & 0.317417 & 1.9045 & 0.03243 \tabularnewline
10 & 0.18676 & 1.1206 & 0.134948 \tabularnewline
11 & -0.099911 & -0.5995 & 0.276308 \tabularnewline
12 & 0.163134 & 0.9788 & 0.167105 \tabularnewline
13 & -0.234639 & -1.4078 & 0.083878 \tabularnewline
14 & 0.010119 & 0.0607 & 0.475962 \tabularnewline
15 & 0.123247 & 0.7395 & 0.232204 \tabularnewline
16 & -0.098511 & -0.5911 & 0.279085 \tabularnewline
17 & -0.012519 & -0.0751 & 0.47027 \tabularnewline
18 & 0.030881 & 0.1853 & 0.427023 \tabularnewline
19 & -0.120445 & -0.7227 & 0.237275 \tabularnewline
20 & -0.02079 & -0.1247 & 0.450711 \tabularnewline
21 & -0.068846 & -0.4131 & 0.341 \tabularnewline
22 & -0.139856 & -0.8391 & 0.203466 \tabularnewline
23 & -0.014923 & -0.0895 & 0.464574 \tabularnewline
24 & -0.020142 & -0.1209 & 0.45224 \tabularnewline
25 & -0.068635 & -0.4118 & 0.34146 \tabularnewline
26 & 0.015678 & 0.0941 & 0.462788 \tabularnewline
27 & -0.032566 & -0.1954 & 0.423091 \tabularnewline
28 & -0.023718 & -0.1423 & 0.443816 \tabularnewline
29 & -0.048514 & -0.2911 & 0.386328 \tabularnewline
30 & 0.036545 & 0.2193 & 0.41384 \tabularnewline
31 & 0.017789 & 0.1067 & 0.457796 \tabularnewline
32 & -0.059967 & -0.3598 & 0.36055 \tabularnewline
33 & -0.046633 & -0.2798 & 0.390618 \tabularnewline
34 & -0.155868 & -0.9352 & 0.177956 \tabularnewline
35 & 0.004618 & 0.0277 & 0.489024 \tabularnewline
36 & NA & NA & NA \tabularnewline
37 & NA & NA & NA \tabularnewline
38 & NA & NA & NA \tabularnewline
39 & NA & NA & NA \tabularnewline
40 & NA & NA & NA \tabularnewline
41 & NA & NA & NA \tabularnewline
42 & NA & NA & NA \tabularnewline
43 & NA & NA & NA \tabularnewline
44 & NA & NA & NA \tabularnewline
45 & NA & NA & NA \tabularnewline
46 & NA & NA & NA \tabularnewline
47 & NA & NA & NA \tabularnewline
48 & NA & NA & NA \tabularnewline
\hline
\end{tabular}
%Source: https://freestatistics.org/blog/index.php?pk=120418&T=2

[TABLE]
[ROW][C]Partial Autocorrelation Function[/C][/ROW]
[ROW][C]Time lag k[/C][C]PACF(k)[/C][C]T-STAT[/C][C]P-value[/C][/ROW]
[ROW][C]1[/C][C]0.777196[/C][C]4.6632[/C][C]2.1e-05[/C][/ROW]
[ROW][C]2[/C][C]-0.418536[/C][C]-2.5112[/C][C]0.00833[/C][/ROW]
[ROW][C]3[/C][C]-0.410221[/C][C]-2.4613[/C][C]0.009384[/C][/ROW]
[ROW][C]4[/C][C]0.089838[/C][C]0.539[/C][C]0.296593[/C][/ROW]
[ROW][C]5[/C][C]0.043804[/C][C]0.2628[/C][C]0.397092[/C][/ROW]
[ROW][C]6[/C][C]-0.378158[/C][C]-2.2689[/C][C]0.014682[/C][/ROW]
[ROW][C]7[/C][C]0.087599[/C][C]0.5256[/C][C]0.301197[/C][/ROW]
[ROW][C]8[/C][C]0.072005[/C][C]0.432[/C][C]0.334149[/C][/ROW]
[ROW][C]9[/C][C]0.317417[/C][C]1.9045[/C][C]0.03243[/C][/ROW]
[ROW][C]10[/C][C]0.18676[/C][C]1.1206[/C][C]0.134948[/C][/ROW]
[ROW][C]11[/C][C]-0.099911[/C][C]-0.5995[/C][C]0.276308[/C][/ROW]
[ROW][C]12[/C][C]0.163134[/C][C]0.9788[/C][C]0.167105[/C][/ROW]
[ROW][C]13[/C][C]-0.234639[/C][C]-1.4078[/C][C]0.083878[/C][/ROW]
[ROW][C]14[/C][C]0.010119[/C][C]0.0607[/C][C]0.475962[/C][/ROW]
[ROW][C]15[/C][C]0.123247[/C][C]0.7395[/C][C]0.232204[/C][/ROW]
[ROW][C]16[/C][C]-0.098511[/C][C]-0.5911[/C][C]0.279085[/C][/ROW]
[ROW][C]17[/C][C]-0.012519[/C][C]-0.0751[/C][C]0.47027[/C][/ROW]
[ROW][C]18[/C][C]0.030881[/C][C]0.1853[/C][C]0.427023[/C][/ROW]
[ROW][C]19[/C][C]-0.120445[/C][C]-0.7227[/C][C]0.237275[/C][/ROW]
[ROW][C]20[/C][C]-0.02079[/C][C]-0.1247[/C][C]0.450711[/C][/ROW]
[ROW][C]21[/C][C]-0.068846[/C][C]-0.4131[/C][C]0.341[/C][/ROW]
[ROW][C]22[/C][C]-0.139856[/C][C]-0.8391[/C][C]0.203466[/C][/ROW]
[ROW][C]23[/C][C]-0.014923[/C][C]-0.0895[/C][C]0.464574[/C][/ROW]
[ROW][C]24[/C][C]-0.020142[/C][C]-0.1209[/C][C]0.45224[/C][/ROW]
[ROW][C]25[/C][C]-0.068635[/C][C]-0.4118[/C][C]0.34146[/C][/ROW]
[ROW][C]26[/C][C]0.015678[/C][C]0.0941[/C][C]0.462788[/C][/ROW]
[ROW][C]27[/C][C]-0.032566[/C][C]-0.1954[/C][C]0.423091[/C][/ROW]
[ROW][C]28[/C][C]-0.023718[/C][C]-0.1423[/C][C]0.443816[/C][/ROW]
[ROW][C]29[/C][C]-0.048514[/C][C]-0.2911[/C][C]0.386328[/C][/ROW]
[ROW][C]30[/C][C]0.036545[/C][C]0.2193[/C][C]0.41384[/C][/ROW]
[ROW][C]31[/C][C]0.017789[/C][C]0.1067[/C][C]0.457796[/C][/ROW]
[ROW][C]32[/C][C]-0.059967[/C][C]-0.3598[/C][C]0.36055[/C][/ROW]
[ROW][C]33[/C][C]-0.046633[/C][C]-0.2798[/C][C]0.390618[/C][/ROW]
[ROW][C]34[/C][C]-0.155868[/C][C]-0.9352[/C][C]0.177956[/C][/ROW]
[ROW][C]35[/C][C]0.004618[/C][C]0.0277[/C][C]0.489024[/C][/ROW]
[ROW][C]36[/C][C]NA[/C][C]NA[/C][C]NA[/C][/ROW]
[ROW][C]37[/C][C]NA[/C][C]NA[/C][C]NA[/C][/ROW]
[ROW][C]38[/C][C]NA[/C][C]NA[/C][C]NA[/C][/ROW]
[ROW][C]39[/C][C]NA[/C][C]NA[/C][C]NA[/C][/ROW]
[ROW][C]40[/C][C]NA[/C][C]NA[/C][C]NA[/C][/ROW]
[ROW][C]41[/C][C]NA[/C][C]NA[/C][C]NA[/C][/ROW]
[ROW][C]42[/C][C]NA[/C][C]NA[/C][C]NA[/C][/ROW]
[ROW][C]43[/C][C]NA[/C][C]NA[/C][C]NA[/C][/ROW]
[ROW][C]44[/C][C]NA[/C][C]NA[/C][C]NA[/C][/ROW]
[ROW][C]45[/C][C]NA[/C][C]NA[/C][C]NA[/C][/ROW]
[ROW][C]46[/C][C]NA[/C][C]NA[/C][C]NA[/C][/ROW]
[ROW][C]47[/C][C]NA[/C][C]NA[/C][C]NA[/C][/ROW]
[ROW][C]48[/C][C]NA[/C][C]NA[/C][C]NA[/C][/ROW]
[/TABLE]
Source: https://freestatistics.org/blog/index.php?pk=120418&T=2

Globally Unique Identifier (entire table): ba.freestatistics.org/blog/index.php?pk=120418&T=2

As an alternative you can also use a QR Code:  

The GUIDs for individual cells are displayed in the table below:

Partial Autocorrelation Function
Time lag kPACF(k)T-STATP-value
10.7771964.66322.1e-05
2-0.418536-2.51120.00833
3-0.410221-2.46130.009384
40.0898380.5390.296593
50.0438040.26280.397092
6-0.378158-2.26890.014682
70.0875990.52560.301197
80.0720050.4320.334149
90.3174171.90450.03243
100.186761.12060.134948
11-0.099911-0.59950.276308
120.1631340.97880.167105
13-0.234639-1.40780.083878
140.0101190.06070.475962
150.1232470.73950.232204
16-0.098511-0.59110.279085
17-0.012519-0.07510.47027
180.0308810.18530.427023
19-0.120445-0.72270.237275
20-0.02079-0.12470.450711
21-0.068846-0.41310.341
22-0.139856-0.83910.203466
23-0.014923-0.08950.464574
24-0.020142-0.12090.45224
25-0.068635-0.41180.34146
260.0156780.09410.462788
27-0.032566-0.19540.423091
28-0.023718-0.14230.443816
29-0.048514-0.29110.386328
300.0365450.21930.41384
310.0177890.10670.457796
32-0.059967-0.35980.36055
33-0.046633-0.27980.390618
34-0.155868-0.93520.177956
350.0046180.02770.489024
36NANANA
37NANANA
38NANANA
39NANANA
40NANANA
41NANANA
42NANANA
43NANANA
44NANANA
45NANANA
46NANANA
47NANANA
48NANANA


Parameters (Session):
par1 = 48 ; par2 = 1 ; par3 = 0 ; par4 = 0 ; par5 = 12 ; par6 = White Noise ; par7 = 0.95 ;
Parameters (R input):
par1 = 48 ; par2 = 1 ; par3 = 0 ; par4 = 0 ; par5 = 12 ; par6 = White Noise ; par7 = 0.95 ; par8 = ;
R code (references can be found in the software module):
if (par1 == 'Default') {
par1 = 10*log10(length(x))
} else {
par1 <- as.numeric(par1)
}
par2 <- as.numeric(par2)
par3 <- as.numeric(par3)
par4 <- as.numeric(par4)
par5 <- as.numeric(par5)
if (par6 == 'White Noise') par6 <- 'white' else par6 <- 'ma'
par7 <- as.numeric(par7)
if (par8 != '') par8 <- as.numeric(par8)
ox <- x
if (par8 == '') {
if (par2 == 0) {
x <- log(x)
} else {
x <- (x ^ par2 - 1) / par2
}
} else {
x <- log(x,base=par8)
}
if (par3 > 0) x <- diff(x,lag=1,difference=par3)
if (par4 > 0) x <- diff(x,lag=par5,difference=par4)
bitmap(file='picts.png')
op <- par(mfrow=c(2,1))
plot(ox,type='l',main='Original Time Series',xlab='time',ylab='value')
if (par8=='') {
mytitle <- paste('Working Time Series (lambda=',par2,', d=',par3,', D=',par4,')',sep='')
mysub <- paste('(lambda=',par2,', d=',par3,', D=',par4,', CI=', par7, ', CI type=',par6,')',sep='')
} else {
mytitle <- paste('Working Time Series (base=',par8,', d=',par3,', D=',par4,')',sep='')
mysub <- paste('(base=',par8,', d=',par3,', D=',par4,', CI=', par7, ', CI type=',par6,')',sep='')
}
plot(x,type='l', main=mytitle,xlab='time',ylab='value')
par(op)
dev.off()
bitmap(file='pic1.png')
racf <- acf(x, par1, main='Autocorrelation', xlab='time lag', ylab='ACF', ci.type=par6, ci=par7, sub=mysub)
dev.off()
bitmap(file='pic2.png')
rpacf <- pacf(x,par1,main='Partial Autocorrelation',xlab='lags',ylab='PACF',sub=mysub)
dev.off()
(myacf <- c(racf$acf))
(mypacf <- c(rpacf$acf))
lengthx <- length(x)
sqrtn <- sqrt(lengthx)
load(file='createtable')
a<-table.start()
a<-table.row.start(a)
a<-table.element(a,'Autocorrelation Function',4,TRUE)
a<-table.row.end(a)
a<-table.row.start(a)
a<-table.element(a,'Time lag k',header=TRUE)
a<-table.element(a,hyperlink('basics.htm','ACF(k)','click here for more information about the Autocorrelation Function'),header=TRUE)
a<-table.element(a,'T-STAT',header=TRUE)
a<-table.element(a,'P-value',header=TRUE)
a<-table.row.end(a)
for (i in 2:(par1+1)) {
a<-table.row.start(a)
a<-table.element(a,i-1,header=TRUE)
a<-table.element(a,round(myacf[i],6))
mytstat <- myacf[i]*sqrtn
a<-table.element(a,round(mytstat,4))
a<-table.element(a,round(1-pt(abs(mytstat),lengthx),6))
a<-table.row.end(a)
}
a<-table.end(a)
table.save(a,file='mytable.tab')
a<-table.start()
a<-table.row.start(a)
a<-table.element(a,'Partial Autocorrelation Function',4,TRUE)
a<-table.row.end(a)
a<-table.row.start(a)
a<-table.element(a,'Time lag k',header=TRUE)
a<-table.element(a,hyperlink('basics.htm','PACF(k)','click here for more information about the Partial Autocorrelation Function'),header=TRUE)
a<-table.element(a,'T-STAT',header=TRUE)
a<-table.element(a,'P-value',header=TRUE)
a<-table.row.end(a)
for (i in 1:par1) {
a<-table.row.start(a)
a<-table.element(a,i,header=TRUE)
a<-table.element(a,round(mypacf[i],6))
mytstat <- mypacf[i]*sqrtn
a<-table.element(a,round(mytstat,4))
a<-table.element(a,round(1-pt(abs(mytstat),lengthx),6))
a<-table.row.end(a)
}
a<-table.end(a)
table.save(a,file='mytable1.tab')