Free Statistics

of Irreproducible Research!

Author's title

Author*Unverified author*
R Software Modulerwasp_autocorrelation.wasp
Title produced by software(Partial) Autocorrelation Function
Date of computationWed, 06 Apr 2011 23:50:01 +0000
Cite this page as followsStatistical Computations at FreeStatistics.org, Office for Research Development and Education, URL https://freestatistics.org/blog/index.php?v=date/2011/Apr/07/t13021338536puoji6k4aj2ajl.htm/, Retrieved Thu, 09 May 2024 03:19:03 +0000
Statistical Computations at FreeStatistics.org, Office for Research Development and Education, URL https://freestatistics.org/blog/index.php?pk=120377, Retrieved Thu, 09 May 2024 03:19:03 +0000
QR Codes:

Original text written by user:
IsPrivate?No (this computation is public)
User-defined keywordsKDGP2W12
Estimated Impact182
Family? (F = Feedback message, R = changed R code, M = changed R Module, P = changed Parameters, D = changed Data)
-       [(Partial) Autocorrelation Function] [] [2011-04-06 23:50:01] [70ebd814bf1379a9657d768a4ecd0382] [Current]
- RMPD    [Bootstrap Plot - Central Tendency] [] [2011-04-27 13:57:59] [3ce445e32ec84321dd80fa740118a851]
- RMP     [Blocked Bootstrap Plot - Central Tendency] [] [2011-04-27 14:37:40] [3ce445e32ec84321dd80fa740118a851]
Feedback Forum

Post a new message
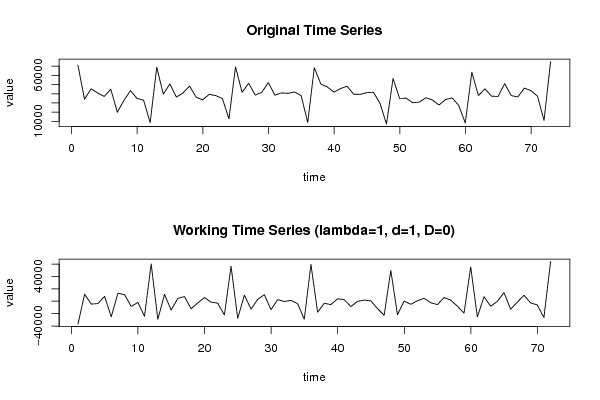
Dataseries X:
70938
34077
45409
40809
37013
44953
19848
32745
43412
34931
33008
8620
68906
39556
50669
36432
40891
48428
36222
33425
39401
37967
34801
12657
69116
41519
51321
38529
41547
52073
38401
40898
40439
41888
37898
8771
68184
50530
47221
41756
45633
48138
39486
39341
41117
41629
29722
7054
56676
34870
35117
30169
30936
35699
33228
27733
33666
35429
27438
8170
63410
38040
45389
37353
37024
50957
37994
36454
46080
43373
37395
10963
75001


Summary of computational transaction
Raw Inputview raw input (R code)
Raw Outputview raw output of R engine
Computing time1 seconds
R Server'Gwilym Jenkins' @ www.wessa.org

\begin{tabular}{lllllllll}
\hline
Summary of computational transaction \tabularnewline
Raw Input & view raw input (R code)  \tabularnewline
Raw Output & view raw output of R engine  \tabularnewline
Computing time & 1 seconds \tabularnewline
R Server & 'Gwilym Jenkins' @ www.wessa.org \tabularnewline
\hline
\end{tabular}
%Source: https://freestatistics.org/blog/index.php?pk=120377&T=0

[TABLE]
[ROW][C]Summary of computational transaction[/C][/ROW]
[ROW][C]Raw Input[/C][C]view raw input (R code) [/C][/ROW]
[ROW][C]Raw Output[/C][C]view raw output of R engine [/C][/ROW]
[ROW][C]Computing time[/C][C]1 seconds[/C][/ROW]
[ROW][C]R Server[/C][C]'Gwilym Jenkins' @ www.wessa.org[/C][/ROW]
[/TABLE]
Source: https://freestatistics.org/blog/index.php?pk=120377&T=0

Globally Unique Identifier (entire table): ba.freestatistics.org/blog/index.php?pk=120377&T=0

As an alternative you can also use a QR Code:  

The GUIDs for individual cells are displayed in the table below:

Summary of computational transaction
Raw Inputview raw input (R code)
Raw Outputview raw output of R engine
Computing time1 seconds
R Server'Gwilym Jenkins' @ www.wessa.org


Autocorrelation Function
Time lag kACF(k)T-STATP-value
1-0.539401-4.5771e-05
20.0877520.74460.229469
3-0.07815-0.66310.254685
40.0626590.53170.298293
50.1740711.4770.072012
6-0.296166-2.51310.007104
70.1162890.98670.163536
80.0724680.61490.270277
9-0.078515-0.66620.2537
100.1348721.14440.128119
11-0.528705-4.48621.3e-05
120.7609796.45710
13-0.401372-3.40580.000541
140.0706490.59950.27537
15-0.069081-0.58620.279797
160.0507330.43050.334063
170.1305551.10780.135818
18-0.228488-1.93880.028224
190.1001520.84980.199121
200.0482090.40910.341852
21-0.057405-0.48710.313835
220.1046540.8880.188743
23-0.431511-3.66150.000238
240.6071845.15211e-06
25-0.309243-2.6240.005302
260.0415020.35220.362876
27-0.056974-0.48340.315125
280.032280.27390.392472
290.1224541.03910.151128
30-0.200368-1.70020.046706
310.0798880.67790.250012
320.0503990.42770.335091
33-0.062154-0.52740.299771
340.1012140.85880.196642
35-0.348484-2.9570.0021
360.4658833.95318.9e-05
37-0.225146-1.91040.03003
380.0330580.28050.389945
39-0.040144-0.34060.367185
400.0253170.21480.415258
410.0875110.74260.230083
42-0.14101-1.19650.117712
430.0557810.47330.318709
440.0397780.33750.368352
45-0.053535-0.45430.325503
460.1093970.92830.178185
47-0.27414-2.32620.011415
480.3250922.75850.003678

\begin{tabular}{lllllllll}
\hline
Autocorrelation Function \tabularnewline
Time lag k & ACF(k) & T-STAT & P-value \tabularnewline
1 & -0.539401 & -4.577 & 1e-05 \tabularnewline
2 & 0.087752 & 0.7446 & 0.229469 \tabularnewline
3 & -0.07815 & -0.6631 & 0.254685 \tabularnewline
4 & 0.062659 & 0.5317 & 0.298293 \tabularnewline
5 & 0.174071 & 1.477 & 0.072012 \tabularnewline
6 & -0.296166 & -2.5131 & 0.007104 \tabularnewline
7 & 0.116289 & 0.9867 & 0.163536 \tabularnewline
8 & 0.072468 & 0.6149 & 0.270277 \tabularnewline
9 & -0.078515 & -0.6662 & 0.2537 \tabularnewline
10 & 0.134872 & 1.1444 & 0.128119 \tabularnewline
11 & -0.528705 & -4.4862 & 1.3e-05 \tabularnewline
12 & 0.760979 & 6.4571 & 0 \tabularnewline
13 & -0.401372 & -3.4058 & 0.000541 \tabularnewline
14 & 0.070649 & 0.5995 & 0.27537 \tabularnewline
15 & -0.069081 & -0.5862 & 0.279797 \tabularnewline
16 & 0.050733 & 0.4305 & 0.334063 \tabularnewline
17 & 0.130555 & 1.1078 & 0.135818 \tabularnewline
18 & -0.228488 & -1.9388 & 0.028224 \tabularnewline
19 & 0.100152 & 0.8498 & 0.199121 \tabularnewline
20 & 0.048209 & 0.4091 & 0.341852 \tabularnewline
21 & -0.057405 & -0.4871 & 0.313835 \tabularnewline
22 & 0.104654 & 0.888 & 0.188743 \tabularnewline
23 & -0.431511 & -3.6615 & 0.000238 \tabularnewline
24 & 0.607184 & 5.1521 & 1e-06 \tabularnewline
25 & -0.309243 & -2.624 & 0.005302 \tabularnewline
26 & 0.041502 & 0.3522 & 0.362876 \tabularnewline
27 & -0.056974 & -0.4834 & 0.315125 \tabularnewline
28 & 0.03228 & 0.2739 & 0.392472 \tabularnewline
29 & 0.122454 & 1.0391 & 0.151128 \tabularnewline
30 & -0.200368 & -1.7002 & 0.046706 \tabularnewline
31 & 0.079888 & 0.6779 & 0.250012 \tabularnewline
32 & 0.050399 & 0.4277 & 0.335091 \tabularnewline
33 & -0.062154 & -0.5274 & 0.299771 \tabularnewline
34 & 0.101214 & 0.8588 & 0.196642 \tabularnewline
35 & -0.348484 & -2.957 & 0.0021 \tabularnewline
36 & 0.465883 & 3.9531 & 8.9e-05 \tabularnewline
37 & -0.225146 & -1.9104 & 0.03003 \tabularnewline
38 & 0.033058 & 0.2805 & 0.389945 \tabularnewline
39 & -0.040144 & -0.3406 & 0.367185 \tabularnewline
40 & 0.025317 & 0.2148 & 0.415258 \tabularnewline
41 & 0.087511 & 0.7426 & 0.230083 \tabularnewline
42 & -0.14101 & -1.1965 & 0.117712 \tabularnewline
43 & 0.055781 & 0.4733 & 0.318709 \tabularnewline
44 & 0.039778 & 0.3375 & 0.368352 \tabularnewline
45 & -0.053535 & -0.4543 & 0.325503 \tabularnewline
46 & 0.109397 & 0.9283 & 0.178185 \tabularnewline
47 & -0.27414 & -2.3262 & 0.011415 \tabularnewline
48 & 0.325092 & 2.7585 & 0.003678 \tabularnewline
\hline
\end{tabular}
%Source: https://freestatistics.org/blog/index.php?pk=120377&T=1

[TABLE]
[ROW][C]Autocorrelation Function[/C][/ROW]
[ROW][C]Time lag k[/C][C]ACF(k)[/C][C]T-STAT[/C][C]P-value[/C][/ROW]
[ROW][C]1[/C][C]-0.539401[/C][C]-4.577[/C][C]1e-05[/C][/ROW]
[ROW][C]2[/C][C]0.087752[/C][C]0.7446[/C][C]0.229469[/C][/ROW]
[ROW][C]3[/C][C]-0.07815[/C][C]-0.6631[/C][C]0.254685[/C][/ROW]
[ROW][C]4[/C][C]0.062659[/C][C]0.5317[/C][C]0.298293[/C][/ROW]
[ROW][C]5[/C][C]0.174071[/C][C]1.477[/C][C]0.072012[/C][/ROW]
[ROW][C]6[/C][C]-0.296166[/C][C]-2.5131[/C][C]0.007104[/C][/ROW]
[ROW][C]7[/C][C]0.116289[/C][C]0.9867[/C][C]0.163536[/C][/ROW]
[ROW][C]8[/C][C]0.072468[/C][C]0.6149[/C][C]0.270277[/C][/ROW]
[ROW][C]9[/C][C]-0.078515[/C][C]-0.6662[/C][C]0.2537[/C][/ROW]
[ROW][C]10[/C][C]0.134872[/C][C]1.1444[/C][C]0.128119[/C][/ROW]
[ROW][C]11[/C][C]-0.528705[/C][C]-4.4862[/C][C]1.3e-05[/C][/ROW]
[ROW][C]12[/C][C]0.760979[/C][C]6.4571[/C][C]0[/C][/ROW]
[ROW][C]13[/C][C]-0.401372[/C][C]-3.4058[/C][C]0.000541[/C][/ROW]
[ROW][C]14[/C][C]0.070649[/C][C]0.5995[/C][C]0.27537[/C][/ROW]
[ROW][C]15[/C][C]-0.069081[/C][C]-0.5862[/C][C]0.279797[/C][/ROW]
[ROW][C]16[/C][C]0.050733[/C][C]0.4305[/C][C]0.334063[/C][/ROW]
[ROW][C]17[/C][C]0.130555[/C][C]1.1078[/C][C]0.135818[/C][/ROW]
[ROW][C]18[/C][C]-0.228488[/C][C]-1.9388[/C][C]0.028224[/C][/ROW]
[ROW][C]19[/C][C]0.100152[/C][C]0.8498[/C][C]0.199121[/C][/ROW]
[ROW][C]20[/C][C]0.048209[/C][C]0.4091[/C][C]0.341852[/C][/ROW]
[ROW][C]21[/C][C]-0.057405[/C][C]-0.4871[/C][C]0.313835[/C][/ROW]
[ROW][C]22[/C][C]0.104654[/C][C]0.888[/C][C]0.188743[/C][/ROW]
[ROW][C]23[/C][C]-0.431511[/C][C]-3.6615[/C][C]0.000238[/C][/ROW]
[ROW][C]24[/C][C]0.607184[/C][C]5.1521[/C][C]1e-06[/C][/ROW]
[ROW][C]25[/C][C]-0.309243[/C][C]-2.624[/C][C]0.005302[/C][/ROW]
[ROW][C]26[/C][C]0.041502[/C][C]0.3522[/C][C]0.362876[/C][/ROW]
[ROW][C]27[/C][C]-0.056974[/C][C]-0.4834[/C][C]0.315125[/C][/ROW]
[ROW][C]28[/C][C]0.03228[/C][C]0.2739[/C][C]0.392472[/C][/ROW]
[ROW][C]29[/C][C]0.122454[/C][C]1.0391[/C][C]0.151128[/C][/ROW]
[ROW][C]30[/C][C]-0.200368[/C][C]-1.7002[/C][C]0.046706[/C][/ROW]
[ROW][C]31[/C][C]0.079888[/C][C]0.6779[/C][C]0.250012[/C][/ROW]
[ROW][C]32[/C][C]0.050399[/C][C]0.4277[/C][C]0.335091[/C][/ROW]
[ROW][C]33[/C][C]-0.062154[/C][C]-0.5274[/C][C]0.299771[/C][/ROW]
[ROW][C]34[/C][C]0.101214[/C][C]0.8588[/C][C]0.196642[/C][/ROW]
[ROW][C]35[/C][C]-0.348484[/C][C]-2.957[/C][C]0.0021[/C][/ROW]
[ROW][C]36[/C][C]0.465883[/C][C]3.9531[/C][C]8.9e-05[/C][/ROW]
[ROW][C]37[/C][C]-0.225146[/C][C]-1.9104[/C][C]0.03003[/C][/ROW]
[ROW][C]38[/C][C]0.033058[/C][C]0.2805[/C][C]0.389945[/C][/ROW]
[ROW][C]39[/C][C]-0.040144[/C][C]-0.3406[/C][C]0.367185[/C][/ROW]
[ROW][C]40[/C][C]0.025317[/C][C]0.2148[/C][C]0.415258[/C][/ROW]
[ROW][C]41[/C][C]0.087511[/C][C]0.7426[/C][C]0.230083[/C][/ROW]
[ROW][C]42[/C][C]-0.14101[/C][C]-1.1965[/C][C]0.117712[/C][/ROW]
[ROW][C]43[/C][C]0.055781[/C][C]0.4733[/C][C]0.318709[/C][/ROW]
[ROW][C]44[/C][C]0.039778[/C][C]0.3375[/C][C]0.368352[/C][/ROW]
[ROW][C]45[/C][C]-0.053535[/C][C]-0.4543[/C][C]0.325503[/C][/ROW]
[ROW][C]46[/C][C]0.109397[/C][C]0.9283[/C][C]0.178185[/C][/ROW]
[ROW][C]47[/C][C]-0.27414[/C][C]-2.3262[/C][C]0.011415[/C][/ROW]
[ROW][C]48[/C][C]0.325092[/C][C]2.7585[/C][C]0.003678[/C][/ROW]
[/TABLE]
Source: https://freestatistics.org/blog/index.php?pk=120377&T=1

Globally Unique Identifier (entire table): ba.freestatistics.org/blog/index.php?pk=120377&T=1

As an alternative you can also use a QR Code:  

The GUIDs for individual cells are displayed in the table below:

Autocorrelation Function
Time lag kACF(k)T-STATP-value
1-0.539401-4.5771e-05
20.0877520.74460.229469
3-0.07815-0.66310.254685
40.0626590.53170.298293
50.1740711.4770.072012
6-0.296166-2.51310.007104
70.1162890.98670.163536
80.0724680.61490.270277
9-0.078515-0.66620.2537
100.1348721.14440.128119
11-0.528705-4.48621.3e-05
120.7609796.45710
13-0.401372-3.40580.000541
140.0706490.59950.27537
15-0.069081-0.58620.279797
160.0507330.43050.334063
170.1305551.10780.135818
18-0.228488-1.93880.028224
190.1001520.84980.199121
200.0482090.40910.341852
21-0.057405-0.48710.313835
220.1046540.8880.188743
23-0.431511-3.66150.000238
240.6071845.15211e-06
25-0.309243-2.6240.005302
260.0415020.35220.362876
27-0.056974-0.48340.315125
280.032280.27390.392472
290.1224541.03910.151128
30-0.200368-1.70020.046706
310.0798880.67790.250012
320.0503990.42770.335091
33-0.062154-0.52740.299771
340.1012140.85880.196642
35-0.348484-2.9570.0021
360.4658833.95318.9e-05
37-0.225146-1.91040.03003
380.0330580.28050.389945
39-0.040144-0.34060.367185
400.0253170.21480.415258
410.0875110.74260.230083
42-0.14101-1.19650.117712
430.0557810.47330.318709
440.0397780.33750.368352
45-0.053535-0.45430.325503
460.1093970.92830.178185
47-0.27414-2.32620.011415
480.3250922.75850.003678


Partial Autocorrelation Function
Time lag kPACF(k)T-STATP-value
1-0.539401-4.5771e-05
2-0.286584-2.43170.008758
3-0.264032-2.24040.014076
4-0.16299-1.3830.085467
50.2181241.85080.034147
6-0.065374-0.55470.290403
7-0.112057-0.95080.172433
80.084240.71480.238522
9-0.041235-0.34990.36372
100.1508771.28020.102286
11-0.555946-4.71746e-06
120.3849983.26680.000834
130.0929030.78830.216552
140.0346790.29430.384701
150.0285580.24230.404611
160.0929140.78840.216526
17-0.144874-1.22930.111482
18-0.03462-0.29380.384892
190.0659550.55960.288728
20-0.034165-0.28990.386363
210.0379360.32190.374232
22-0.125917-1.06840.144446
23-0.0331-0.28090.389811
240.0488570.41460.339845
250.0609860.51750.303203
26-0.024934-0.21160.416519
270.0375430.31860.37549
28-0.084523-0.71720.237785
29-0.038179-0.3240.373453
30-0.020771-0.17620.430297
31-0.041579-0.35280.362631
320.0262530.22280.412175
33-0.061718-0.52370.30105
34-0.036564-0.31030.378633
350.0287990.24440.403821
360.005040.04280.483005
37-0.020949-0.17780.429706
380.0654890.55570.290071
390.0097380.08260.467188
400.0198790.16870.433261
41-0.029711-0.25210.400838
420.0227840.19330.423623
430.0059420.05040.479963
44-0.033089-0.28080.389847
45-0.02013-0.17080.432427
460.0863970.73310.232939
470.0756970.64230.261355
48-0.059648-0.50610.307157

\begin{tabular}{lllllllll}
\hline
Partial Autocorrelation Function \tabularnewline
Time lag k & PACF(k) & T-STAT & P-value \tabularnewline
1 & -0.539401 & -4.577 & 1e-05 \tabularnewline
2 & -0.286584 & -2.4317 & 0.008758 \tabularnewline
3 & -0.264032 & -2.2404 & 0.014076 \tabularnewline
4 & -0.16299 & -1.383 & 0.085467 \tabularnewline
5 & 0.218124 & 1.8508 & 0.034147 \tabularnewline
6 & -0.065374 & -0.5547 & 0.290403 \tabularnewline
7 & -0.112057 & -0.9508 & 0.172433 \tabularnewline
8 & 0.08424 & 0.7148 & 0.238522 \tabularnewline
9 & -0.041235 & -0.3499 & 0.36372 \tabularnewline
10 & 0.150877 & 1.2802 & 0.102286 \tabularnewline
11 & -0.555946 & -4.7174 & 6e-06 \tabularnewline
12 & 0.384998 & 3.2668 & 0.000834 \tabularnewline
13 & 0.092903 & 0.7883 & 0.216552 \tabularnewline
14 & 0.034679 & 0.2943 & 0.384701 \tabularnewline
15 & 0.028558 & 0.2423 & 0.404611 \tabularnewline
16 & 0.092914 & 0.7884 & 0.216526 \tabularnewline
17 & -0.144874 & -1.2293 & 0.111482 \tabularnewline
18 & -0.03462 & -0.2938 & 0.384892 \tabularnewline
19 & 0.065955 & 0.5596 & 0.288728 \tabularnewline
20 & -0.034165 & -0.2899 & 0.386363 \tabularnewline
21 & 0.037936 & 0.3219 & 0.374232 \tabularnewline
22 & -0.125917 & -1.0684 & 0.144446 \tabularnewline
23 & -0.0331 & -0.2809 & 0.389811 \tabularnewline
24 & 0.048857 & 0.4146 & 0.339845 \tabularnewline
25 & 0.060986 & 0.5175 & 0.303203 \tabularnewline
26 & -0.024934 & -0.2116 & 0.416519 \tabularnewline
27 & 0.037543 & 0.3186 & 0.37549 \tabularnewline
28 & -0.084523 & -0.7172 & 0.237785 \tabularnewline
29 & -0.038179 & -0.324 & 0.373453 \tabularnewline
30 & -0.020771 & -0.1762 & 0.430297 \tabularnewline
31 & -0.041579 & -0.3528 & 0.362631 \tabularnewline
32 & 0.026253 & 0.2228 & 0.412175 \tabularnewline
33 & -0.061718 & -0.5237 & 0.30105 \tabularnewline
34 & -0.036564 & -0.3103 & 0.378633 \tabularnewline
35 & 0.028799 & 0.2444 & 0.403821 \tabularnewline
36 & 0.00504 & 0.0428 & 0.483005 \tabularnewline
37 & -0.020949 & -0.1778 & 0.429706 \tabularnewline
38 & 0.065489 & 0.5557 & 0.290071 \tabularnewline
39 & 0.009738 & 0.0826 & 0.467188 \tabularnewline
40 & 0.019879 & 0.1687 & 0.433261 \tabularnewline
41 & -0.029711 & -0.2521 & 0.400838 \tabularnewline
42 & 0.022784 & 0.1933 & 0.423623 \tabularnewline
43 & 0.005942 & 0.0504 & 0.479963 \tabularnewline
44 & -0.033089 & -0.2808 & 0.389847 \tabularnewline
45 & -0.02013 & -0.1708 & 0.432427 \tabularnewline
46 & 0.086397 & 0.7331 & 0.232939 \tabularnewline
47 & 0.075697 & 0.6423 & 0.261355 \tabularnewline
48 & -0.059648 & -0.5061 & 0.307157 \tabularnewline
\hline
\end{tabular}
%Source: https://freestatistics.org/blog/index.php?pk=120377&T=2

[TABLE]
[ROW][C]Partial Autocorrelation Function[/C][/ROW]
[ROW][C]Time lag k[/C][C]PACF(k)[/C][C]T-STAT[/C][C]P-value[/C][/ROW]
[ROW][C]1[/C][C]-0.539401[/C][C]-4.577[/C][C]1e-05[/C][/ROW]
[ROW][C]2[/C][C]-0.286584[/C][C]-2.4317[/C][C]0.008758[/C][/ROW]
[ROW][C]3[/C][C]-0.264032[/C][C]-2.2404[/C][C]0.014076[/C][/ROW]
[ROW][C]4[/C][C]-0.16299[/C][C]-1.383[/C][C]0.085467[/C][/ROW]
[ROW][C]5[/C][C]0.218124[/C][C]1.8508[/C][C]0.034147[/C][/ROW]
[ROW][C]6[/C][C]-0.065374[/C][C]-0.5547[/C][C]0.290403[/C][/ROW]
[ROW][C]7[/C][C]-0.112057[/C][C]-0.9508[/C][C]0.172433[/C][/ROW]
[ROW][C]8[/C][C]0.08424[/C][C]0.7148[/C][C]0.238522[/C][/ROW]
[ROW][C]9[/C][C]-0.041235[/C][C]-0.3499[/C][C]0.36372[/C][/ROW]
[ROW][C]10[/C][C]0.150877[/C][C]1.2802[/C][C]0.102286[/C][/ROW]
[ROW][C]11[/C][C]-0.555946[/C][C]-4.7174[/C][C]6e-06[/C][/ROW]
[ROW][C]12[/C][C]0.384998[/C][C]3.2668[/C][C]0.000834[/C][/ROW]
[ROW][C]13[/C][C]0.092903[/C][C]0.7883[/C][C]0.216552[/C][/ROW]
[ROW][C]14[/C][C]0.034679[/C][C]0.2943[/C][C]0.384701[/C][/ROW]
[ROW][C]15[/C][C]0.028558[/C][C]0.2423[/C][C]0.404611[/C][/ROW]
[ROW][C]16[/C][C]0.092914[/C][C]0.7884[/C][C]0.216526[/C][/ROW]
[ROW][C]17[/C][C]-0.144874[/C][C]-1.2293[/C][C]0.111482[/C][/ROW]
[ROW][C]18[/C][C]-0.03462[/C][C]-0.2938[/C][C]0.384892[/C][/ROW]
[ROW][C]19[/C][C]0.065955[/C][C]0.5596[/C][C]0.288728[/C][/ROW]
[ROW][C]20[/C][C]-0.034165[/C][C]-0.2899[/C][C]0.386363[/C][/ROW]
[ROW][C]21[/C][C]0.037936[/C][C]0.3219[/C][C]0.374232[/C][/ROW]
[ROW][C]22[/C][C]-0.125917[/C][C]-1.0684[/C][C]0.144446[/C][/ROW]
[ROW][C]23[/C][C]-0.0331[/C][C]-0.2809[/C][C]0.389811[/C][/ROW]
[ROW][C]24[/C][C]0.048857[/C][C]0.4146[/C][C]0.339845[/C][/ROW]
[ROW][C]25[/C][C]0.060986[/C][C]0.5175[/C][C]0.303203[/C][/ROW]
[ROW][C]26[/C][C]-0.024934[/C][C]-0.2116[/C][C]0.416519[/C][/ROW]
[ROW][C]27[/C][C]0.037543[/C][C]0.3186[/C][C]0.37549[/C][/ROW]
[ROW][C]28[/C][C]-0.084523[/C][C]-0.7172[/C][C]0.237785[/C][/ROW]
[ROW][C]29[/C][C]-0.038179[/C][C]-0.324[/C][C]0.373453[/C][/ROW]
[ROW][C]30[/C][C]-0.020771[/C][C]-0.1762[/C][C]0.430297[/C][/ROW]
[ROW][C]31[/C][C]-0.041579[/C][C]-0.3528[/C][C]0.362631[/C][/ROW]
[ROW][C]32[/C][C]0.026253[/C][C]0.2228[/C][C]0.412175[/C][/ROW]
[ROW][C]33[/C][C]-0.061718[/C][C]-0.5237[/C][C]0.30105[/C][/ROW]
[ROW][C]34[/C][C]-0.036564[/C][C]-0.3103[/C][C]0.378633[/C][/ROW]
[ROW][C]35[/C][C]0.028799[/C][C]0.2444[/C][C]0.403821[/C][/ROW]
[ROW][C]36[/C][C]0.00504[/C][C]0.0428[/C][C]0.483005[/C][/ROW]
[ROW][C]37[/C][C]-0.020949[/C][C]-0.1778[/C][C]0.429706[/C][/ROW]
[ROW][C]38[/C][C]0.065489[/C][C]0.5557[/C][C]0.290071[/C][/ROW]
[ROW][C]39[/C][C]0.009738[/C][C]0.0826[/C][C]0.467188[/C][/ROW]
[ROW][C]40[/C][C]0.019879[/C][C]0.1687[/C][C]0.433261[/C][/ROW]
[ROW][C]41[/C][C]-0.029711[/C][C]-0.2521[/C][C]0.400838[/C][/ROW]
[ROW][C]42[/C][C]0.022784[/C][C]0.1933[/C][C]0.423623[/C][/ROW]
[ROW][C]43[/C][C]0.005942[/C][C]0.0504[/C][C]0.479963[/C][/ROW]
[ROW][C]44[/C][C]-0.033089[/C][C]-0.2808[/C][C]0.389847[/C][/ROW]
[ROW][C]45[/C][C]-0.02013[/C][C]-0.1708[/C][C]0.432427[/C][/ROW]
[ROW][C]46[/C][C]0.086397[/C][C]0.7331[/C][C]0.232939[/C][/ROW]
[ROW][C]47[/C][C]0.075697[/C][C]0.6423[/C][C]0.261355[/C][/ROW]
[ROW][C]48[/C][C]-0.059648[/C][C]-0.5061[/C][C]0.307157[/C][/ROW]
[/TABLE]
Source: https://freestatistics.org/blog/index.php?pk=120377&T=2

Globally Unique Identifier (entire table): ba.freestatistics.org/blog/index.php?pk=120377&T=2

As an alternative you can also use a QR Code:  

The GUIDs for individual cells are displayed in the table below:

Partial Autocorrelation Function
Time lag kPACF(k)T-STATP-value
1-0.539401-4.5771e-05
2-0.286584-2.43170.008758
3-0.264032-2.24040.014076
4-0.16299-1.3830.085467
50.2181241.85080.034147
6-0.065374-0.55470.290403
7-0.112057-0.95080.172433
80.084240.71480.238522
9-0.041235-0.34990.36372
100.1508771.28020.102286
11-0.555946-4.71746e-06
120.3849983.26680.000834
130.0929030.78830.216552
140.0346790.29430.384701
150.0285580.24230.404611
160.0929140.78840.216526
17-0.144874-1.22930.111482
18-0.03462-0.29380.384892
190.0659550.55960.288728
20-0.034165-0.28990.386363
210.0379360.32190.374232
22-0.125917-1.06840.144446
23-0.0331-0.28090.389811
240.0488570.41460.339845
250.0609860.51750.303203
26-0.024934-0.21160.416519
270.0375430.31860.37549
28-0.084523-0.71720.237785
29-0.038179-0.3240.373453
30-0.020771-0.17620.430297
31-0.041579-0.35280.362631
320.0262530.22280.412175
33-0.061718-0.52370.30105
34-0.036564-0.31030.378633
350.0287990.24440.403821
360.005040.04280.483005
37-0.020949-0.17780.429706
380.0654890.55570.290071
390.0097380.08260.467188
400.0198790.16870.433261
41-0.029711-0.25210.400838
420.0227840.19330.423623
430.0059420.05040.479963
44-0.033089-0.28080.389847
45-0.02013-0.17080.432427
460.0863970.73310.232939
470.0756970.64230.261355
48-0.059648-0.50610.307157


Parameters (Session):
par1 = 48 ; par2 = 1 ; par3 = 1 ; par4 = 0 ; par5 = 12 ; par6 = White Noise ; par7 = 0.95 ;
Parameters (R input):
par1 = 48 ; par2 = 1 ; par3 = 1 ; par4 = 0 ; par5 = 12 ; par6 = White Noise ; par7 = 0.95 ; par8 = ;
R code (references can be found in the software module):
if (par1 == 'Default') {
par1 = 10*log10(length(x))
} else {
par1 <- as.numeric(par1)
}
par2 <- as.numeric(par2)
par3 <- as.numeric(par3)
par4 <- as.numeric(par4)
par5 <- as.numeric(par5)
if (par6 == 'White Noise') par6 <- 'white' else par6 <- 'ma'
par7 <- as.numeric(par7)
if (par8 != '') par8 <- as.numeric(par8)
ox <- x
if (par8 == '') {
if (par2 == 0) {
x <- log(x)
} else {
x <- (x ^ par2 - 1) / par2
}
} else {
x <- log(x,base=par8)
}
if (par3 > 0) x <- diff(x,lag=1,difference=par3)
if (par4 > 0) x <- diff(x,lag=par5,difference=par4)
bitmap(file='picts.png')
op <- par(mfrow=c(2,1))
plot(ox,type='l',main='Original Time Series',xlab='time',ylab='value')
if (par8=='') {
mytitle <- paste('Working Time Series (lambda=',par2,', d=',par3,', D=',par4,')',sep='')
mysub <- paste('(lambda=',par2,', d=',par3,', D=',par4,', CI=', par7, ', CI type=',par6,')',sep='')
} else {
mytitle <- paste('Working Time Series (base=',par8,', d=',par3,', D=',par4,')',sep='')
mysub <- paste('(base=',par8,', d=',par3,', D=',par4,', CI=', par7, ', CI type=',par6,')',sep='')
}
plot(x,type='l', main=mytitle,xlab='time',ylab='value')
par(op)
dev.off()
bitmap(file='pic1.png')
racf <- acf(x, par1, main='Autocorrelation', xlab='time lag', ylab='ACF', ci.type=par6, ci=par7, sub=mysub)
dev.off()
bitmap(file='pic2.png')
rpacf <- pacf(x,par1,main='Partial Autocorrelation',xlab='lags',ylab='PACF',sub=mysub)
dev.off()
(myacf <- c(racf$acf))
(mypacf <- c(rpacf$acf))
lengthx <- length(x)
sqrtn <- sqrt(lengthx)
load(file='createtable')
a<-table.start()
a<-table.row.start(a)
a<-table.element(a,'Autocorrelation Function',4,TRUE)
a<-table.row.end(a)
a<-table.row.start(a)
a<-table.element(a,'Time lag k',header=TRUE)
a<-table.element(a,hyperlink('basics.htm','ACF(k)','click here for more information about the Autocorrelation Function'),header=TRUE)
a<-table.element(a,'T-STAT',header=TRUE)
a<-table.element(a,'P-value',header=TRUE)
a<-table.row.end(a)
for (i in 2:(par1+1)) {
a<-table.row.start(a)
a<-table.element(a,i-1,header=TRUE)
a<-table.element(a,round(myacf[i],6))
mytstat <- myacf[i]*sqrtn
a<-table.element(a,round(mytstat,4))
a<-table.element(a,round(1-pt(abs(mytstat),lengthx),6))
a<-table.row.end(a)
}
a<-table.end(a)
table.save(a,file='mytable.tab')
a<-table.start()
a<-table.row.start(a)
a<-table.element(a,'Partial Autocorrelation Function',4,TRUE)
a<-table.row.end(a)
a<-table.row.start(a)
a<-table.element(a,'Time lag k',header=TRUE)
a<-table.element(a,hyperlink('basics.htm','PACF(k)','click here for more information about the Partial Autocorrelation Function'),header=TRUE)
a<-table.element(a,'T-STAT',header=TRUE)
a<-table.element(a,'P-value',header=TRUE)
a<-table.row.end(a)
for (i in 1:par1) {
a<-table.row.start(a)
a<-table.element(a,i,header=TRUE)
a<-table.element(a,round(mypacf[i],6))
mytstat <- mypacf[i]*sqrtn
a<-table.element(a,round(mytstat,4))
a<-table.element(a,round(1-pt(abs(mytstat),lengthx),6))
a<-table.row.end(a)
}
a<-table.end(a)
table.save(a,file='mytable1.tab')