Free Statistics

of Irreproducible Research!

Author's title

Author*Unverified author*
R Software Modulerwasp_autocorrelation.wasp
Title produced by software(Partial) Autocorrelation Function
Date of computationWed, 06 Apr 2011 12:40:38 +0000
Cite this page as followsStatistical Computations at FreeStatistics.org, Office for Research Development and Education, URL https://freestatistics.org/blog/index.php?v=date/2011/Apr/06/t1302093430mmoamjyomymjhfq.htm/, Retrieved Thu, 09 May 2024 05:19:54 +0000
Statistical Computations at FreeStatistics.org, Office for Research Development and Education, URL https://freestatistics.org/blog/index.php?pk=120350, Retrieved Thu, 09 May 2024 05:19:54 +0000
QR Codes:

Original text written by user:
IsPrivate?No (this computation is public)
User-defined keywordsKDGP2W12
Estimated Impact176
Family? (F = Feedback message, R = changed R code, M = changed R Module, P = changed Parameters, D = changed Data)
-       [(Partial) Autocorrelation Function] [Eigen cijferreeks...] [2011-04-06 12:40:38] [fd50f0a5b7e7c5d033b634ea62655f13] [Current]
Feedback Forum

Post a new message
Dataseries X:
1686
1591
2304
1712
1471
1377
1966
2453
1984
2596
4087
5179
1530
1523
1633
1976
1170
1480
1781
2472
1981
2273
3857
4551
1510
1329
1518
1790
1537
1449
1954
1897
1706
2514
3593
4524
1609
1638
2030
1375
1320
1245
1600
2298
2191
2511
3440
4923
1609
1435
2061
1789
1567
1404
1597
3159
1759
2504
4273
5274
1771
1682
1846
1589
1896
1379
1645
2512
1771
3727
4388
5434
1606
1523
1577
1605
1765
1403
2584
3318
1562
2349
3987
5891
1389
1442
1548
1935
1518
1250
1847
1930
2638
3114
4405
7242
1853
1779
2108
2336
1728
1661
2230
1645
2421
3740
4988
6757
1757
1394
1982
1650
1654
1406
1971
1968
2608
3845
4514
6694
1720
1321
1859
1628
1615
1457
1899
1605
2424
3116
4286
6047
1902
2049
1874
1279
1432
1540
2214
1857
2408
3252
3627
6153
1577
1667
1993
1997
1783
1625
2076
1773
2377
3088
4096
6119
1494
1564
1898
2121
1831
1515
2048
2795
1749
3339
4227
6410
1197
1968
1720
1725
1674
1693
2031
1495
2968
3385
3729
5999
1070
1402
1897
1862
1670
1688
2031


Summary of computational transaction
Raw Inputview raw input (R code)
Raw Outputview raw output of R engine
Computing time1 seconds
R Server'Gwilym Jenkins' @ www.wessa.org

\begin{tabular}{lllllllll}
\hline
Summary of computational transaction \tabularnewline
Raw Input & view raw input (R code)  \tabularnewline
Raw Output & view raw output of R engine  \tabularnewline
Computing time & 1 seconds \tabularnewline
R Server & 'Gwilym Jenkins' @ www.wessa.org \tabularnewline
\hline
\end{tabular}
%Source: https://freestatistics.org/blog/index.php?pk=120350&T=0

[TABLE]
[ROW][C]Summary of computational transaction[/C][/ROW]
[ROW][C]Raw Input[/C][C]view raw input (R code) [/C][/ROW]
[ROW][C]Raw Output[/C][C]view raw output of R engine [/C][/ROW]
[ROW][C]Computing time[/C][C]1 seconds[/C][/ROW]
[ROW][C]R Server[/C][C]'Gwilym Jenkins' @ www.wessa.org[/C][/ROW]
[/TABLE]
Source: https://freestatistics.org/blog/index.php?pk=120350&T=0

Globally Unique Identifier (entire table): ba.freestatistics.org/blog/index.php?pk=120350&T=0

As an alternative you can also use a QR Code:  

The GUIDs for individual cells are displayed in the table below:

Summary of computational transaction
Raw Inputview raw input (R code)
Raw Outputview raw output of R engine
Computing time1 seconds
R Server'Gwilym Jenkins' @ www.wessa.org


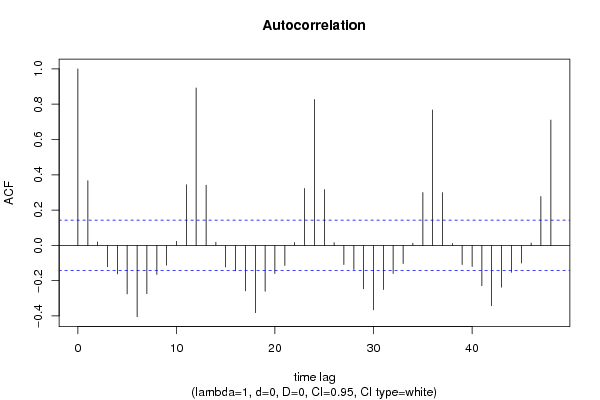
Autocorrelation Function
Time lag kACF(k)T-STATP-value
10.3668285.01631e-06
20.0194030.26530.395523
3-0.121173-1.6570.049597
4-0.161524-2.20880.014201
5-0.275363-3.76550.000111
6-0.403815-5.52210
7-0.273758-3.74360.000121
8-0.16446-2.2490.012841
9-0.112242-1.53490.063251
100.0229570.31390.376961
110.3440064.70422e-06
120.89226412.20150
130.3413734.66823e-06
140.0177410.24260.404291
15-0.12309-1.68320.047
16-0.143776-1.96610.025383
17-0.257546-3.52190.000269
18-0.381532-5.21740
19-0.260054-3.55620.000238
20-0.15938-2.17950.015273
21-0.113311-1.54950.061475
220.0169230.23140.408622
230.3230434.41758e-06
240.82689311.30760
250.3162414.32451.2e-05
260.0157980.2160.414596
27-0.108952-1.48990.068968
28-0.136182-1.86230.032068
29-0.246048-3.36470.000465
30-0.365339-4.99591e-06
31-0.250187-3.42130.000383
32-0.159149-2.17630.015392
33-0.102874-1.40680.080576
340.0128140.17520.430545
350.2993084.0933.2e-05
360.76780410.49960
370.2994174.09453.1e-05
380.0109070.14910.440799
39-0.108497-1.48370.069789
40-0.119939-1.64010.051329
41-0.228344-3.12260.001039
42-0.34215-4.67883e-06
43-0.236603-3.23550.000718
44-0.152535-2.08590.019173
45-0.10025-1.37090.086026
460.0135470.18520.426618
470.2767853.7850.000103
480.7106739.71830

\begin{tabular}{lllllllll}
\hline
Autocorrelation Function \tabularnewline
Time lag k & ACF(k) & T-STAT & P-value \tabularnewline
1 & 0.366828 & 5.0163 & 1e-06 \tabularnewline
2 & 0.019403 & 0.2653 & 0.395523 \tabularnewline
3 & -0.121173 & -1.657 & 0.049597 \tabularnewline
4 & -0.161524 & -2.2088 & 0.014201 \tabularnewline
5 & -0.275363 & -3.7655 & 0.000111 \tabularnewline
6 & -0.403815 & -5.5221 & 0 \tabularnewline
7 & -0.273758 & -3.7436 & 0.000121 \tabularnewline
8 & -0.16446 & -2.249 & 0.012841 \tabularnewline
9 & -0.112242 & -1.5349 & 0.063251 \tabularnewline
10 & 0.022957 & 0.3139 & 0.376961 \tabularnewline
11 & 0.344006 & 4.7042 & 2e-06 \tabularnewline
12 & 0.892264 & 12.2015 & 0 \tabularnewline
13 & 0.341373 & 4.6682 & 3e-06 \tabularnewline
14 & 0.017741 & 0.2426 & 0.404291 \tabularnewline
15 & -0.12309 & -1.6832 & 0.047 \tabularnewline
16 & -0.143776 & -1.9661 & 0.025383 \tabularnewline
17 & -0.257546 & -3.5219 & 0.000269 \tabularnewline
18 & -0.381532 & -5.2174 & 0 \tabularnewline
19 & -0.260054 & -3.5562 & 0.000238 \tabularnewline
20 & -0.15938 & -2.1795 & 0.015273 \tabularnewline
21 & -0.113311 & -1.5495 & 0.061475 \tabularnewline
22 & 0.016923 & 0.2314 & 0.408622 \tabularnewline
23 & 0.323043 & 4.4175 & 8e-06 \tabularnewline
24 & 0.826893 & 11.3076 & 0 \tabularnewline
25 & 0.316241 & 4.3245 & 1.2e-05 \tabularnewline
26 & 0.015798 & 0.216 & 0.414596 \tabularnewline
27 & -0.108952 & -1.4899 & 0.068968 \tabularnewline
28 & -0.136182 & -1.8623 & 0.032068 \tabularnewline
29 & -0.246048 & -3.3647 & 0.000465 \tabularnewline
30 & -0.365339 & -4.9959 & 1e-06 \tabularnewline
31 & -0.250187 & -3.4213 & 0.000383 \tabularnewline
32 & -0.159149 & -2.1763 & 0.015392 \tabularnewline
33 & -0.102874 & -1.4068 & 0.080576 \tabularnewline
34 & 0.012814 & 0.1752 & 0.430545 \tabularnewline
35 & 0.299308 & 4.093 & 3.2e-05 \tabularnewline
36 & 0.767804 & 10.4996 & 0 \tabularnewline
37 & 0.299417 & 4.0945 & 3.1e-05 \tabularnewline
38 & 0.010907 & 0.1491 & 0.440799 \tabularnewline
39 & -0.108497 & -1.4837 & 0.069789 \tabularnewline
40 & -0.119939 & -1.6401 & 0.051329 \tabularnewline
41 & -0.228344 & -3.1226 & 0.001039 \tabularnewline
42 & -0.34215 & -4.6788 & 3e-06 \tabularnewline
43 & -0.236603 & -3.2355 & 0.000718 \tabularnewline
44 & -0.152535 & -2.0859 & 0.019173 \tabularnewline
45 & -0.10025 & -1.3709 & 0.086026 \tabularnewline
46 & 0.013547 & 0.1852 & 0.426618 \tabularnewline
47 & 0.276785 & 3.785 & 0.000103 \tabularnewline
48 & 0.710673 & 9.7183 & 0 \tabularnewline
\hline
\end{tabular}
%Source: https://freestatistics.org/blog/index.php?pk=120350&T=1

[TABLE]
[ROW][C]Autocorrelation Function[/C][/ROW]
[ROW][C]Time lag k[/C][C]ACF(k)[/C][C]T-STAT[/C][C]P-value[/C][/ROW]
[ROW][C]1[/C][C]0.366828[/C][C]5.0163[/C][C]1e-06[/C][/ROW]
[ROW][C]2[/C][C]0.019403[/C][C]0.2653[/C][C]0.395523[/C][/ROW]
[ROW][C]3[/C][C]-0.121173[/C][C]-1.657[/C][C]0.049597[/C][/ROW]
[ROW][C]4[/C][C]-0.161524[/C][C]-2.2088[/C][C]0.014201[/C][/ROW]
[ROW][C]5[/C][C]-0.275363[/C][C]-3.7655[/C][C]0.000111[/C][/ROW]
[ROW][C]6[/C][C]-0.403815[/C][C]-5.5221[/C][C]0[/C][/ROW]
[ROW][C]7[/C][C]-0.273758[/C][C]-3.7436[/C][C]0.000121[/C][/ROW]
[ROW][C]8[/C][C]-0.16446[/C][C]-2.249[/C][C]0.012841[/C][/ROW]
[ROW][C]9[/C][C]-0.112242[/C][C]-1.5349[/C][C]0.063251[/C][/ROW]
[ROW][C]10[/C][C]0.022957[/C][C]0.3139[/C][C]0.376961[/C][/ROW]
[ROW][C]11[/C][C]0.344006[/C][C]4.7042[/C][C]2e-06[/C][/ROW]
[ROW][C]12[/C][C]0.892264[/C][C]12.2015[/C][C]0[/C][/ROW]
[ROW][C]13[/C][C]0.341373[/C][C]4.6682[/C][C]3e-06[/C][/ROW]
[ROW][C]14[/C][C]0.017741[/C][C]0.2426[/C][C]0.404291[/C][/ROW]
[ROW][C]15[/C][C]-0.12309[/C][C]-1.6832[/C][C]0.047[/C][/ROW]
[ROW][C]16[/C][C]-0.143776[/C][C]-1.9661[/C][C]0.025383[/C][/ROW]
[ROW][C]17[/C][C]-0.257546[/C][C]-3.5219[/C][C]0.000269[/C][/ROW]
[ROW][C]18[/C][C]-0.381532[/C][C]-5.2174[/C][C]0[/C][/ROW]
[ROW][C]19[/C][C]-0.260054[/C][C]-3.5562[/C][C]0.000238[/C][/ROW]
[ROW][C]20[/C][C]-0.15938[/C][C]-2.1795[/C][C]0.015273[/C][/ROW]
[ROW][C]21[/C][C]-0.113311[/C][C]-1.5495[/C][C]0.061475[/C][/ROW]
[ROW][C]22[/C][C]0.016923[/C][C]0.2314[/C][C]0.408622[/C][/ROW]
[ROW][C]23[/C][C]0.323043[/C][C]4.4175[/C][C]8e-06[/C][/ROW]
[ROW][C]24[/C][C]0.826893[/C][C]11.3076[/C][C]0[/C][/ROW]
[ROW][C]25[/C][C]0.316241[/C][C]4.3245[/C][C]1.2e-05[/C][/ROW]
[ROW][C]26[/C][C]0.015798[/C][C]0.216[/C][C]0.414596[/C][/ROW]
[ROW][C]27[/C][C]-0.108952[/C][C]-1.4899[/C][C]0.068968[/C][/ROW]
[ROW][C]28[/C][C]-0.136182[/C][C]-1.8623[/C][C]0.032068[/C][/ROW]
[ROW][C]29[/C][C]-0.246048[/C][C]-3.3647[/C][C]0.000465[/C][/ROW]
[ROW][C]30[/C][C]-0.365339[/C][C]-4.9959[/C][C]1e-06[/C][/ROW]
[ROW][C]31[/C][C]-0.250187[/C][C]-3.4213[/C][C]0.000383[/C][/ROW]
[ROW][C]32[/C][C]-0.159149[/C][C]-2.1763[/C][C]0.015392[/C][/ROW]
[ROW][C]33[/C][C]-0.102874[/C][C]-1.4068[/C][C]0.080576[/C][/ROW]
[ROW][C]34[/C][C]0.012814[/C][C]0.1752[/C][C]0.430545[/C][/ROW]
[ROW][C]35[/C][C]0.299308[/C][C]4.093[/C][C]3.2e-05[/C][/ROW]
[ROW][C]36[/C][C]0.767804[/C][C]10.4996[/C][C]0[/C][/ROW]
[ROW][C]37[/C][C]0.299417[/C][C]4.0945[/C][C]3.1e-05[/C][/ROW]
[ROW][C]38[/C][C]0.010907[/C][C]0.1491[/C][C]0.440799[/C][/ROW]
[ROW][C]39[/C][C]-0.108497[/C][C]-1.4837[/C][C]0.069789[/C][/ROW]
[ROW][C]40[/C][C]-0.119939[/C][C]-1.6401[/C][C]0.051329[/C][/ROW]
[ROW][C]41[/C][C]-0.228344[/C][C]-3.1226[/C][C]0.001039[/C][/ROW]
[ROW][C]42[/C][C]-0.34215[/C][C]-4.6788[/C][C]3e-06[/C][/ROW]
[ROW][C]43[/C][C]-0.236603[/C][C]-3.2355[/C][C]0.000718[/C][/ROW]
[ROW][C]44[/C][C]-0.152535[/C][C]-2.0859[/C][C]0.019173[/C][/ROW]
[ROW][C]45[/C][C]-0.10025[/C][C]-1.3709[/C][C]0.086026[/C][/ROW]
[ROW][C]46[/C][C]0.013547[/C][C]0.1852[/C][C]0.426618[/C][/ROW]
[ROW][C]47[/C][C]0.276785[/C][C]3.785[/C][C]0.000103[/C][/ROW]
[ROW][C]48[/C][C]0.710673[/C][C]9.7183[/C][C]0[/C][/ROW]
[/TABLE]
Source: https://freestatistics.org/blog/index.php?pk=120350&T=1

Globally Unique Identifier (entire table): ba.freestatistics.org/blog/index.php?pk=120350&T=1

As an alternative you can also use a QR Code:  

The GUIDs for individual cells are displayed in the table below:

Autocorrelation Function
Time lag kACF(k)T-STATP-value
10.3668285.01631e-06
20.0194030.26530.395523
3-0.121173-1.6570.049597
4-0.161524-2.20880.014201
5-0.275363-3.76550.000111
6-0.403815-5.52210
7-0.273758-3.74360.000121
8-0.16446-2.2490.012841
9-0.112242-1.53490.063251
100.0229570.31390.376961
110.3440064.70422e-06
120.89226412.20150
130.3413734.66823e-06
140.0177410.24260.404291
15-0.12309-1.68320.047
16-0.143776-1.96610.025383
17-0.257546-3.52190.000269
18-0.381532-5.21740
19-0.260054-3.55620.000238
20-0.15938-2.17950.015273
21-0.113311-1.54950.061475
220.0169230.23140.408622
230.3230434.41758e-06
240.82689311.30760
250.3162414.32451.2e-05
260.0157980.2160.414596
27-0.108952-1.48990.068968
28-0.136182-1.86230.032068
29-0.246048-3.36470.000465
30-0.365339-4.99591e-06
31-0.250187-3.42130.000383
32-0.159149-2.17630.015392
33-0.102874-1.40680.080576
340.0128140.17520.430545
350.2993084.0933.2e-05
360.76780410.49960
370.2994174.09453.1e-05
380.0109070.14910.440799
39-0.108497-1.48370.069789
40-0.119939-1.64010.051329
41-0.228344-3.12260.001039
42-0.34215-4.67883e-06
43-0.236603-3.23550.000718
44-0.152535-2.08590.019173
45-0.10025-1.37090.086026
460.0135470.18520.426618
470.2767853.7850.000103
480.7106739.71830


Partial Autocorrelation Function
Time lag kPACF(k)T-STATP-value
10.3668285.01631e-06
2-0.133065-1.81960.035207
3-0.094606-1.29370.09868
4-0.0904-1.23620.108966
5-0.227063-3.1050.001099
6-0.310437-4.24521.7e-05
7-0.123853-1.69370.045997
8-0.208876-2.85630.002385
9-0.264504-3.6170.000192
10-0.165132-2.25810.012546
110.1277231.74660.041175
120.82208511.24180
13-0.201251-2.75210.003253
140.028670.39210.347731
15-0.012156-0.16620.434075
160.0566150.77420.219895
170.038930.53240.297556
180.0526170.71950.236356
190.0159660.21830.413706
200.0116550.15940.436771
21-0.059627-0.81540.207943
22-0.014093-0.19270.423695
230.0186840.25550.399308
240.1530382.09280.01886
25-0.083955-1.14810.126204
260.0203490.27830.390556
270.0582310.79630.213436
28-0.070184-0.95980.169208
290.0093060.12730.449439
30-0.006193-0.08470.4663
31-0.00377-0.05160.479468
32-0.018714-0.25590.399149
330.0473180.64710.25919
34-0.04166-0.56970.284784
35-0.018507-0.25310.40024
360.0289280.39560.34643
370.0005670.00770.496912
38-0.032396-0.4430.329135
39-0.022684-0.31020.378379
400.0345320.47220.318661
410.0097320.13310.447133
420.0259350.35470.361624
43-0.010851-0.14840.441101
440.0183410.25080.401117
45-0.030195-0.41290.340075
460.0359520.49160.311778
47-0.027763-0.37970.352315
480.031350.42870.334317

\begin{tabular}{lllllllll}
\hline
Partial Autocorrelation Function \tabularnewline
Time lag k & PACF(k) & T-STAT & P-value \tabularnewline
1 & 0.366828 & 5.0163 & 1e-06 \tabularnewline
2 & -0.133065 & -1.8196 & 0.035207 \tabularnewline
3 & -0.094606 & -1.2937 & 0.09868 \tabularnewline
4 & -0.0904 & -1.2362 & 0.108966 \tabularnewline
5 & -0.227063 & -3.105 & 0.001099 \tabularnewline
6 & -0.310437 & -4.2452 & 1.7e-05 \tabularnewline
7 & -0.123853 & -1.6937 & 0.045997 \tabularnewline
8 & -0.208876 & -2.8563 & 0.002385 \tabularnewline
9 & -0.264504 & -3.617 & 0.000192 \tabularnewline
10 & -0.165132 & -2.2581 & 0.012546 \tabularnewline
11 & 0.127723 & 1.7466 & 0.041175 \tabularnewline
12 & 0.822085 & 11.2418 & 0 \tabularnewline
13 & -0.201251 & -2.7521 & 0.003253 \tabularnewline
14 & 0.02867 & 0.3921 & 0.347731 \tabularnewline
15 & -0.012156 & -0.1662 & 0.434075 \tabularnewline
16 & 0.056615 & 0.7742 & 0.219895 \tabularnewline
17 & 0.03893 & 0.5324 & 0.297556 \tabularnewline
18 & 0.052617 & 0.7195 & 0.236356 \tabularnewline
19 & 0.015966 & 0.2183 & 0.413706 \tabularnewline
20 & 0.011655 & 0.1594 & 0.436771 \tabularnewline
21 & -0.059627 & -0.8154 & 0.207943 \tabularnewline
22 & -0.014093 & -0.1927 & 0.423695 \tabularnewline
23 & 0.018684 & 0.2555 & 0.399308 \tabularnewline
24 & 0.153038 & 2.0928 & 0.01886 \tabularnewline
25 & -0.083955 & -1.1481 & 0.126204 \tabularnewline
26 & 0.020349 & 0.2783 & 0.390556 \tabularnewline
27 & 0.058231 & 0.7963 & 0.213436 \tabularnewline
28 & -0.070184 & -0.9598 & 0.169208 \tabularnewline
29 & 0.009306 & 0.1273 & 0.449439 \tabularnewline
30 & -0.006193 & -0.0847 & 0.4663 \tabularnewline
31 & -0.00377 & -0.0516 & 0.479468 \tabularnewline
32 & -0.018714 & -0.2559 & 0.399149 \tabularnewline
33 & 0.047318 & 0.6471 & 0.25919 \tabularnewline
34 & -0.04166 & -0.5697 & 0.284784 \tabularnewline
35 & -0.018507 & -0.2531 & 0.40024 \tabularnewline
36 & 0.028928 & 0.3956 & 0.34643 \tabularnewline
37 & 0.000567 & 0.0077 & 0.496912 \tabularnewline
38 & -0.032396 & -0.443 & 0.329135 \tabularnewline
39 & -0.022684 & -0.3102 & 0.378379 \tabularnewline
40 & 0.034532 & 0.4722 & 0.318661 \tabularnewline
41 & 0.009732 & 0.1331 & 0.447133 \tabularnewline
42 & 0.025935 & 0.3547 & 0.361624 \tabularnewline
43 & -0.010851 & -0.1484 & 0.441101 \tabularnewline
44 & 0.018341 & 0.2508 & 0.401117 \tabularnewline
45 & -0.030195 & -0.4129 & 0.340075 \tabularnewline
46 & 0.035952 & 0.4916 & 0.311778 \tabularnewline
47 & -0.027763 & -0.3797 & 0.352315 \tabularnewline
48 & 0.03135 & 0.4287 & 0.334317 \tabularnewline
\hline
\end{tabular}
%Source: https://freestatistics.org/blog/index.php?pk=120350&T=2

[TABLE]
[ROW][C]Partial Autocorrelation Function[/C][/ROW]
[ROW][C]Time lag k[/C][C]PACF(k)[/C][C]T-STAT[/C][C]P-value[/C][/ROW]
[ROW][C]1[/C][C]0.366828[/C][C]5.0163[/C][C]1e-06[/C][/ROW]
[ROW][C]2[/C][C]-0.133065[/C][C]-1.8196[/C][C]0.035207[/C][/ROW]
[ROW][C]3[/C][C]-0.094606[/C][C]-1.2937[/C][C]0.09868[/C][/ROW]
[ROW][C]4[/C][C]-0.0904[/C][C]-1.2362[/C][C]0.108966[/C][/ROW]
[ROW][C]5[/C][C]-0.227063[/C][C]-3.105[/C][C]0.001099[/C][/ROW]
[ROW][C]6[/C][C]-0.310437[/C][C]-4.2452[/C][C]1.7e-05[/C][/ROW]
[ROW][C]7[/C][C]-0.123853[/C][C]-1.6937[/C][C]0.045997[/C][/ROW]
[ROW][C]8[/C][C]-0.208876[/C][C]-2.8563[/C][C]0.002385[/C][/ROW]
[ROW][C]9[/C][C]-0.264504[/C][C]-3.617[/C][C]0.000192[/C][/ROW]
[ROW][C]10[/C][C]-0.165132[/C][C]-2.2581[/C][C]0.012546[/C][/ROW]
[ROW][C]11[/C][C]0.127723[/C][C]1.7466[/C][C]0.041175[/C][/ROW]
[ROW][C]12[/C][C]0.822085[/C][C]11.2418[/C][C]0[/C][/ROW]
[ROW][C]13[/C][C]-0.201251[/C][C]-2.7521[/C][C]0.003253[/C][/ROW]
[ROW][C]14[/C][C]0.02867[/C][C]0.3921[/C][C]0.347731[/C][/ROW]
[ROW][C]15[/C][C]-0.012156[/C][C]-0.1662[/C][C]0.434075[/C][/ROW]
[ROW][C]16[/C][C]0.056615[/C][C]0.7742[/C][C]0.219895[/C][/ROW]
[ROW][C]17[/C][C]0.03893[/C][C]0.5324[/C][C]0.297556[/C][/ROW]
[ROW][C]18[/C][C]0.052617[/C][C]0.7195[/C][C]0.236356[/C][/ROW]
[ROW][C]19[/C][C]0.015966[/C][C]0.2183[/C][C]0.413706[/C][/ROW]
[ROW][C]20[/C][C]0.011655[/C][C]0.1594[/C][C]0.436771[/C][/ROW]
[ROW][C]21[/C][C]-0.059627[/C][C]-0.8154[/C][C]0.207943[/C][/ROW]
[ROW][C]22[/C][C]-0.014093[/C][C]-0.1927[/C][C]0.423695[/C][/ROW]
[ROW][C]23[/C][C]0.018684[/C][C]0.2555[/C][C]0.399308[/C][/ROW]
[ROW][C]24[/C][C]0.153038[/C][C]2.0928[/C][C]0.01886[/C][/ROW]
[ROW][C]25[/C][C]-0.083955[/C][C]-1.1481[/C][C]0.126204[/C][/ROW]
[ROW][C]26[/C][C]0.020349[/C][C]0.2783[/C][C]0.390556[/C][/ROW]
[ROW][C]27[/C][C]0.058231[/C][C]0.7963[/C][C]0.213436[/C][/ROW]
[ROW][C]28[/C][C]-0.070184[/C][C]-0.9598[/C][C]0.169208[/C][/ROW]
[ROW][C]29[/C][C]0.009306[/C][C]0.1273[/C][C]0.449439[/C][/ROW]
[ROW][C]30[/C][C]-0.006193[/C][C]-0.0847[/C][C]0.4663[/C][/ROW]
[ROW][C]31[/C][C]-0.00377[/C][C]-0.0516[/C][C]0.479468[/C][/ROW]
[ROW][C]32[/C][C]-0.018714[/C][C]-0.2559[/C][C]0.399149[/C][/ROW]
[ROW][C]33[/C][C]0.047318[/C][C]0.6471[/C][C]0.25919[/C][/ROW]
[ROW][C]34[/C][C]-0.04166[/C][C]-0.5697[/C][C]0.284784[/C][/ROW]
[ROW][C]35[/C][C]-0.018507[/C][C]-0.2531[/C][C]0.40024[/C][/ROW]
[ROW][C]36[/C][C]0.028928[/C][C]0.3956[/C][C]0.34643[/C][/ROW]
[ROW][C]37[/C][C]0.000567[/C][C]0.0077[/C][C]0.496912[/C][/ROW]
[ROW][C]38[/C][C]-0.032396[/C][C]-0.443[/C][C]0.329135[/C][/ROW]
[ROW][C]39[/C][C]-0.022684[/C][C]-0.3102[/C][C]0.378379[/C][/ROW]
[ROW][C]40[/C][C]0.034532[/C][C]0.4722[/C][C]0.318661[/C][/ROW]
[ROW][C]41[/C][C]0.009732[/C][C]0.1331[/C][C]0.447133[/C][/ROW]
[ROW][C]42[/C][C]0.025935[/C][C]0.3547[/C][C]0.361624[/C][/ROW]
[ROW][C]43[/C][C]-0.010851[/C][C]-0.1484[/C][C]0.441101[/C][/ROW]
[ROW][C]44[/C][C]0.018341[/C][C]0.2508[/C][C]0.401117[/C][/ROW]
[ROW][C]45[/C][C]-0.030195[/C][C]-0.4129[/C][C]0.340075[/C][/ROW]
[ROW][C]46[/C][C]0.035952[/C][C]0.4916[/C][C]0.311778[/C][/ROW]
[ROW][C]47[/C][C]-0.027763[/C][C]-0.3797[/C][C]0.352315[/C][/ROW]
[ROW][C]48[/C][C]0.03135[/C][C]0.4287[/C][C]0.334317[/C][/ROW]
[/TABLE]
Source: https://freestatistics.org/blog/index.php?pk=120350&T=2

Globally Unique Identifier (entire table): ba.freestatistics.org/blog/index.php?pk=120350&T=2

As an alternative you can also use a QR Code:  

The GUIDs for individual cells are displayed in the table below:

Partial Autocorrelation Function
Time lag kPACF(k)T-STATP-value
10.3668285.01631e-06
2-0.133065-1.81960.035207
3-0.094606-1.29370.09868
4-0.0904-1.23620.108966
5-0.227063-3.1050.001099
6-0.310437-4.24521.7e-05
7-0.123853-1.69370.045997
8-0.208876-2.85630.002385
9-0.264504-3.6170.000192
10-0.165132-2.25810.012546
110.1277231.74660.041175
120.82208511.24180
13-0.201251-2.75210.003253
140.028670.39210.347731
15-0.012156-0.16620.434075
160.0566150.77420.219895
170.038930.53240.297556
180.0526170.71950.236356
190.0159660.21830.413706
200.0116550.15940.436771
21-0.059627-0.81540.207943
22-0.014093-0.19270.423695
230.0186840.25550.399308
240.1530382.09280.01886
25-0.083955-1.14810.126204
260.0203490.27830.390556
270.0582310.79630.213436
28-0.070184-0.95980.169208
290.0093060.12730.449439
30-0.006193-0.08470.4663
31-0.00377-0.05160.479468
32-0.018714-0.25590.399149
330.0473180.64710.25919
34-0.04166-0.56970.284784
35-0.018507-0.25310.40024
360.0289280.39560.34643
370.0005670.00770.496912
38-0.032396-0.4430.329135
39-0.022684-0.31020.378379
400.0345320.47220.318661
410.0097320.13310.447133
420.0259350.35470.361624
43-0.010851-0.14840.441101
440.0183410.25080.401117
45-0.030195-0.41290.340075
460.0359520.49160.311778
47-0.027763-0.37970.352315
480.031350.42870.334317


Parameters (Session):
par1 = 48 ; par2 = 1 ; par3 = 0 ; par4 = 0 ; par5 = 12 ; par6 = White Noise ; par7 = 0.95 ;
Parameters (R input):
par1 = 48 ; par2 = 1 ; par3 = 0 ; par4 = 0 ; par5 = 12 ; par6 = White Noise ; par7 = 0.95 ; par8 = ;
R code (references can be found in the software module):
if (par1 == 'Default') {
par1 = 10*log10(length(x))
} else {
par1 <- as.numeric(par1)
}
par2 <- as.numeric(par2)
par3 <- as.numeric(par3)
par4 <- as.numeric(par4)
par5 <- as.numeric(par5)
if (par6 == 'White Noise') par6 <- 'white' else par6 <- 'ma'
par7 <- as.numeric(par7)
if (par8 != '') par8 <- as.numeric(par8)
ox <- x
if (par8 == '') {
if (par2 == 0) {
x <- log(x)
} else {
x <- (x ^ par2 - 1) / par2
}
} else {
x <- log(x,base=par8)
}
if (par3 > 0) x <- diff(x,lag=1,difference=par3)
if (par4 > 0) x <- diff(x,lag=par5,difference=par4)
bitmap(file='picts.png')
op <- par(mfrow=c(2,1))
plot(ox,type='l',main='Original Time Series',xlab='time',ylab='value')
if (par8=='') {
mytitle <- paste('Working Time Series (lambda=',par2,', d=',par3,', D=',par4,')',sep='')
mysub <- paste('(lambda=',par2,', d=',par3,', D=',par4,', CI=', par7, ', CI type=',par6,')',sep='')
} else {
mytitle <- paste('Working Time Series (base=',par8,', d=',par3,', D=',par4,')',sep='')
mysub <- paste('(base=',par8,', d=',par3,', D=',par4,', CI=', par7, ', CI type=',par6,')',sep='')
}
plot(x,type='l', main=mytitle,xlab='time',ylab='value')
par(op)
dev.off()
bitmap(file='pic1.png')
racf <- acf(x, par1, main='Autocorrelation', xlab='time lag', ylab='ACF', ci.type=par6, ci=par7, sub=mysub)
dev.off()
bitmap(file='pic2.png')
rpacf <- pacf(x,par1,main='Partial Autocorrelation',xlab='lags',ylab='PACF',sub=mysub)
dev.off()
(myacf <- c(racf$acf))
(mypacf <- c(rpacf$acf))
lengthx <- length(x)
sqrtn <- sqrt(lengthx)
load(file='createtable')
a<-table.start()
a<-table.row.start(a)
a<-table.element(a,'Autocorrelation Function',4,TRUE)
a<-table.row.end(a)
a<-table.row.start(a)
a<-table.element(a,'Time lag k',header=TRUE)
a<-table.element(a,hyperlink('basics.htm','ACF(k)','click here for more information about the Autocorrelation Function'),header=TRUE)
a<-table.element(a,'T-STAT',header=TRUE)
a<-table.element(a,'P-value',header=TRUE)
a<-table.row.end(a)
for (i in 2:(par1+1)) {
a<-table.row.start(a)
a<-table.element(a,i-1,header=TRUE)
a<-table.element(a,round(myacf[i],6))
mytstat <- myacf[i]*sqrtn
a<-table.element(a,round(mytstat,4))
a<-table.element(a,round(1-pt(abs(mytstat),lengthx),6))
a<-table.row.end(a)
}
a<-table.end(a)
table.save(a,file='mytable.tab')
a<-table.start()
a<-table.row.start(a)
a<-table.element(a,'Partial Autocorrelation Function',4,TRUE)
a<-table.row.end(a)
a<-table.row.start(a)
a<-table.element(a,'Time lag k',header=TRUE)
a<-table.element(a,hyperlink('basics.htm','PACF(k)','click here for more information about the Partial Autocorrelation Function'),header=TRUE)
a<-table.element(a,'T-STAT',header=TRUE)
a<-table.element(a,'P-value',header=TRUE)
a<-table.row.end(a)
for (i in 1:par1) {
a<-table.row.start(a)
a<-table.element(a,i,header=TRUE)
a<-table.element(a,round(mypacf[i],6))
mytstat <- mypacf[i]*sqrtn
a<-table.element(a,round(mytstat,4))
a<-table.element(a,round(1-pt(abs(mytstat),lengthx),6))
a<-table.row.end(a)
}
a<-table.end(a)
table.save(a,file='mytable1.tab')