Free Statistics

of Irreproducible Research!

Author's title

Author*Unverified author*
R Software Modulerwasp_autocorrelation.wasp
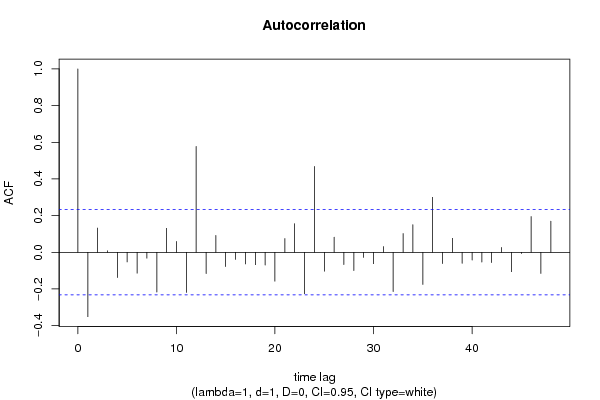
Title produced by software(Partial) Autocorrelation Function
Date of computationMon, 04 Apr 2011 17:40:52 +0000
Cite this page as followsStatistical Computations at FreeStatistics.org, Office for Research Development and Education, URL https://freestatistics.org/blog/index.php?v=date/2011/Apr/04/t1301938640zk0r75rkvgj1cmb.htm/, Retrieved Wed, 08 May 2024 11:37:15 +0000
Statistical Computations at FreeStatistics.org, Office for Research Development and Education, URL https://freestatistics.org/blog/index.php?pk=120172, Retrieved Wed, 08 May 2024 11:37:15 +0000
QR Codes:

Original text written by user:
IsPrivate?No (this computation is public)
User-defined keywordsKDGP2W12
Estimated Impact100
Family? (F = Feedback message, R = changed R code, M = changed R Module, P = changed Parameters, D = changed Data)
-       [(Partial) Autocorrelation Function] [] [2011-04-04 17:40:52] [dc16c24fae4397a85c64c2b70586e631] [Current]
Feedback Forum

Post a new message
Dataseries X:
12544
12264
13783
11214
11453
10883
10381
10348
10024
10805
10796
11907
12261
11377
12689
11474
10992
10764
12164
10409
10398
10349
10865
11630
12221
10884
12019
11021
10799
10423
10484
10450
9906
11049
11281
12485
12849
11380
12079
11366
11328
10444
10854
10434
10137
10992
10906
12367
14371
11695
11546
10922
10670
10254
10573
10239
10253
11176
10719
11817
12503
11510
12012
10941
11252
10662
11114
10415
10626
11411
10936
12513


Summary of computational transaction
Raw Inputview raw input (R code)
Raw Outputview raw output of R engine
Computing time1 seconds
R Server'Gwilym Jenkins' @ www.wessa.org

\begin{tabular}{lllllllll}
\hline
Summary of computational transaction \tabularnewline
Raw Input & view raw input (R code)  \tabularnewline
Raw Output & view raw output of R engine  \tabularnewline
Computing time & 1 seconds \tabularnewline
R Server & 'Gwilym Jenkins' @ www.wessa.org \tabularnewline
\hline
\end{tabular}
%Source: https://freestatistics.org/blog/index.php?pk=120172&T=0

[TABLE]
[ROW][C]Summary of computational transaction[/C][/ROW]
[ROW][C]Raw Input[/C][C]view raw input (R code) [/C][/ROW]
[ROW][C]Raw Output[/C][C]view raw output of R engine [/C][/ROW]
[ROW][C]Computing time[/C][C]1 seconds[/C][/ROW]
[ROW][C]R Server[/C][C]'Gwilym Jenkins' @ www.wessa.org[/C][/ROW]
[/TABLE]
Source: https://freestatistics.org/blog/index.php?pk=120172&T=0

Globally Unique Identifier (entire table): ba.freestatistics.org/blog/index.php?pk=120172&T=0

As an alternative you can also use a QR Code:  

The GUIDs for individual cells are displayed in the table below:

Summary of computational transaction
Raw Inputview raw input (R code)
Raw Outputview raw output of R engine
Computing time1 seconds
R Server'Gwilym Jenkins' @ www.wessa.org


Autocorrelation Function
Time lag kACF(k)T-STATP-value
1-0.351294-2.96010.002089
20.1320091.11230.134874
30.0077240.06510.474144
4-0.137911-1.16210.124552
5-0.052655-0.44370.329313
6-0.113975-0.96040.170064
7-0.032045-0.270.393965
8-0.217077-1.82910.03579
90.1306351.10070.137362
100.0588590.4960.310728
11-0.219245-1.84740.034429
120.577084.86263e-06
13-0.116494-0.98160.164816
140.0920490.77560.220276
15-0.078104-0.65810.256296
16-0.038835-0.32720.372227
17-0.063601-0.53590.296847
18-0.067771-0.5710.284885
19-0.070047-0.59020.278457
20-0.157965-1.3310.093718
210.0748090.63040.265244
220.1558241.3130.096706
23-0.226364-1.90740.030259
240.4684583.94739.2e-05
25-0.103305-0.87050.19349
260.0821310.69210.245581
27-0.067184-0.56610.286554
28-0.099623-0.83940.202022
29-0.028388-0.23920.40582
30-0.062083-0.52310.301259
310.0309060.26040.397648
32-0.214297-1.80570.037602
330.1021610.86080.196116
340.1501261.2650.105006
35-0.175807-1.48140.071466
360.3000152.5280.006849
37-0.061447-0.51780.303117
380.0762490.64250.261314
39-0.060289-0.5080.306513
40-0.042428-0.35750.360886
41-0.053501-0.45080.32675
42-0.05622-0.47370.318578
430.0265770.22390.411722
44-0.106116-0.89410.187132
45-0.006897-0.05810.47691
460.1949371.64260.052447
47-0.115667-0.97460.166527
480.1695271.42850.078773

\begin{tabular}{lllllllll}
\hline
Autocorrelation Function \tabularnewline
Time lag k & ACF(k) & T-STAT & P-value \tabularnewline
1 & -0.351294 & -2.9601 & 0.002089 \tabularnewline
2 & 0.132009 & 1.1123 & 0.134874 \tabularnewline
3 & 0.007724 & 0.0651 & 0.474144 \tabularnewline
4 & -0.137911 & -1.1621 & 0.124552 \tabularnewline
5 & -0.052655 & -0.4437 & 0.329313 \tabularnewline
6 & -0.113975 & -0.9604 & 0.170064 \tabularnewline
7 & -0.032045 & -0.27 & 0.393965 \tabularnewline
8 & -0.217077 & -1.8291 & 0.03579 \tabularnewline
9 & 0.130635 & 1.1007 & 0.137362 \tabularnewline
10 & 0.058859 & 0.496 & 0.310728 \tabularnewline
11 & -0.219245 & -1.8474 & 0.034429 \tabularnewline
12 & 0.57708 & 4.8626 & 3e-06 \tabularnewline
13 & -0.116494 & -0.9816 & 0.164816 \tabularnewline
14 & 0.092049 & 0.7756 & 0.220276 \tabularnewline
15 & -0.078104 & -0.6581 & 0.256296 \tabularnewline
16 & -0.038835 & -0.3272 & 0.372227 \tabularnewline
17 & -0.063601 & -0.5359 & 0.296847 \tabularnewline
18 & -0.067771 & -0.571 & 0.284885 \tabularnewline
19 & -0.070047 & -0.5902 & 0.278457 \tabularnewline
20 & -0.157965 & -1.331 & 0.093718 \tabularnewline
21 & 0.074809 & 0.6304 & 0.265244 \tabularnewline
22 & 0.155824 & 1.313 & 0.096706 \tabularnewline
23 & -0.226364 & -1.9074 & 0.030259 \tabularnewline
24 & 0.468458 & 3.9473 & 9.2e-05 \tabularnewline
25 & -0.103305 & -0.8705 & 0.19349 \tabularnewline
26 & 0.082131 & 0.6921 & 0.245581 \tabularnewline
27 & -0.067184 & -0.5661 & 0.286554 \tabularnewline
28 & -0.099623 & -0.8394 & 0.202022 \tabularnewline
29 & -0.028388 & -0.2392 & 0.40582 \tabularnewline
30 & -0.062083 & -0.5231 & 0.301259 \tabularnewline
31 & 0.030906 & 0.2604 & 0.397648 \tabularnewline
32 & -0.214297 & -1.8057 & 0.037602 \tabularnewline
33 & 0.102161 & 0.8608 & 0.196116 \tabularnewline
34 & 0.150126 & 1.265 & 0.105006 \tabularnewline
35 & -0.175807 & -1.4814 & 0.071466 \tabularnewline
36 & 0.300015 & 2.528 & 0.006849 \tabularnewline
37 & -0.061447 & -0.5178 & 0.303117 \tabularnewline
38 & 0.076249 & 0.6425 & 0.261314 \tabularnewline
39 & -0.060289 & -0.508 & 0.306513 \tabularnewline
40 & -0.042428 & -0.3575 & 0.360886 \tabularnewline
41 & -0.053501 & -0.4508 & 0.32675 \tabularnewline
42 & -0.05622 & -0.4737 & 0.318578 \tabularnewline
43 & 0.026577 & 0.2239 & 0.411722 \tabularnewline
44 & -0.106116 & -0.8941 & 0.187132 \tabularnewline
45 & -0.006897 & -0.0581 & 0.47691 \tabularnewline
46 & 0.194937 & 1.6426 & 0.052447 \tabularnewline
47 & -0.115667 & -0.9746 & 0.166527 \tabularnewline
48 & 0.169527 & 1.4285 & 0.078773 \tabularnewline
\hline
\end{tabular}
%Source: https://freestatistics.org/blog/index.php?pk=120172&T=1

[TABLE]
[ROW][C]Autocorrelation Function[/C][/ROW]
[ROW][C]Time lag k[/C][C]ACF(k)[/C][C]T-STAT[/C][C]P-value[/C][/ROW]
[ROW][C]1[/C][C]-0.351294[/C][C]-2.9601[/C][C]0.002089[/C][/ROW]
[ROW][C]2[/C][C]0.132009[/C][C]1.1123[/C][C]0.134874[/C][/ROW]
[ROW][C]3[/C][C]0.007724[/C][C]0.0651[/C][C]0.474144[/C][/ROW]
[ROW][C]4[/C][C]-0.137911[/C][C]-1.1621[/C][C]0.124552[/C][/ROW]
[ROW][C]5[/C][C]-0.052655[/C][C]-0.4437[/C][C]0.329313[/C][/ROW]
[ROW][C]6[/C][C]-0.113975[/C][C]-0.9604[/C][C]0.170064[/C][/ROW]
[ROW][C]7[/C][C]-0.032045[/C][C]-0.27[/C][C]0.393965[/C][/ROW]
[ROW][C]8[/C][C]-0.217077[/C][C]-1.8291[/C][C]0.03579[/C][/ROW]
[ROW][C]9[/C][C]0.130635[/C][C]1.1007[/C][C]0.137362[/C][/ROW]
[ROW][C]10[/C][C]0.058859[/C][C]0.496[/C][C]0.310728[/C][/ROW]
[ROW][C]11[/C][C]-0.219245[/C][C]-1.8474[/C][C]0.034429[/C][/ROW]
[ROW][C]12[/C][C]0.57708[/C][C]4.8626[/C][C]3e-06[/C][/ROW]
[ROW][C]13[/C][C]-0.116494[/C][C]-0.9816[/C][C]0.164816[/C][/ROW]
[ROW][C]14[/C][C]0.092049[/C][C]0.7756[/C][C]0.220276[/C][/ROW]
[ROW][C]15[/C][C]-0.078104[/C][C]-0.6581[/C][C]0.256296[/C][/ROW]
[ROW][C]16[/C][C]-0.038835[/C][C]-0.3272[/C][C]0.372227[/C][/ROW]
[ROW][C]17[/C][C]-0.063601[/C][C]-0.5359[/C][C]0.296847[/C][/ROW]
[ROW][C]18[/C][C]-0.067771[/C][C]-0.571[/C][C]0.284885[/C][/ROW]
[ROW][C]19[/C][C]-0.070047[/C][C]-0.5902[/C][C]0.278457[/C][/ROW]
[ROW][C]20[/C][C]-0.157965[/C][C]-1.331[/C][C]0.093718[/C][/ROW]
[ROW][C]21[/C][C]0.074809[/C][C]0.6304[/C][C]0.265244[/C][/ROW]
[ROW][C]22[/C][C]0.155824[/C][C]1.313[/C][C]0.096706[/C][/ROW]
[ROW][C]23[/C][C]-0.226364[/C][C]-1.9074[/C][C]0.030259[/C][/ROW]
[ROW][C]24[/C][C]0.468458[/C][C]3.9473[/C][C]9.2e-05[/C][/ROW]
[ROW][C]25[/C][C]-0.103305[/C][C]-0.8705[/C][C]0.19349[/C][/ROW]
[ROW][C]26[/C][C]0.082131[/C][C]0.6921[/C][C]0.245581[/C][/ROW]
[ROW][C]27[/C][C]-0.067184[/C][C]-0.5661[/C][C]0.286554[/C][/ROW]
[ROW][C]28[/C][C]-0.099623[/C][C]-0.8394[/C][C]0.202022[/C][/ROW]
[ROW][C]29[/C][C]-0.028388[/C][C]-0.2392[/C][C]0.40582[/C][/ROW]
[ROW][C]30[/C][C]-0.062083[/C][C]-0.5231[/C][C]0.301259[/C][/ROW]
[ROW][C]31[/C][C]0.030906[/C][C]0.2604[/C][C]0.397648[/C][/ROW]
[ROW][C]32[/C][C]-0.214297[/C][C]-1.8057[/C][C]0.037602[/C][/ROW]
[ROW][C]33[/C][C]0.102161[/C][C]0.8608[/C][C]0.196116[/C][/ROW]
[ROW][C]34[/C][C]0.150126[/C][C]1.265[/C][C]0.105006[/C][/ROW]
[ROW][C]35[/C][C]-0.175807[/C][C]-1.4814[/C][C]0.071466[/C][/ROW]
[ROW][C]36[/C][C]0.300015[/C][C]2.528[/C][C]0.006849[/C][/ROW]
[ROW][C]37[/C][C]-0.061447[/C][C]-0.5178[/C][C]0.303117[/C][/ROW]
[ROW][C]38[/C][C]0.076249[/C][C]0.6425[/C][C]0.261314[/C][/ROW]
[ROW][C]39[/C][C]-0.060289[/C][C]-0.508[/C][C]0.306513[/C][/ROW]
[ROW][C]40[/C][C]-0.042428[/C][C]-0.3575[/C][C]0.360886[/C][/ROW]
[ROW][C]41[/C][C]-0.053501[/C][C]-0.4508[/C][C]0.32675[/C][/ROW]
[ROW][C]42[/C][C]-0.05622[/C][C]-0.4737[/C][C]0.318578[/C][/ROW]
[ROW][C]43[/C][C]0.026577[/C][C]0.2239[/C][C]0.411722[/C][/ROW]
[ROW][C]44[/C][C]-0.106116[/C][C]-0.8941[/C][C]0.187132[/C][/ROW]
[ROW][C]45[/C][C]-0.006897[/C][C]-0.0581[/C][C]0.47691[/C][/ROW]
[ROW][C]46[/C][C]0.194937[/C][C]1.6426[/C][C]0.052447[/C][/ROW]
[ROW][C]47[/C][C]-0.115667[/C][C]-0.9746[/C][C]0.166527[/C][/ROW]
[ROW][C]48[/C][C]0.169527[/C][C]1.4285[/C][C]0.078773[/C][/ROW]
[/TABLE]
Source: https://freestatistics.org/blog/index.php?pk=120172&T=1

Globally Unique Identifier (entire table): ba.freestatistics.org/blog/index.php?pk=120172&T=1

As an alternative you can also use a QR Code:  

The GUIDs for individual cells are displayed in the table below:

Autocorrelation Function
Time lag kACF(k)T-STATP-value
1-0.351294-2.96010.002089
20.1320091.11230.134874
30.0077240.06510.474144
4-0.137911-1.16210.124552
5-0.052655-0.44370.329313
6-0.113975-0.96040.170064
7-0.032045-0.270.393965
8-0.217077-1.82910.03579
90.1306351.10070.137362
100.0588590.4960.310728
11-0.219245-1.84740.034429
120.577084.86263e-06
13-0.116494-0.98160.164816
140.0920490.77560.220276
15-0.078104-0.65810.256296
16-0.038835-0.32720.372227
17-0.063601-0.53590.296847
18-0.067771-0.5710.284885
19-0.070047-0.59020.278457
20-0.157965-1.3310.093718
210.0748090.63040.265244
220.1558241.3130.096706
23-0.226364-1.90740.030259
240.4684583.94739.2e-05
25-0.103305-0.87050.19349
260.0821310.69210.245581
27-0.067184-0.56610.286554
28-0.099623-0.83940.202022
29-0.028388-0.23920.40582
30-0.062083-0.52310.301259
310.0309060.26040.397648
32-0.214297-1.80570.037602
330.1021610.86080.196116
340.1501261.2650.105006
35-0.175807-1.48140.071466
360.3000152.5280.006849
37-0.061447-0.51780.303117
380.0762490.64250.261314
39-0.060289-0.5080.306513
40-0.042428-0.35750.360886
41-0.053501-0.45080.32675
42-0.05622-0.47370.318578
430.0265770.22390.411722
44-0.106116-0.89410.187132
45-0.006897-0.05810.47691
460.1949371.64260.052447
47-0.115667-0.97460.166527
480.1695271.42850.078773


Partial Autocorrelation Function
Time lag kPACF(k)T-STATP-value
1-0.351294-2.96010.002089
20.0098120.08270.467169
30.0651340.54880.292422
4-0.133622-1.12590.131996
5-0.174043-1.46650.073462
6-0.196641-1.65690.050974
7-0.135579-1.14240.128562
8-0.346199-2.91710.002363
9-0.163967-1.38160.085712
100.0056180.04730.481188
11-0.39289-3.31050.000733
120.3055862.57490.006056
130.252922.13110.01827
140.0678950.57210.284532
15-0.144181-1.21490.114216
16-0.05279-0.44480.328903
170.0608280.51250.30493
180.0448190.37760.353409
19-0.134871-1.13640.129796
20-0.009375-0.0790.468629
21-0.036363-0.30640.380099
220.1325881.11720.133837
23-0.120698-1.0170.156299
240.1734741.46170.074116
250.0619620.52210.301613
26-0.066394-0.55940.288809
27-0.042804-0.36070.359708
28-0.062329-0.52520.300543
29-0.026245-0.22110.412809
30-0.022302-0.18790.425739
310.1011270.85210.198508
320.0310950.2620.397035
33-0.024327-0.2050.419086
34-0.007913-0.06670.473512
350.0027670.02330.490733
36-0.103384-0.87110.19331
37-0.034525-0.29090.385984
38-0.026507-0.22330.411952
390.0546920.46080.32316
400.0215770.18180.428124
410.0636010.53590.296848
420.0067740.05710.477323
43-0.097474-0.82130.207103
440.0746090.62870.265793
45-0.000217-0.00180.499272
460.0159610.13450.446698
470.0232960.19630.422471
48-0.022042-0.18570.426594

\begin{tabular}{lllllllll}
\hline
Partial Autocorrelation Function \tabularnewline
Time lag k & PACF(k) & T-STAT & P-value \tabularnewline
1 & -0.351294 & -2.9601 & 0.002089 \tabularnewline
2 & 0.009812 & 0.0827 & 0.467169 \tabularnewline
3 & 0.065134 & 0.5488 & 0.292422 \tabularnewline
4 & -0.133622 & -1.1259 & 0.131996 \tabularnewline
5 & -0.174043 & -1.4665 & 0.073462 \tabularnewline
6 & -0.196641 & -1.6569 & 0.050974 \tabularnewline
7 & -0.135579 & -1.1424 & 0.128562 \tabularnewline
8 & -0.346199 & -2.9171 & 0.002363 \tabularnewline
9 & -0.163967 & -1.3816 & 0.085712 \tabularnewline
10 & 0.005618 & 0.0473 & 0.481188 \tabularnewline
11 & -0.39289 & -3.3105 & 0.000733 \tabularnewline
12 & 0.305586 & 2.5749 & 0.006056 \tabularnewline
13 & 0.25292 & 2.1311 & 0.01827 \tabularnewline
14 & 0.067895 & 0.5721 & 0.284532 \tabularnewline
15 & -0.144181 & -1.2149 & 0.114216 \tabularnewline
16 & -0.05279 & -0.4448 & 0.328903 \tabularnewline
17 & 0.060828 & 0.5125 & 0.30493 \tabularnewline
18 & 0.044819 & 0.3776 & 0.353409 \tabularnewline
19 & -0.134871 & -1.1364 & 0.129796 \tabularnewline
20 & -0.009375 & -0.079 & 0.468629 \tabularnewline
21 & -0.036363 & -0.3064 & 0.380099 \tabularnewline
22 & 0.132588 & 1.1172 & 0.133837 \tabularnewline
23 & -0.120698 & -1.017 & 0.156299 \tabularnewline
24 & 0.173474 & 1.4617 & 0.074116 \tabularnewline
25 & 0.061962 & 0.5221 & 0.301613 \tabularnewline
26 & -0.066394 & -0.5594 & 0.288809 \tabularnewline
27 & -0.042804 & -0.3607 & 0.359708 \tabularnewline
28 & -0.062329 & -0.5252 & 0.300543 \tabularnewline
29 & -0.026245 & -0.2211 & 0.412809 \tabularnewline
30 & -0.022302 & -0.1879 & 0.425739 \tabularnewline
31 & 0.101127 & 0.8521 & 0.198508 \tabularnewline
32 & 0.031095 & 0.262 & 0.397035 \tabularnewline
33 & -0.024327 & -0.205 & 0.419086 \tabularnewline
34 & -0.007913 & -0.0667 & 0.473512 \tabularnewline
35 & 0.002767 & 0.0233 & 0.490733 \tabularnewline
36 & -0.103384 & -0.8711 & 0.19331 \tabularnewline
37 & -0.034525 & -0.2909 & 0.385984 \tabularnewline
38 & -0.026507 & -0.2233 & 0.411952 \tabularnewline
39 & 0.054692 & 0.4608 & 0.32316 \tabularnewline
40 & 0.021577 & 0.1818 & 0.428124 \tabularnewline
41 & 0.063601 & 0.5359 & 0.296848 \tabularnewline
42 & 0.006774 & 0.0571 & 0.477323 \tabularnewline
43 & -0.097474 & -0.8213 & 0.207103 \tabularnewline
44 & 0.074609 & 0.6287 & 0.265793 \tabularnewline
45 & -0.000217 & -0.0018 & 0.499272 \tabularnewline
46 & 0.015961 & 0.1345 & 0.446698 \tabularnewline
47 & 0.023296 & 0.1963 & 0.422471 \tabularnewline
48 & -0.022042 & -0.1857 & 0.426594 \tabularnewline
\hline
\end{tabular}
%Source: https://freestatistics.org/blog/index.php?pk=120172&T=2

[TABLE]
[ROW][C]Partial Autocorrelation Function[/C][/ROW]
[ROW][C]Time lag k[/C][C]PACF(k)[/C][C]T-STAT[/C][C]P-value[/C][/ROW]
[ROW][C]1[/C][C]-0.351294[/C][C]-2.9601[/C][C]0.002089[/C][/ROW]
[ROW][C]2[/C][C]0.009812[/C][C]0.0827[/C][C]0.467169[/C][/ROW]
[ROW][C]3[/C][C]0.065134[/C][C]0.5488[/C][C]0.292422[/C][/ROW]
[ROW][C]4[/C][C]-0.133622[/C][C]-1.1259[/C][C]0.131996[/C][/ROW]
[ROW][C]5[/C][C]-0.174043[/C][C]-1.4665[/C][C]0.073462[/C][/ROW]
[ROW][C]6[/C][C]-0.196641[/C][C]-1.6569[/C][C]0.050974[/C][/ROW]
[ROW][C]7[/C][C]-0.135579[/C][C]-1.1424[/C][C]0.128562[/C][/ROW]
[ROW][C]8[/C][C]-0.346199[/C][C]-2.9171[/C][C]0.002363[/C][/ROW]
[ROW][C]9[/C][C]-0.163967[/C][C]-1.3816[/C][C]0.085712[/C][/ROW]
[ROW][C]10[/C][C]0.005618[/C][C]0.0473[/C][C]0.481188[/C][/ROW]
[ROW][C]11[/C][C]-0.39289[/C][C]-3.3105[/C][C]0.000733[/C][/ROW]
[ROW][C]12[/C][C]0.305586[/C][C]2.5749[/C][C]0.006056[/C][/ROW]
[ROW][C]13[/C][C]0.25292[/C][C]2.1311[/C][C]0.01827[/C][/ROW]
[ROW][C]14[/C][C]0.067895[/C][C]0.5721[/C][C]0.284532[/C][/ROW]
[ROW][C]15[/C][C]-0.144181[/C][C]-1.2149[/C][C]0.114216[/C][/ROW]
[ROW][C]16[/C][C]-0.05279[/C][C]-0.4448[/C][C]0.328903[/C][/ROW]
[ROW][C]17[/C][C]0.060828[/C][C]0.5125[/C][C]0.30493[/C][/ROW]
[ROW][C]18[/C][C]0.044819[/C][C]0.3776[/C][C]0.353409[/C][/ROW]
[ROW][C]19[/C][C]-0.134871[/C][C]-1.1364[/C][C]0.129796[/C][/ROW]
[ROW][C]20[/C][C]-0.009375[/C][C]-0.079[/C][C]0.468629[/C][/ROW]
[ROW][C]21[/C][C]-0.036363[/C][C]-0.3064[/C][C]0.380099[/C][/ROW]
[ROW][C]22[/C][C]0.132588[/C][C]1.1172[/C][C]0.133837[/C][/ROW]
[ROW][C]23[/C][C]-0.120698[/C][C]-1.017[/C][C]0.156299[/C][/ROW]
[ROW][C]24[/C][C]0.173474[/C][C]1.4617[/C][C]0.074116[/C][/ROW]
[ROW][C]25[/C][C]0.061962[/C][C]0.5221[/C][C]0.301613[/C][/ROW]
[ROW][C]26[/C][C]-0.066394[/C][C]-0.5594[/C][C]0.288809[/C][/ROW]
[ROW][C]27[/C][C]-0.042804[/C][C]-0.3607[/C][C]0.359708[/C][/ROW]
[ROW][C]28[/C][C]-0.062329[/C][C]-0.5252[/C][C]0.300543[/C][/ROW]
[ROW][C]29[/C][C]-0.026245[/C][C]-0.2211[/C][C]0.412809[/C][/ROW]
[ROW][C]30[/C][C]-0.022302[/C][C]-0.1879[/C][C]0.425739[/C][/ROW]
[ROW][C]31[/C][C]0.101127[/C][C]0.8521[/C][C]0.198508[/C][/ROW]
[ROW][C]32[/C][C]0.031095[/C][C]0.262[/C][C]0.397035[/C][/ROW]
[ROW][C]33[/C][C]-0.024327[/C][C]-0.205[/C][C]0.419086[/C][/ROW]
[ROW][C]34[/C][C]-0.007913[/C][C]-0.0667[/C][C]0.473512[/C][/ROW]
[ROW][C]35[/C][C]0.002767[/C][C]0.0233[/C][C]0.490733[/C][/ROW]
[ROW][C]36[/C][C]-0.103384[/C][C]-0.8711[/C][C]0.19331[/C][/ROW]
[ROW][C]37[/C][C]-0.034525[/C][C]-0.2909[/C][C]0.385984[/C][/ROW]
[ROW][C]38[/C][C]-0.026507[/C][C]-0.2233[/C][C]0.411952[/C][/ROW]
[ROW][C]39[/C][C]0.054692[/C][C]0.4608[/C][C]0.32316[/C][/ROW]
[ROW][C]40[/C][C]0.021577[/C][C]0.1818[/C][C]0.428124[/C][/ROW]
[ROW][C]41[/C][C]0.063601[/C][C]0.5359[/C][C]0.296848[/C][/ROW]
[ROW][C]42[/C][C]0.006774[/C][C]0.0571[/C][C]0.477323[/C][/ROW]
[ROW][C]43[/C][C]-0.097474[/C][C]-0.8213[/C][C]0.207103[/C][/ROW]
[ROW][C]44[/C][C]0.074609[/C][C]0.6287[/C][C]0.265793[/C][/ROW]
[ROW][C]45[/C][C]-0.000217[/C][C]-0.0018[/C][C]0.499272[/C][/ROW]
[ROW][C]46[/C][C]0.015961[/C][C]0.1345[/C][C]0.446698[/C][/ROW]
[ROW][C]47[/C][C]0.023296[/C][C]0.1963[/C][C]0.422471[/C][/ROW]
[ROW][C]48[/C][C]-0.022042[/C][C]-0.1857[/C][C]0.426594[/C][/ROW]
[/TABLE]
Source: https://freestatistics.org/blog/index.php?pk=120172&T=2

Globally Unique Identifier (entire table): ba.freestatistics.org/blog/index.php?pk=120172&T=2

As an alternative you can also use a QR Code:  

The GUIDs for individual cells are displayed in the table below:

Partial Autocorrelation Function
Time lag kPACF(k)T-STATP-value
1-0.351294-2.96010.002089
20.0098120.08270.467169
30.0651340.54880.292422
4-0.133622-1.12590.131996
5-0.174043-1.46650.073462
6-0.196641-1.65690.050974
7-0.135579-1.14240.128562
8-0.346199-2.91710.002363
9-0.163967-1.38160.085712
100.0056180.04730.481188
11-0.39289-3.31050.000733
120.3055862.57490.006056
130.252922.13110.01827
140.0678950.57210.284532
15-0.144181-1.21490.114216
16-0.05279-0.44480.328903
170.0608280.51250.30493
180.0448190.37760.353409
19-0.134871-1.13640.129796
20-0.009375-0.0790.468629
21-0.036363-0.30640.380099
220.1325881.11720.133837
23-0.120698-1.0170.156299
240.1734741.46170.074116
250.0619620.52210.301613
26-0.066394-0.55940.288809
27-0.042804-0.36070.359708
28-0.062329-0.52520.300543
29-0.026245-0.22110.412809
30-0.022302-0.18790.425739
310.1011270.85210.198508
320.0310950.2620.397035
33-0.024327-0.2050.419086
34-0.007913-0.06670.473512
350.0027670.02330.490733
36-0.103384-0.87110.19331
37-0.034525-0.29090.385984
38-0.026507-0.22330.411952
390.0546920.46080.32316
400.0215770.18180.428124
410.0636010.53590.296848
420.0067740.05710.477323
43-0.097474-0.82130.207103
440.0746090.62870.265793
45-0.000217-0.00180.499272
460.0159610.13450.446698
470.0232960.19630.422471
48-0.022042-0.18570.426594


Parameters (Session):
par1 = 48 ; par2 = 1 ; par3 = 1 ; par4 = 0 ; par5 = 12 ; par6 = White Noise ; par7 = 0.95 ;
Parameters (R input):
par1 = 48 ; par2 = 1 ; par3 = 1 ; par4 = 0 ; par5 = 12 ; par6 = White Noise ; par7 = 0.95 ; par8 = ;
R code (references can be found in the software module):
if (par1 == 'Default') {
par1 = 10*log10(length(x))
} else {
par1 <- as.numeric(par1)
}
par2 <- as.numeric(par2)
par3 <- as.numeric(par3)
par4 <- as.numeric(par4)
par5 <- as.numeric(par5)
if (par6 == 'White Noise') par6 <- 'white' else par6 <- 'ma'
par7 <- as.numeric(par7)
if (par8 != '') par8 <- as.numeric(par8)
ox <- x
if (par8 == '') {
if (par2 == 0) {
x <- log(x)
} else {
x <- (x ^ par2 - 1) / par2
}
} else {
x <- log(x,base=par8)
}
if (par3 > 0) x <- diff(x,lag=1,difference=par3)
if (par4 > 0) x <- diff(x,lag=par5,difference=par4)
bitmap(file='picts.png')
op <- par(mfrow=c(2,1))
plot(ox,type='l',main='Original Time Series',xlab='time',ylab='value')
if (par8=='') {
mytitle <- paste('Working Time Series (lambda=',par2,', d=',par3,', D=',par4,')',sep='')
mysub <- paste('(lambda=',par2,', d=',par3,', D=',par4,', CI=', par7, ', CI type=',par6,')',sep='')
} else {
mytitle <- paste('Working Time Series (base=',par8,', d=',par3,', D=',par4,')',sep='')
mysub <- paste('(base=',par8,', d=',par3,', D=',par4,', CI=', par7, ', CI type=',par6,')',sep='')
}
plot(x,type='l', main=mytitle,xlab='time',ylab='value')
par(op)
dev.off()
bitmap(file='pic1.png')
racf <- acf(x, par1, main='Autocorrelation', xlab='time lag', ylab='ACF', ci.type=par6, ci=par7, sub=mysub)
dev.off()
bitmap(file='pic2.png')
rpacf <- pacf(x,par1,main='Partial Autocorrelation',xlab='lags',ylab='PACF',sub=mysub)
dev.off()
(myacf <- c(racf$acf))
(mypacf <- c(rpacf$acf))
lengthx <- length(x)
sqrtn <- sqrt(lengthx)
load(file='createtable')
a<-table.start()
a<-table.row.start(a)
a<-table.element(a,'Autocorrelation Function',4,TRUE)
a<-table.row.end(a)
a<-table.row.start(a)
a<-table.element(a,'Time lag k',header=TRUE)
a<-table.element(a,hyperlink('basics.htm','ACF(k)','click here for more information about the Autocorrelation Function'),header=TRUE)
a<-table.element(a,'T-STAT',header=TRUE)
a<-table.element(a,'P-value',header=TRUE)
a<-table.row.end(a)
for (i in 2:(par1+1)) {
a<-table.row.start(a)
a<-table.element(a,i-1,header=TRUE)
a<-table.element(a,round(myacf[i],6))
mytstat <- myacf[i]*sqrtn
a<-table.element(a,round(mytstat,4))
a<-table.element(a,round(1-pt(abs(mytstat),lengthx),6))
a<-table.row.end(a)
}
a<-table.end(a)
table.save(a,file='mytable.tab')
a<-table.start()
a<-table.row.start(a)
a<-table.element(a,'Partial Autocorrelation Function',4,TRUE)
a<-table.row.end(a)
a<-table.row.start(a)
a<-table.element(a,'Time lag k',header=TRUE)
a<-table.element(a,hyperlink('basics.htm','PACF(k)','click here for more information about the Partial Autocorrelation Function'),header=TRUE)
a<-table.element(a,'T-STAT',header=TRUE)
a<-table.element(a,'P-value',header=TRUE)
a<-table.row.end(a)
for (i in 1:par1) {
a<-table.row.start(a)
a<-table.element(a,i,header=TRUE)
a<-table.element(a,round(mypacf[i],6))
mytstat <- mypacf[i]*sqrtn
a<-table.element(a,round(mytstat,4))
a<-table.element(a,round(1-pt(abs(mytstat),lengthx),6))
a<-table.row.end(a)
}
a<-table.end(a)
table.save(a,file='mytable1.tab')