Free Statistics
of Irreproducible Research!
Description of Statistical Computation | |||||||||||||||||||||||||||||||||
|---|---|---|---|---|---|---|---|---|---|---|---|---|---|---|---|---|---|---|---|---|---|---|---|---|---|---|---|---|---|---|---|---|---|
| Author's title | |||||||||||||||||||||||||||||||||
| Author | *Unverified author* | ||||||||||||||||||||||||||||||||
| R Software Module | rwasp_meanversusmedian.wasp | ||||||||||||||||||||||||||||||||
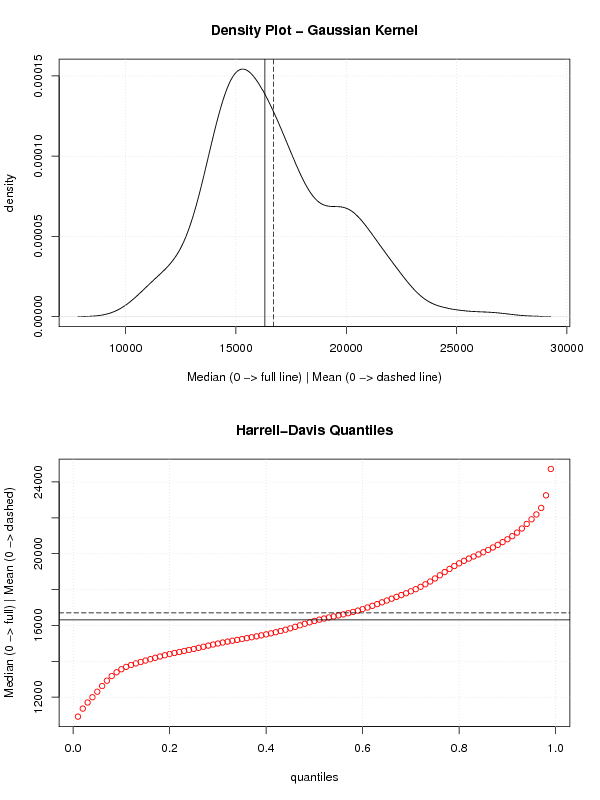
| Title produced by software | Mean versus Median | ||||||||||||||||||||||||||||||||
| Date of computation | Sun, 03 Apr 2011 13:17:08 +0000 | ||||||||||||||||||||||||||||||||
| Cite this page as follows | Statistical Computations at FreeStatistics.org, Office for Research Development and Education, URL https://freestatistics.org/blog/index.php?v=date/2011/Apr/03/t13018364236wyp1t0ibndffxx.htm/, Retrieved Mon, 30 Jun 2025 22:49:44 +0000 | ||||||||||||||||||||||||||||||||
| Statistical Computations at FreeStatistics.org, Office for Research Development and Education, URL https://freestatistics.org/blog/index.php?pk=119985, Retrieved Mon, 30 Jun 2025 22:49:44 +0000 | |||||||||||||||||||||||||||||||||
| QR Codes: | |||||||||||||||||||||||||||||||||
|
| |||||||||||||||||||||||||||||||||
| Original text written by user: | |||||||||||||||||||||||||||||||||
| IsPrivate? | No (this computation is public) | ||||||||||||||||||||||||||||||||
| User-defined keywords | KDGP1W52 | ||||||||||||||||||||||||||||||||
| Estimated Impact | 217 | ||||||||||||||||||||||||||||||||
Tree of Dependent Computations | |||||||||||||||||||||||||||||||||
| Family? (F = Feedback message, R = changed R code, M = changed R Module, P = changed Parameters, D = changed Data) | |||||||||||||||||||||||||||||||||
| - [Mean versus Median] [vgl rekenkundig g...] [2011-04-03 13:17:08] [75b7fe93b57f9e359de9d9cae642ffd9] [Current] | |||||||||||||||||||||||||||||||||
| Feedback Forum | |||||||||||||||||||||||||||||||||
Post a new message | |||||||||||||||||||||||||||||||||
Dataset | |||||||||||||||||||||||||||||||||
| Dataseries X: | |||||||||||||||||||||||||||||||||
1687 0 1508 0 1507 0 1385 0 1632 0 1511 0 1559 0 1630 0 1579 0 1653 0 2152 0 2148 0 1752 0 1765 0 1717 0 1558 0 1575 0 1520 0 1805 0 1800 0 1719 0 2008 0 2242 0 2478 0 2030 0 1655 0 1693 0 1623 0 1805 0 1746 0 1795 0 1926 0 1619 0 1992 0 2233 0 2192 0 2080 0 1768 0 1835 0 1569 0 1976 0 1853 0 1965 0 1689 0 1778 0 1976 0 2397 0 2654 0 2097 0 1963 0 1677 0 1941 0 2003 0 1813 0 2012 0 1912 0 2084 0 2080 0 2118 0 2150 0 1608 0 1503 0 1548 0 1382 0 1731 0 1798 0 1779 0 1887 0 2004 0 2077 0 2092 0 2051 0 1577 0 1356 0 1652 0 1382 0 1519 0 1421 0 1442 0 1543 0 1656 0 1561 0 1905 0 2199 0 1473 0 1655 0 1407 0 1395 0 1530 0 1309 0 1526 0 1327 0 1627 0 1748 0 1958 0 2274 0 1648 0 1401 0 1411 0 1403 0 1394 0 1520 0 1528 0 1643 0 1515 0 1685 0 2000 0 2215 0 1956 0 1462 0 1563 0 1459 0 1446 0 1622 0 1657 0 1638 0 1643 0 1683 0 2050 0 2262 0 1813 0 1445 0 1762 0 1461 0 1556 0 1431 0 1427 0 1554 0 1645 0 1653 0 2016 0 2207 0 1665 0 1361 0 1506 0 1360 0 1453 0 1522 0 1460 0 1552 0 1548 0 1827 0 1737 0 1941 0 1474 0 1458 0 1542 0 1404 0 1522 0 1385 0 1641 0 1510 0 1681 0 1938 0 1868 0 1726 0 1456 0 1445 0 1456 0 1365 0 1487 0 1558 0 1488 0 1684 0 1594 0 1850 0 1998 0 2079 0 1494 0 1057 1 1218 1 1168 1 1236 1 1076 1 1174 1 1139 1 1427 1 1487 1 1483 1 1513 1 1357 1 1165 1 1282 1 1110 1 1297 1 1185 1 1222 1 1284 1 1444 1 1575 1 1737 1 1763 1 | |||||||||||||||||||||||||||||||||
Tables (Output of Computation) | |||||||||||||||||||||||||||||||||
| |||||||||||||||||||||||||||||||||
Figures (Output of Computation) | |||||||||||||||||||||||||||||||||
Input Parameters & R Code | |||||||||||||||||||||||||||||||||
| Parameters (Session): | |||||||||||||||||||||||||||||||||
| Parameters (R input): | |||||||||||||||||||||||||||||||||
| R code (references can be found in the software module): | |||||||||||||||||||||||||||||||||
library(Hmisc) | |||||||||||||||||||||||||||||||||