Free Statistics

of Irreproducible Research!

Author's title

Author*The author of this computation has been verified*
R Software Modulerwasp_samplenorm.wasp
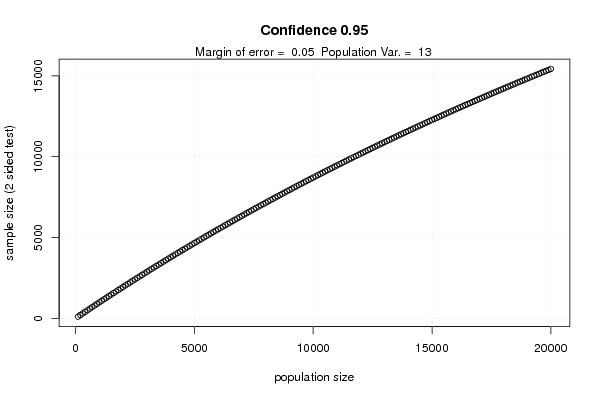
Title produced by softwareMinimum Sample Size - Testing Mean
Date of computationTue, 26 Oct 2010 19:47:49 +0000
Cite this page as followsStatistical Computations at FreeStatistics.org, Office for Research Development and Education, URL https://freestatistics.org/blog/index.php?v=date/2010/Oct/26/t12881224274r5upyerrlfwbei.htm/, Retrieved Sun, 28 Apr 2024 13:07:00 +0000
Statistical Computations at FreeStatistics.org, Office for Research Development and Education, URL https://freestatistics.org/blog/index.php?pk=89602, Retrieved Sun, 28 Apr 2024 13:07:00 +0000
QR Codes:

Original text written by user:
IsPrivate?No (this computation is public)
User-defined keywords
Estimated Impact125
Family? (F = Feedback message, R = changed R code, M = changed R Module, P = changed Parameters, D = changed Data)
-     [Factor Analysis] [Sleep in Mammals ...] [2010-03-21 11:39:53] [b98453cac15ba1066b407e146608df68]
- RMPD  [Testing Mean with unknown Variance - Critical Value] [Hypothesis Test a...] [2010-10-19 11:45:26] [b98453cac15ba1066b407e146608df68]
F RMPD      [Minimum Sample Size - Testing Mean] [] [2010-10-26 19:47:49] [7b390cc0228d34e5578246b07143e3df] [Current]
Feedback Forum
2010-10-30 11:33:07 [7d66e2e510b144c68ca0882fd178e17c] [reply
Je hebt de juiste calculator gebruikt, maar de margin of error en de power heb je verkeerd ingevuld. En je hebt de verkeerde tabel gebruikt bij de analyse.

De margin of error is 1 en Power is 1- de bèta fout= 0,95.

Je bekomt onderstaande ouput:
http://www.freestatistics.org/blog/index.php?v=date/2010/Oct/28/t1288266688ql048qomqz1jo78.htm/

In de eerste en tweede tabel is de variantie gekend. In de derde en vierde kolom is de variantie niet gekend. We moeten kijken in de eerste en tweede tabel omdat in deze vraag de variantie gekend is. Vervolgens kijken we enkel in de eerste tabel omdat bij ons de populatie gekend is nl. 105 mannelijke studenten. Bijgevolg kunnen we besluiten dat de minimum steekproefgrootte voor een éénzijdige test 60 bedraagt. Voor de tweezijdige test is dit 65.

Post a new message


Summary of computational transaction
Raw Inputview raw input (R code)
Raw Outputview raw output of R engine
Computing time2 seconds
R Server'RServer@AstonUniversity' @ vre.aston.ac.uk

\begin{tabular}{lllllllll}
\hline
Summary of computational transaction \tabularnewline
Raw Input & view raw input (R code)  \tabularnewline
Raw Output & view raw output of R engine  \tabularnewline
Computing time & 2 seconds \tabularnewline
R Server & 'RServer@AstonUniversity' @ vre.aston.ac.uk \tabularnewline
\hline
\end{tabular}
%Source: https://freestatistics.org/blog/index.php?pk=89602&T=0

[TABLE]
[ROW][C]Summary of computational transaction[/C][/ROW]
[ROW][C]Raw Input[/C][C]view raw input (R code) [/C][/ROW]
[ROW][C]Raw Output[/C][C]view raw output of R engine [/C][/ROW]
[ROW][C]Computing time[/C][C]2 seconds[/C][/ROW]
[ROW][C]R Server[/C][C]'RServer@AstonUniversity' @ vre.aston.ac.uk[/C][/ROW]
[/TABLE]
Source: https://freestatistics.org/blog/index.php?pk=89602&T=0

Globally Unique Identifier (entire table): ba.freestatistics.org/blog/index.php?pk=89602&T=0

As an alternative you can also use a QR Code:  

The GUIDs for individual cells are displayed in the table below:

Summary of computational transaction
Raw Inputview raw input (R code)
Raw Outputview raw output of R engine
Computing time2 seconds
R Server'RServer@AstonUniversity' @ vre.aston.ac.uk


Minimum Sample Size
Population Size105
Margin of Error0.05
Confidence0.95
Power0.05
Population Variance13
z(alpha/2) + z(beta)3.60481761149153
z(alpha) + z(beta)3.28970725390294
Minimum Sample Size (2 sided test)104.838644118997
Minimum Sample Size (1 sided test)104.806311904276

\begin{tabular}{lllllllll}
\hline
Minimum Sample Size \tabularnewline
Population Size & 105 \tabularnewline
Margin of Error & 0.05 \tabularnewline
Confidence & 0.95 \tabularnewline
Power & 0.05 \tabularnewline
Population Variance & 13 \tabularnewline
z(alpha/2) + z(beta) & 3.60481761149153 \tabularnewline
z(alpha) + z(beta) & 3.28970725390294 \tabularnewline
Minimum Sample Size (2 sided test) & 104.838644118997 \tabularnewline
Minimum Sample Size (1 sided test) & 104.806311904276 \tabularnewline
\hline
\end{tabular}
%Source: https://freestatistics.org/blog/index.php?pk=89602&T=1

[TABLE]
[ROW][C]Minimum Sample Size[/C][/ROW]
[ROW][C]Population Size[/C][C]105[/C][/ROW]
[ROW][C]Margin of Error[/C][C]0.05[/C][/ROW]
[ROW][C]Confidence[/C][C]0.95[/C][/ROW]
[ROW][C]Power[/C][C]0.05[/C][/ROW]
[ROW][C]Population Variance[/C][C]13[/C][/ROW]
[ROW][C]z(alpha/2) + z(beta)[/C][C]3.60481761149153[/C][/ROW]
[ROW][C]z(alpha) + z(beta)[/C][C]3.28970725390294[/C][/ROW]
[ROW][C]Minimum Sample Size (2 sided test)[/C][C]104.838644118997[/C][/ROW]
[ROW][C]Minimum Sample Size (1 sided test)[/C][C]104.806311904276[/C][/ROW]
[/TABLE]
Source: https://freestatistics.org/blog/index.php?pk=89602&T=1

Globally Unique Identifier (entire table): ba.freestatistics.org/blog/index.php?pk=89602&T=1

As an alternative you can also use a QR Code:  

The GUIDs for individual cells are displayed in the table below:

Minimum Sample Size
Population Size105
Margin of Error0.05
Confidence0.95
Power0.05
Population Variance13
z(alpha/2) + z(beta)3.60481761149153
z(alpha) + z(beta)3.28970725390294
Minimum Sample Size (2 sided test)104.838644118997
Minimum Sample Size (1 sided test)104.806311904276


Minimum Sample Size (for Infinite Populations)
Population Sizeinfinite
Margin of Error0.05
Confidence0.95
Power0.05
Population Variance13
z(alpha/2) + z(beta)3.60481761149153
z(alpha) + z(beta)3.28970725390294
Minimum Sample Size (2 sided test)67572.4920630212
Minimum Sample Size (1 sided test)56275.3038451846

\begin{tabular}{lllllllll}
\hline
Minimum Sample Size (for Infinite Populations) \tabularnewline
Population Size & infinite \tabularnewline
Margin of Error & 0.05 \tabularnewline
Confidence & 0.95 \tabularnewline
Power & 0.05 \tabularnewline
Population Variance & 13 \tabularnewline
z(alpha/2) + z(beta) & 3.60481761149153 \tabularnewline
z(alpha) + z(beta) & 3.28970725390294 \tabularnewline
Minimum Sample Size (2 sided test) & 67572.4920630212 \tabularnewline
Minimum Sample Size (1 sided test) & 56275.3038451846 \tabularnewline
\hline
\end{tabular}
%Source: https://freestatistics.org/blog/index.php?pk=89602&T=2

[TABLE]
[ROW][C]Minimum Sample Size (for Infinite Populations)[/C][/ROW]
[ROW][C]Population Size[/C][C]infinite[/C][/ROW]
[ROW][C]Margin of Error[/C][C]0.05[/C][/ROW]
[ROW][C]Confidence[/C][C]0.95[/C][/ROW]
[ROW][C]Power[/C][C]0.05[/C][/ROW]
[ROW][C]Population Variance[/C][C]13[/C][/ROW]
[ROW][C]z(alpha/2) + z(beta)[/C][C]3.60481761149153[/C][/ROW]
[ROW][C]z(alpha) + z(beta)[/C][C]3.28970725390294[/C][/ROW]
[ROW][C]Minimum Sample Size (2 sided test)[/C][C]67572.4920630212[/C][/ROW]
[ROW][C]Minimum Sample Size (1 sided test)[/C][C]56275.3038451846[/C][/ROW]
[/TABLE]
Source: https://freestatistics.org/blog/index.php?pk=89602&T=2

Globally Unique Identifier (entire table): ba.freestatistics.org/blog/index.php?pk=89602&T=2

As an alternative you can also use a QR Code:  

The GUIDs for individual cells are displayed in the table below:

Minimum Sample Size (for Infinite Populations)
Population Sizeinfinite
Margin of Error0.05
Confidence0.95
Power0.05
Population Variance13
z(alpha/2) + z(beta)3.60481761149153
z(alpha) + z(beta)3.28970725390294
Minimum Sample Size (2 sided test)67572.4920630212
Minimum Sample Size (1 sided test)56275.3038451846


Minimum Sample Size (Unknown Population Variance)
Population Size105
Margin of Error0.05
Confidence0.95
Power0.05
Population Varianceunknown
t(alpha/2) + t(beta)3.64273441048846
t(alpha) + t(beta)3.31933054000454
Minimum Sample Size (2 sided test)104.841980677223
Minimum Sample Size (1 sided test)104.809747371183

\begin{tabular}{lllllllll}
\hline
Minimum Sample Size (Unknown Population Variance) \tabularnewline
Population Size & 105 \tabularnewline
Margin of Error & 0.05 \tabularnewline
Confidence & 0.95 \tabularnewline
Power & 0.05 \tabularnewline
Population Variance & unknown \tabularnewline
t(alpha/2) + t(beta) & 3.64273441048846 \tabularnewline
t(alpha) + t(beta) & 3.31933054000454 \tabularnewline
Minimum Sample Size (2 sided test) & 104.841980677223 \tabularnewline
Minimum Sample Size (1 sided test) & 104.809747371183 \tabularnewline
\hline
\end{tabular}
%Source: https://freestatistics.org/blog/index.php?pk=89602&T=3

[TABLE]
[ROW][C]Minimum Sample Size (Unknown Population Variance)[/C][/ROW]
[ROW][C]Population Size[/C][C]105[/C][/ROW]
[ROW][C]Margin of Error[/C][C]0.05[/C][/ROW]
[ROW][C]Confidence[/C][C]0.95[/C][/ROW]
[ROW][C]Power[/C][C]0.05[/C][/ROW]
[ROW][C]Population Variance[/C][C]unknown[/C][/ROW]
[ROW][C]t(alpha/2) + t(beta)[/C][C]3.64273441048846[/C][/ROW]
[ROW][C]t(alpha) + t(beta)[/C][C]3.31933054000454[/C][/ROW]
[ROW][C]Minimum Sample Size (2 sided test)[/C][C]104.841980677223[/C][/ROW]
[ROW][C]Minimum Sample Size (1 sided test)[/C][C]104.809747371183[/C][/ROW]
[/TABLE]
Source: https://freestatistics.org/blog/index.php?pk=89602&T=3

Globally Unique Identifier (entire table): ba.freestatistics.org/blog/index.php?pk=89602&T=3

As an alternative you can also use a QR Code:  

The GUIDs for individual cells are displayed in the table below:

Minimum Sample Size (Unknown Population Variance)
Population Size105
Margin of Error0.05
Confidence0.95
Power0.05
Population Varianceunknown
t(alpha/2) + t(beta)3.64273441048846
t(alpha) + t(beta)3.31933054000454
Minimum Sample Size (2 sided test)104.841980677223
Minimum Sample Size (1 sided test)104.809747371183


Minimum Sample Size(Infinite Population, Unknown Population Variance)
Population Sizeinfinite
Margin of Error0.05
Confidence0.95
Power0.05
Population Varianceunknown
t(alpha/2) + t(beta)3.60487527046942
t(alpha) + t(beta)3.28976140985978
Minimum Sample Size (2 sided test)67574.6537213382
Minimum Sample Size (1 sided test)56277.1566957736

\begin{tabular}{lllllllll}
\hline
Minimum Sample Size(Infinite Population, Unknown Population Variance) \tabularnewline
Population Size & infinite \tabularnewline
Margin of Error & 0.05 \tabularnewline
Confidence & 0.95 \tabularnewline
Power & 0.05 \tabularnewline
Population Variance & unknown \tabularnewline
t(alpha/2) + t(beta) & 3.60487527046942 \tabularnewline
t(alpha) + t(beta) & 3.28976140985978 \tabularnewline
Minimum Sample Size (2 sided test) & 67574.6537213382 \tabularnewline
Minimum Sample Size (1 sided test) & 56277.1566957736 \tabularnewline
\hline
\end{tabular}
%Source: https://freestatistics.org/blog/index.php?pk=89602&T=4

[TABLE]
[ROW][C]Minimum Sample Size(Infinite Population, Unknown Population Variance)[/C][/ROW]
[ROW][C]Population Size[/C][C]infinite[/C][/ROW]
[ROW][C]Margin of Error[/C][C]0.05[/C][/ROW]
[ROW][C]Confidence[/C][C]0.95[/C][/ROW]
[ROW][C]Power[/C][C]0.05[/C][/ROW]
[ROW][C]Population Variance[/C][C]unknown[/C][/ROW]
[ROW][C]t(alpha/2) + t(beta)[/C][C]3.60487527046942[/C][/ROW]
[ROW][C]t(alpha) + t(beta)[/C][C]3.28976140985978[/C][/ROW]
[ROW][C]Minimum Sample Size (2 sided test)[/C][C]67574.6537213382[/C][/ROW]
[ROW][C]Minimum Sample Size (1 sided test)[/C][C]56277.1566957736[/C][/ROW]
[/TABLE]
Source: https://freestatistics.org/blog/index.php?pk=89602&T=4

Globally Unique Identifier (entire table): ba.freestatistics.org/blog/index.php?pk=89602&T=4

As an alternative you can also use a QR Code:  

The GUIDs for individual cells are displayed in the table below:

Minimum Sample Size(Infinite Population, Unknown Population Variance)
Population Sizeinfinite
Margin of Error0.05
Confidence0.95
Power0.05
Population Varianceunknown
t(alpha/2) + t(beta)3.60487527046942
t(alpha) + t(beta)3.28976140985978
Minimum Sample Size (2 sided test)67574.6537213382
Minimum Sample Size (1 sided test)56277.1566957736


Parameters (Session):
par1 = 0.97 ; par2 = 20 ;
Parameters (R input):
par1 = 105 ; par2 = 0.05 ; par3 = 0.95 ; par4 = 13 ; par5 = 0.05 ;
R code (references can be found in the software module):
par1 <- as.numeric(par1)
par2 <- as.numeric(par2)
par3 <- as.numeric(par3)
par4 <- as.numeric(par4)
par5 <- as.numeric(par5)
(z <- abs(qnorm((1-par3)/2)) + abs(qnorm(1-par5)))
(z1 <- abs(qnorm(1-par3)) + abs(qnorm(1-par5)))
z2 <- z*z
z2one <- z1*z1
z24 <- z2 * par4
z24one <- z2one * par4
npop <- array(NA, 200)
ppop <- array(NA, 200)
for (i in 1:200)
{
ppop[i] <- i * 100
npop[i] <- ppop[i] * z24 / (z24 + (ppop[i] - 1) * par2*par2)
}
bitmap(file='pic1.png')
plot(ppop,npop, xlab='population size', ylab='sample size (2 sided test)', main = paste('Confidence',par3))
dumtext <- paste('Margin of error = ',par2)
dumtext <- paste(dumtext,' Population Var. = ')
dumtext <- paste(dumtext, par4)
mtext(dumtext)
grid()
dev.off()
par2sq <- par2 * par2
num <- par1 * z24
denom <- z24 + (par1 - 1) * par2sq
(n <- num/denom)
num1 <- par1 * z24one
denom1 <- z24one + (par1 - 1) * par2sq
(n1 <- num1/denom1)
load(file='createtable')
a<-table.start()
a<-table.row.start(a)
a<-table.element(a,'Minimum Sample Size',2,TRUE)
a<-table.row.end(a)
a<-table.row.start(a)
a<-table.element(a,'Population Size',header=TRUE)
a<-table.element(a,par1)
a<-table.row.end(a)
a<-table.row.start(a)
a<-table.element(a,'Margin of Error',header=TRUE)
a<-table.element(a,par2)
a<-table.row.end(a)
a<-table.row.start(a)
a<-table.element(a,'Confidence',header=TRUE)
a<-table.element(a,par3)
a<-table.row.end(a)
a<-table.row.start(a)
a<-table.element(a,'Power',header=TRUE)
a<-table.element(a,par5)
a<-table.row.end(a)
a<-table.row.start(a)
a<-table.element(a,'Population Variance',header=TRUE)
a<-table.element(a,par4)
a<-table.row.end(a)
a<-table.row.start(a)
a<-table.element(a,'z(alpha/2) + z(beta)',header=TRUE)
a<-table.element(a,z)
a<-table.row.end(a)
a<-table.row.start(a)
a<-table.element(a,'z(alpha) + z(beta)',header=TRUE)
a<-table.element(a,z1)
a<-table.row.end(a)
a<-table.row.start(a)
a<-table.element(a,'Minimum Sample Size (2 sided test)',header=TRUE)
a<-table.element(a,n)
a<-table.row.end(a)
a<-table.row.start(a)
a<-table.element(a,'Minimum Sample Size (1 sided test)',header=TRUE)
a<-table.element(a,n1)
a<-table.row.end(a)
a<-table.end(a)
table.save(a,file='mytable.tab')
(ni <- z24 / (par2sq))
(ni1 <- z24one / (par2sq))
a<-table.start()
a<-table.row.start(a)
a<-table.element(a,'Minimum Sample Size (for Infinite Populations)',2,TRUE)
a<-table.row.end(a)
a<-table.row.start(a)
a<-table.element(a,'Population Size',header=TRUE)
a<-table.element(a,'infinite')
a<-table.row.end(a)
a<-table.row.start(a)
a<-table.element(a,'Margin of Error',header=TRUE)
a<-table.element(a,par2)
a<-table.row.end(a)
a<-table.row.start(a)
a<-table.element(a,'Confidence',header=TRUE)
a<-table.element(a,par3)
a<-table.row.end(a)
a<-table.row.start(a)
a<-table.element(a,'Power',header=TRUE)
a<-table.element(a,par5)
a<-table.row.end(a)
a<-table.row.start(a)
a<-table.element(a,'Population Variance',header=TRUE)
a<-table.element(a,par4)
a<-table.row.end(a)
a<-table.row.start(a)
a<-table.element(a,'z(alpha/2) + z(beta)',header=TRUE)
a<-table.element(a,z)
a<-table.row.end(a)
a<-table.row.start(a)
a<-table.element(a,'z(alpha) + z(beta)',header=TRUE)
a<-table.element(a,z1)
a<-table.row.end(a)
a<-table.row.start(a)
a<-table.element(a,'Minimum Sample Size (2 sided test)',header=TRUE)
a<-table.element(a,ni)
a<-table.row.end(a)
a<-table.row.start(a)
a<-table.element(a,'Minimum Sample Size (1 sided test)',header=TRUE)
a<-table.element(a,ni1)
a<-table.row.end(a)
a<-table.end(a)
table.save(a,file='mytable.tab')
(z <- abs(qt((1-par3)/2,n-1)) + abs(qt(1-par5,n-1)))
(z1 <- abs(qt(1-par3,n1-1)) + abs(qt(1-par5,n1-1)))
z2 <- z*z
z2one <- z1*z1
z24 <- z2 * par4
z24one <- z2one * par4
par2sq <- par2 * par2
num <- par1 * z24
denom <- z24 + (par1 - 1) * par2sq
(n <- num/denom)
num1 <- par1 * z24one
denom1 <- z24one + (par1 - 1) * par2sq
(n1 <- num1/denom1)
a<-table.start()
a<-table.row.start(a)
a<-table.element(a,'Minimum Sample Size (Unknown Population Variance)',2,TRUE)
a<-table.row.end(a)
a<-table.row.start(a)
a<-table.element(a,'Population Size',header=TRUE)
a<-table.element(a,par1)
a<-table.row.end(a)
a<-table.row.start(a)
a<-table.element(a,'Margin of Error',header=TRUE)
a<-table.element(a,par2)
a<-table.row.end(a)
a<-table.row.start(a)
a<-table.element(a,'Confidence',header=TRUE)
a<-table.element(a,par3)
a<-table.row.end(a)
a<-table.row.start(a)
a<-table.element(a,'Power',header=TRUE)
a<-table.element(a,par5)
a<-table.row.end(a)
a<-table.row.start(a)
a<-table.element(a,'Population Variance',header=TRUE)
a<-table.element(a,'unknown')
a<-table.row.end(a)
a<-table.row.start(a)
a<-table.element(a,'t(alpha/2) + t(beta)',header=TRUE)
a<-table.element(a,z)
a<-table.row.end(a)
a<-table.row.start(a)
a<-table.element(a,'t(alpha) + t(beta)',header=TRUE)
a<-table.element(a,z1)
a<-table.row.end(a)
a<-table.row.start(a)
a<-table.element(a,'Minimum Sample Size (2 sided test)',header=TRUE)
a<-table.element(a,n)
a<-table.row.end(a)
a<-table.row.start(a)
a<-table.element(a,'Minimum Sample Size (1 sided test)',header=TRUE)
a<-table.element(a,n1)
a<-table.row.end(a)
a<-table.end(a)
table.save(a,file='mytable.tab')
(z <- abs(qt((1-par3)/2,ni-1)) + abs(qt(1-par5,ni-1)))
(z1 <- abs(qt(1-par3,ni1-1)) + abs(qt(1-par5,ni1-1)))
z2 <- z*z
z2one <- z1*z1
z24 <- z2 * par4
z24one <- z2one * par4
(ni <- z24 / (par2sq))
(ni1 <- z24one / (par2sq))
a<-table.start()
a<-table.row.start(a)
a<-table.element(a,'Minimum Sample Size
(Infinite Population, Unknown Population Variance)',2,TRUE)
a<-table.row.end(a)
a<-table.row.start(a)
a<-table.element(a,'Population Size',header=TRUE)
a<-table.element(a,'infinite')
a<-table.row.end(a)
a<-table.row.start(a)
a<-table.element(a,'Margin of Error',header=TRUE)
a<-table.element(a,par2)
a<-table.row.end(a)
a<-table.row.start(a)
a<-table.element(a,'Confidence',header=TRUE)
a<-table.element(a,par3)
a<-table.row.end(a)
a<-table.row.start(a)
a<-table.element(a,'Power',header=TRUE)
a<-table.element(a,par5)
a<-table.row.end(a)
a<-table.row.start(a)
a<-table.element(a,'Population Variance',header=TRUE)
a<-table.element(a,'unknown')
a<-table.row.end(a)
a<-table.row.start(a)
a<-table.element(a,'t(alpha/2) + t(beta)',header=TRUE)
a<-table.element(a,z)
a<-table.row.end(a)
a<-table.row.start(a)
a<-table.element(a,'t(alpha) + t(beta)',header=TRUE)
a<-table.element(a,z1)
a<-table.row.end(a)
a<-table.row.start(a)
a<-table.element(a,'Minimum Sample Size (2 sided test)',header=TRUE)
a<-table.element(a,ni)
a<-table.row.end(a)
a<-table.row.start(a)
a<-table.element(a,'Minimum Sample Size (1 sided test)',header=TRUE)
a<-table.element(a,ni1)
a<-table.row.end(a)
a<-table.end(a)
table.save(a,file='mytable.tab')